So Where Is The Recession?
Toward the end of 2022 and for the first half of this year, many economists and market analysts were warning investors of a recession starting within the first 6 months of 2023. Despite those widespread warnings, the S&P 500 Index is up 16% YTD as of July 3, 2023, notching one of the strongest 6-month starts to a year in history. So why have so many people been wrong about their prediction and off by so much?
The primary reason is that the U.S. economy and the U.S. stock market are telling us two different stories. The U.S. stock market seems to be telling the story that the worst is behind us, inflation is coming down, and we are at the beginning of a renewed economic growth cycle fueled by the new A.I. technology. But the U.S. economy is telling a very different story. The economic data suggests that the economy is slowing down quickly, higher interest rates are taking their toll on bank lending, the consumer, commercial real estate, and many of the economic indicators that have successfully forecasted a recession in the past are not only flashing red but have become progressively more negative over the past 6 months despite the rally in the stock market.
So are the economists that predicted a recession this year wrong or just early? In this article, we will review both sides of the argument to determine where the stock market may be heading in the second half of 2023.
The Bull Case
Let’s start off by looking at the bull case making the argument that the worst is behind us and the stock market will continue to rally from here.
Strong Labor Markets
The bulls will point to the strength of the U.S. labor market. Due to the shortage of workers in the labor market, companies are still desperate to find employees to hire, and even companies that have experienced a slowdown within the last 6 months are reluctant to layoff employees for fear that they will not be able to hire them back if either a recession is avoided or if it’s just a mild recession.
I agree that the labor market environment is different than previous market cycles, as a business owner myself, I cannot remember the last time it was this difficult to find qualified employees to hire. From the research that we have completed, the main catalyst of this issue stems from a demographic issue within the U.S. labor force. It’s the simple fact that there are a lot more people in the U.S. ages 50 to 70 than there are people ages 20 – 40. You have people retiring in droves, dropping out of the workforce, and there are just not enough people to replace them.
The bulls are making the case that because of this labor shortage, the unemployment rate will remain low, the consumer will retain their spending power, and a recession will be avoided.
Inflation is Dropping Fast
The main risk to the economy over the past 18 months has been the rapid rise in inflation. The bulls will highlight that not only has the inflation dropped but it has dropped quickly. Inflation peaked in June 2022 at around 9% and as of May 2023, the inflation rate has dropped all of the way down to 4% with the Fed’s target at 2% - 3%. The inflation battle is close to being won. As a result of the rapid drop in inflation, the Fed made the decision to pause as opposed to raising the Fed Fund Rate at their last meeting, which is also welcomed news for bullish investors since avoiding additional interest rate hikes and shifting the discussion to Fed Fund rate cuts could eliminate some of the risks of a Fed-induced recession.
The Market Has Already Priced In The Recession
Some bulls will argue that the stock market has already priced in a mild recession which is the reason why the S&P 500 Index was down 19% in 2022, so even if we end up in a recession, the October 2022 market lows will not be retested. Also, since the market was down in 2022, historically it’s a rare occurrence that the market is down two years in a row.
The Bear Case
Now let’s shift gears over to the bear case that would argue that while a recession has not surfaced yet, there are numerous economic indicators that would suggest that there is a very high probability that the U.S. economy will enter a recession within the next 12 months. Full disclosure, we are in this camp and we have been in this camp since December 2021. Admittedly, I am surprised at the “magnitude” of the rally this year but not necessarily surprised at the rally itself.
Bear Market Rallies Are Common
Rarely does the stock market fire a warning shot and then proceed to enter a recession. Historically, it is more common that the stock market experiences what we call a “false rally”, right before the stock market wakes up to the fact that the economy is headed for a recession, followed by a steep selloff but there is always a bull market case that exists that investors want to believe.
The last real recession that we had was the 2008 housing crisis and while investors remember how painful that recession was for their investment accounts, they typically don’t remember what was happening prior to the recession beginning. Leading into the 2008/2009 recession, the S&P 500 Index had rallied 12%, the housing market issues were beginning to surface, but there was still a strong case for a soft landing as the Fed paused interest rate hikes, and began decreasing the Fed Funds Rate at the beginning of 2008, but as we know today the Great Recession occurred anyways.
The Fed Has Never Delivered A Soft Landing
While there is talk of a soft landing with no recession, if you look back in history, anytime the Fed has had to reduce the inflation rate by more than 2%, the Fed rate hike cycle has been followed by a recession every single time. As I mentioned above, the inflation rate peaked at 9% and their target is 2% - 3% so they have to bring down the inflation rate by much more than 2%. If they pull off a soft landing with no recession, it would be the first time that has ever happened.
The Market Bottom
For the bulls that argue that the market is expecting a mild recession and has already priced that in, that would also be the first time that has ever happened. If you look back at the past 9 recessions, how many times in the past 9 recessions did the market bottom PRIOR to the recession beginning? Answer: Zero. In each of the past 9 recessions, the market bottomed at some point during the recession but not before it.
Also, the historical P/E ratio of the S&P 500 Index is a 17. P/E ratios are a wildly used metric to determine whether an investment or index is undervalued, fairly valued, or overvalued. As I write this article on July 3, 2023, the forward P/E of the S&P 500 Index is 22 so the stock market is already arguably overvalued or as others might describe it as “priced to perfection”. So not only is the stock market priced for no recession, it’s priced for significant earnings growth from the companies that are represented within the S&P 500 Index.
A Rally Fueled by 6 Tech Companies
The S&P 500 Index, the stock market, is comprised of 500 of the largest publicly traded companies in the U.S. The S&P Index is a “cap-weighted index” which means the larger the company, the larger the impact on the direction of the index. Why does this matter? In 2023, many of the big tech companies in the U.S. have rallied substantially on the back of the artificial intelligence boom.
As of June 2, 2023, the S&P 500 Index was up 11.4% YTD, and at that time Nvidia one of the top ten largest companies in the S&P 500 was up 171%, Amazon up 49%, Google up 41%. If instead you ignored the size of the companies in the S&P 500 Index and gave equal weight to each of the 500 companies that make up the stock index, the S&P 500 Index would have only been up 1.2% YTD as of June 2, 2023. So this has not been what we consider a broad rally where most of the companies are moving higher. (Data Source for this section: Reuters)
Why is this important? In a truly sustainable growth environment, we tend to see a broad market rally where a large number of companies within the index see a meaningful amount of appreciation and just doesn’t seem to be the case with the stock market rally this year.
2 Predictors of Coming Recessions
There are two economic indicators that have historically been very good at predicting recessions; the yield curve and the Leading Economic Indicators Index. Both started the year flashing red warning signals and despite the stock market rally so far this year, both indicators have moved even more negative within the first 6 months of 2023.
Inverted Yield Curve
The yield curve right now is inverted which historically is a very accurate predictor of a coming recession. Below is a chart of the yield curve going back to 1977, anytime the grey line moved below the red line in the chart, the yield curve is inverted. As you can see, each time the yield curve inverts it’s followed by a recession which are the grey shaded areas within the graph. On the far right side of the chart is where we are now, heavily inverted. If we don’t get a recession within the next 12 months, it would be the first time ever that the yield curve was this inverted and a recession did not occur.
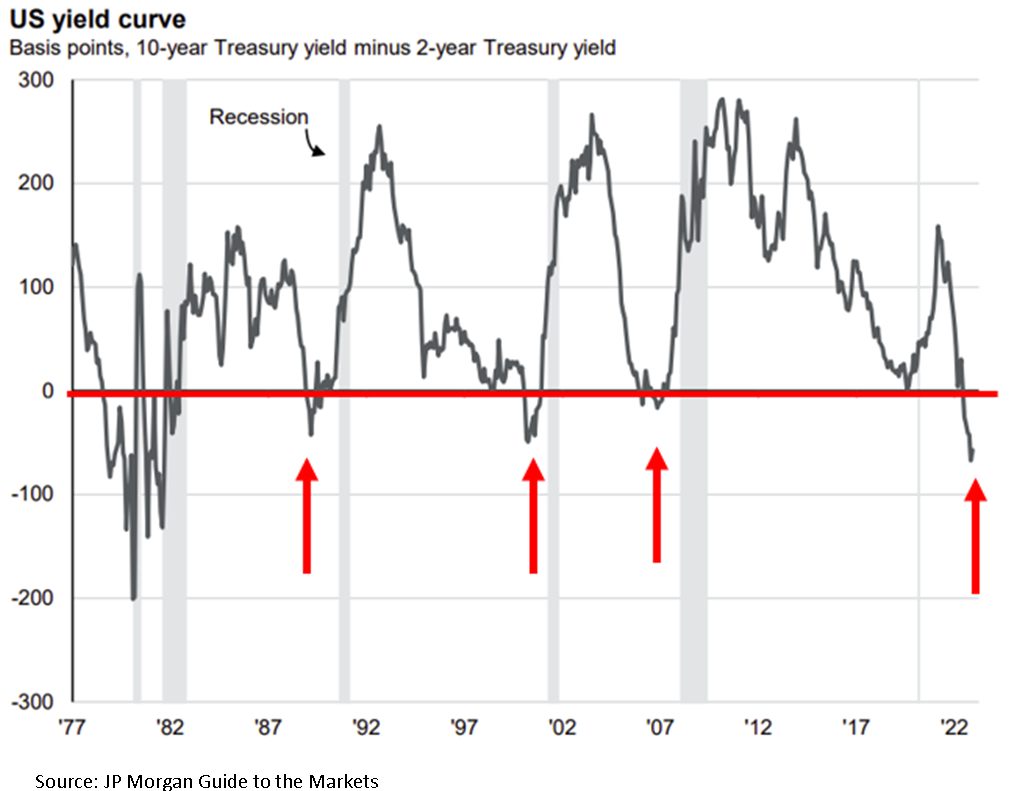
The duration of the inversion is also something to take note of. As of July 2, 2023 the yield curve has been inverted for 159 trading days, since 1962 the longest streak that the yield curve was inverted was 209 trading days ending May 2008 (the beginning of the Great Recession). If the current yield curve stays inverted until mid-September, which is likely, it will break that record.
Leading Economic Indicators Index (LEI Index)
The Leading Economic Indicators index is the second very accurate predictor of a coming recession because as the name suggests the index is comprised of forward-looking economic data including but not limited to manufacturing hours works, building permits, yield curve, consumer confidence, and weekly unemployment claims. The yield curve is a warning from the bond market and the LEI index is a warning from the U.S. economy.
In the chart below, when the blue drops below the red line (where the red arrows are) the LEI index has turned negative, indicating that the forward-looking economic indicators in the U.S. economy are slowing down. The light grey areas are the recessions. As you can see in the chart, shortly after the LEI index goes negative, historically a recession appears shortly after. If you look at where are now on the righthand side of the chart, not only are we negative on the LEI, but we have never been this negative without already being in a recession. Again, if we don’t get a recession within the next 12 months, it would be the first time ever that this indicator did not accurately predict a recession at its current level.

“Well…..This Time It’s Different”
A common phrase that you will hear from the bulls right now is “well…..this time is different” followed by a list of all the reasons why the yield curve, LEI index, and other indicators that are flashing red are no longer a creditable predictor of a coming recession. After being in the investment industry for over 20 years and experiencing the tech bubble bust, housing crisis, Eurozone crisis, and Covid, from my experience, it’s rarely different which is why these predictors of recessions have been so accurate over time. Yes, the market environment is not exactly the same in each time period, sometimes there is a house crisis, other times an energy crisis, or maybe a pandemic, but the impact that monetary policy and fiscal policy have on the economy tend to remain constant over longer periods of time.
Market Timing
It’s very difficult to time the market. I would love to be able to know exactly when the market was peaking and bottoming in each market cycle but the stock market itself throws off so many false readings that become traps for investors. While we rely more heavily on the economic indicators because they have a better track record of predicting market outcomes over the long term, the timing is never spot on but what I have learned over time is that if you are able to sidestep the recessions, and avoid the big 25%+ downturns in an investment portfolio, it often leads to greater outperformance over the long term. Remember, mathematically, if your portfolio drops by 50%, you have to earn a 100% rate of return to get back to breakeven. But it takes discipline to watch these market rallies happen and not feel like you are missing out.
The Consumer’s Uphill Battle
Consumer spending is the number one driver of the U.S. economy and the consumer is going to face multiple headwinds in the second half of 2023. First, student loan payments are set to restart in October. Due to the Covid relief, many individuals with student loans have not been required to make a payment for the past three years and the $10,000 student loan debt cancellation that many people were banking on was recently struck down by the Supreme Court.
Second, while inflation has dropped, the interest rates on mortgages, car loans, and credit cards have not. The inflation rate dropped from 9% in June 2022 to 4% in May 2023 but the 30-year fixed mortgage rate peaked in November at around 7% and as of July 2023 still remains around 6.8%, virtually unchanged, so not a lot of relief for individuals that are trying to buy a house.
This is largely attributed to the third headwind for consumers which is that banks are tightening their lending practices. The banks see the same charts of the economy that we do and when the economy begins slowing down banks begin to tighten their lending standards making it more difficult for consumers and businesses to obtain loans. Even though the stock market has rallied in 2023, banks have continued to tighten their lending standards over the past 6 months and with more limited access to credit, that could put pressure on the economy in the second half of 2023.
Consumer spending has been stronger than expected in 2023 which has helped fuel the stock market rally this year but we can see in the data that a lot of this spending has been done using credit cards and default rates on credit cards and auto loans are rising quickly. So now many consumers have not only spent through their savings but by the end of the year they could have large credit card payments, car payments, higher mortgage/rent payments, and student loan payments.
Reasons for Recession Delay
With all of these clear headwinds for the market, why has the recession not begun yet as so many economists had forecasted at the beginning of 2023? In my opinion, the primary reason for the delay is that it typically takes 9 to 12 months for each Fed rate hike to impact the economy. When the Fed is raising rates, they are intentionally trying to slow down the economy to curb inflation. The Fed just paused for the first time in June 2023 but all of the rate hikes that were implemented in the first half of 2023 have yet to work their way into the economy. This is why you see yet another very consist historically pattern with the Fed Funds Rate. A pattern that I call the “Fed Table Top”. Here is a chart showing the last three Fed rate hike cycles going back to 2000:

You will see the same pattern over time, the Fed raises interest rates to fight inflation which are the moves higher in the chart, they pause at the top of their rate hike cycle which is the “Table Top”, and then a recession appears as a result of their tightening cycle, and they begin dropping interest rates. Once the Fed has reached its pause status or “table top”, some of those pauses last over a year, while other pauses only last a few months. The pause makes sense because again it takes time for all of those rate hikes to impact the economy so it’s never just a straight up and then a straight down in interest rates.
So then that raises the question, how long will this pause be? Honestly, I have no idea, and this is the tricky part again about timing but the pattern has repeated itself time and time again. However, as you can also see in the Fed chart above when you compare the current Fed rate hike cycle to those of the previous 3 cycles, the Fed just raised rates by more than the previous three cycles in a much shorter period of time, that would lead me to believe that this Fed Table Top could be shorter because the 9-month lag of the interest rate hikes on the economy will happen at a greater magnitude compared to the Fed rating rates at 0.25% - 0.50% per meeting as they did in the previous two Fed rate hike cycles.
Bulls or the Bears?
Only time will tell if the economic patterns of the past will remain true and a recession will emerge within the next 12 months or if this time it is truly different, and a recession will be avoided. For investors that have chosen the path of the bull, they will have to remain on their toes, because historically when the turn comes, it comes fast, and with very little warning.

About Michael……...
Hi, I’m Michael Ruger. I’m the managing partner of Greenbush Financial Group and the creator of the nationally recognized Money Smart Board blog . I created the blog because there are a lot of events in life that require important financial decisions. The goal is to help our readers avoid big financial missteps, discover financial solutions that they were not aware of, and to optimize their financial future.


