So Where Is The Recession?
Toward the end of 2022 and for the first half of this year, many economics and market analysts were warning investors of a recession starting within the first 6 months of 2023. Despite those widespread warnings, the S&P 500 Index is up 16% YTD as of July 3, 2023, notching one of the strongest 6-month starts to a year in history. So why have so many people been wrong about their prediction and off by so much?
Toward the end of 2022 and for the first half of this year, many economists and market analysts were warning investors of a recession starting within the first 6 months of 2023. Despite those widespread warnings, the S&P 500 Index is up 16% YTD as of July 3, 2023, notching one of the strongest 6-month starts to a year in history. So why have so many people been wrong about their prediction and off by so much?
The primary reason is that the U.S. economy and the U.S. stock market are telling us two different stories. The U.S. stock market seems to be telling the story that the worst is behind us, inflation is coming down, and we are at the beginning of a renewed economic growth cycle fueled by the new A.I. technology. But the U.S. economy is telling a very different story. The economic data suggests that the economy is slowing down quickly, higher interest rates are taking their toll on bank lending, the consumer, commercial real estate, and many of the economic indicators that have successfully forecasted a recession in the past are not only flashing red but have become progressively more negative over the past 6 months despite the rally in the stock market.
So are the economists that predicted a recession this year wrong or just early? In this article, we will review both sides of the argument to determine where the stock market may be heading in the second half of 2023.
The Bull Case
Let’s start off by looking at the bull case making the argument that the worst is behind us and the stock market will continue to rally from here.
Strong Labor Markets
The bulls will point to the strength of the U.S. labor market. Due to the shortage of workers in the labor market, companies are still desperate to find employees to hire, and even companies that have experienced a slowdown within the last 6 months are reluctant to layoff employees for fear that they will not be able to hire them back if either a recession is avoided or if it’s just a mild recession.
I agree that the labor market environment is different than previous market cycles, as a business owner myself, I cannot remember the last time it was this difficult to find qualified employees to hire. From the research that we have completed, the main catalyst of this issue stems from a demographic issue within the U.S. labor force. It’s the simple fact that there are a lot more people in the U.S. ages 50 to 70 than there are people ages 20 – 40. You have people retiring in droves, dropping out of the workforce, and there are just not enough people to replace them.
The bulls are making the case that because of this labor shortage, the unemployment rate will remain low, the consumer will retain their spending power, and a recession will be avoided.
Inflation is Dropping Fast
The main risk to the economy over the past 18 months has been the rapid rise in inflation. The bulls will highlight that not only has the inflation dropped but it has dropped quickly. Inflation peaked in June 2022 at around 9% and as of May 2023, the inflation rate has dropped all of the way down to 4% with the Fed’s target at 2% - 3%. The inflation battle is close to being won. As a result of the rapid drop in inflation, the Fed made the decision to pause as opposed to raising the Fed Fund Rate at their last meeting, which is also welcomed news for bullish investors since avoiding additional interest rate hikes and shifting the discussion to Fed Fund rate cuts could eliminate some of the risks of a Fed-induced recession.
The Market Has Already Priced In The Recession
Some bulls will argue that the stock market has already priced in a mild recession which is the reason why the S&P 500 Index was down 19% in 2022, so even if we end up in a recession, the October 2022 market lows will not be retested. Also, since the market was down in 2022, historically it’s a rare occurrence that the market is down two years in a row.
The Bear Case
Now let’s shift gears over to the bear case that would argue that while a recession has not surfaced yet, there are numerous economic indicators that would suggest that there is a very high probability that the U.S. economy will enter a recession within the next 12 months. Full disclosure, we are in this camp and we have been in this camp since December 2021. Admittedly, I am surprised at the “magnitude” of the rally this year but not necessarily surprised at the rally itself.
Bear Market Rallies Are Common
Rarely does the stock market fire a warning shot and then proceed to enter a recession. Historically, it is more common that the stock market experiences what we call a “false rally”, right before the stock market wakes up to the fact that the economy is headed for a recession, followed by a steep selloff but there is always a bull market case that exists that investors want to believe.
The last real recession that we had was the 2008 housing crisis and while investors remember how painful that recession was for their investment accounts, they typically don’t remember what was happening prior to the recession beginning. Leading into the 2008/2009 recession, the S&P 500 Index had rallied 12%, the housing market issues were beginning to surface, but there was still a strong case for a soft landing as the Fed paused interest rate hikes, and began decreasing the Fed Funds Rate at the beginning of 2008, but as we know today the Great Recession occurred anyways.
The Fed Has Never Delivered A Soft Landing
While there is talk of a soft landing with no recession, if you look back in history, anytime the Fed has had to reduce the inflation rate by more than 2%, the Fed rate hike cycle has been followed by a recession every single time. As I mentioned above, the inflation rate peaked at 9% and their target is 2% - 3% so they have to bring down the inflation rate by much more than 2%. If they pull off a soft landing with no recession, it would be the first time that has ever happened.
The Market Bottom
For the bulls that argue that the market is expecting a mild recession and has already priced that in, that would also be the first time that has ever happened. If you look back at the past 9 recessions, how many times in the past 9 recessions did the market bottom PRIOR to the recession beginning? Answer: Zero. In each of the past 9 recessions, the market bottomed at some point during the recession but not before it.
Also, the historical P/E ratio of the S&P 500 Index is a 17. P/E ratios are a wildly used metric to determine whether an investment or index is undervalued, fairly valued, or overvalued. As I write this article on July 3, 2023, the forward P/E of the S&P 500 Index is 22 so the stock market is already arguably overvalued or as others might describe it as “priced to perfection”. So not only is the stock market priced for no recession, it’s priced for significant earnings growth from the companies that are represented within the S&P 500 Index.
A Rally Fueled by 6 Tech Companies
The S&P 500 Index, the stock market, is comprised of 500 of the largest publicly traded companies in the U.S. The S&P Index is a “cap-weighted index” which means the larger the company, the larger the impact on the direction of the index. Why does this matter? In 2023, many of the big tech companies in the U.S. have rallied substantially on the back of the artificial intelligence boom.
As of June 2, 2023, the S&P 500 Index was up 11.4% YTD, and at that time Nvidia one of the top ten largest companies in the S&P 500 was up 171%, Amazon up 49%, Google up 41%. If instead you ignored the size of the companies in the S&P 500 Index and gave equal weight to each of the 500 companies that make up the stock index, the S&P 500 Index would have only been up 1.2% YTD as of June 2, 2023. So this has not been what we consider a broad rally where most of the companies are moving higher. (Data Source for this section: Reuters)
Why is this important? In a truly sustainable growth environment, we tend to see a broad market rally where a large number of companies within the index see a meaningful amount of appreciation and just doesn’t seem to be the case with the stock market rally this year.
2 Predictors of Coming Recessions
There are two economic indicators that have historically been very good at predicting recessions; the yield curve and the Leading Economic Indicators Index. Both started the year flashing red warning signals and despite the stock market rally so far this year, both indicators have moved even more negative within the first 6 months of 2023.
Inverted Yield Curve
The yield curve right now is inverted which historically is a very accurate predictor of a coming recession. Below is a chart of the yield curve going back to 1977, anytime the grey line moved below the red line in the chart, the yield curve is inverted. As you can see, each time the yield curve inverts it’s followed by a recession which are the grey shaded areas within the graph. On the far right side of the chart is where we are now, heavily inverted. If we don’t get a recession within the next 12 months, it would be the first time ever that the yield curve was this inverted and a recession did not occur.
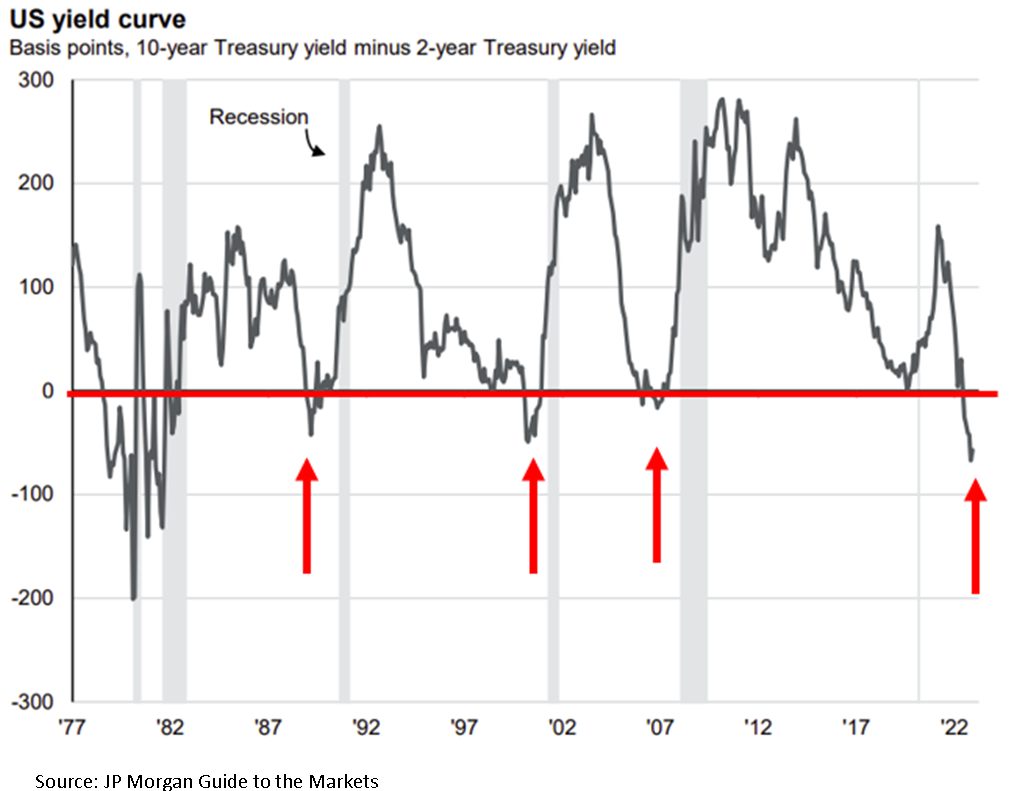
The duration of the inversion is also something to take note of. As of July 2, 2023 the yield curve has been inverted for 159 trading days, since 1962 the longest streak that the yield curve was inverted was 209 trading days ending May 2008 (the beginning of the Great Recession). If the current yield curve stays inverted until mid-September, which is likely, it will break that record.
Leading Economic Indicators Index (LEI Index)
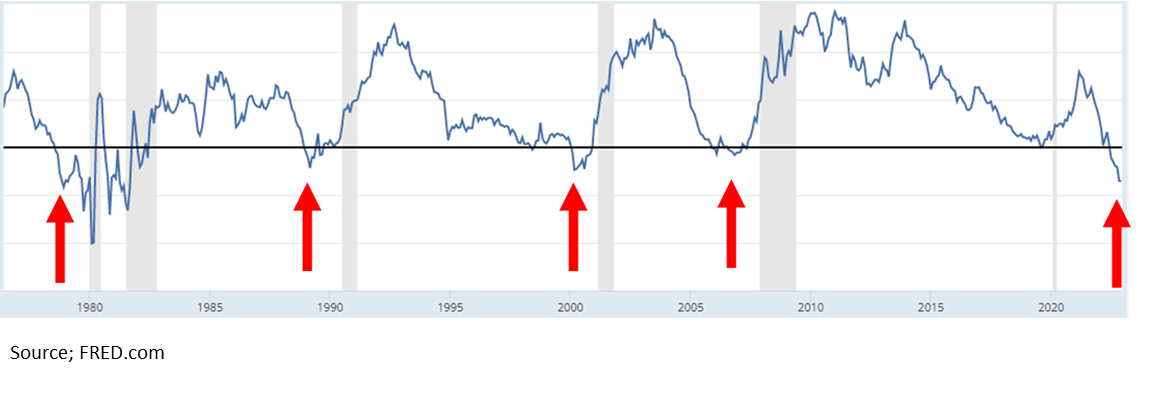
The Leading Economic Indicators index is the second very accurate predictor of a coming recession because as the name suggests the index is comprised of forward-looking economic data including but not limited to manufacturing hours works, building permits, yield curve, consumer confidence, and weekly unemployment claims. The yield curve is a warning from the bond market and the LEI index is a warning from the U.S. economy.
In the chart below, when the blue drops below the red line (where the red arrows are) the LEI index has turned negative, indicating that the forward-looking economic indicators in the U.S. economy are slowing down. The light grey areas are the recessions. As you can see in the chart, shortly after the LEI index goes negative, historically a recession appears shortly after. If you look at where are now on the righthand side of the chart, not only are we negative on the LEI, but we have never been this negative without already being in a recession. Again, if we don’t get a recession within the next 12 months, it would be the first time ever that this indicator did not accurately predict a recession at its current level.

“Well…..This Time It’s Different”
A common phrase that you will hear from the bulls right now is “well…..this time is different” followed by a list of all the reasons why the yield curve, LEI index, and other indicators that are flashing red are no longer a creditable predictor of a coming recession. After being in the investment industry for over 20 years and experiencing the tech bubble bust, housing crisis, Eurozone crisis, and Covid, from my experience, it’s rarely different which is why these predictors of recessions have been so accurate over time. Yes, the market environment is not exactly the same in each time period, sometimes there is a house crisis, other times an energy crisis, or maybe a pandemic, but the impact that monetary policy and fiscal policy have on the economy tend to remain constant over longer periods of time.
Market Timing
It’s very difficult to time the market. I would love to be able to know exactly when the market was peaking and bottoming in each market cycle but the stock market itself throws off so many false readings that become traps for investors. While we rely more heavily on the economic indicators because they have a better track record of predicting market outcomes over the long term, the timing is never spot on but what I have learned over time is that if you are able to sidestep the recessions, and avoid the big 25%+ downturns in an investment portfolio, it often leads to greater outperformance over the long term. Remember, mathematically, if your portfolio drops by 50%, you have to earn a 100% rate of return to get back to breakeven. But it takes discipline to watch these market rallies happen and not feel like you are missing out.
The Consumer’s Uphill Battle
Consumer spending is the number one driver of the U.S. economy and the consumer is going to face multiple headwinds in the second half of 2023. First, student loan payments are set to restart in October. Due to the Covid relief, many individuals with student loans have not been required to make a payment for the past three years and the $10,000 student loan debt cancellation that many people were banking on was recently struck down by the Supreme Court.
Second, while inflation has dropped, the interest rates on mortgages, car loans, and credit cards have not. The inflation rate dropped from 9% in June 2022 to 4% in May 2023 but the 30-year fixed mortgage rate peaked in November at around 7% and as of July 2023 still remains around 6.8%, virtually unchanged, so not a lot of relief for individuals that are trying to buy a house.
This is largely attributed to the third headwind for consumers which is that banks are tightening their lending practices. The banks see the same charts of the economy that we do and when the economy begins slowing down banks begin to tighten their lending standards making it more difficult for consumers and businesses to obtain loans. Even though the stock market has rallied in 2023, banks have continued to tighten their lending standards over the past 6 months and with more limited access to credit, that could put pressure on the economy in the second half of 2023.
Consumer spending has been stronger than expected in 2023 which has helped fuel the stock market rally this year but we can see in the data that a lot of this spending has been done using credit cards and default rates on credit cards and auto loans are rising quickly. So now many consumers have not only spent through their savings but by the end of the year they could have large credit card payments, car payments, higher mortgage/rent payments, and student loan payments.
Reasons for Recession Delay
With all of these clear headwinds for the market, why has the recession not begun yet as so many economists had forecasted at the beginning of 2023? In my opinion, the primary reason for the delay is that it typically takes 9 to 12 months for each Fed rate hike to impact the economy. When the Fed is raising rates, they are intentionally trying to slow down the economy to curb inflation. The Fed just paused for the first time in June 2023 but all of the rate hikes that were implemented in the first half of 2023 have yet to work their way into the economy. This is why you see yet another very consist historically pattern with the Fed Funds Rate. A pattern that I call the “Fed Table Top”. Here is a chart showing the last three Fed rate hike cycles going back to 2000:

You will see the same pattern over time, the Fed raises interest rates to fight inflation which are the moves higher in the chart, they pause at the top of their rate hike cycle which is the “Table Top”, and then a recession appears as a result of their tightening cycle, and they begin dropping interest rates. Once the Fed has reached its pause status or “table top”, some of those pauses last over a year, while other pauses only last a few months. The pause makes sense because again it takes time for all of those rate hikes to impact the economy so it’s never just a straight up and then a straight down in interest rates.
So then that raises the question, how long will this pause be? Honestly, I have no idea, and this is the tricky part again about timing but the pattern has repeated itself time and time again. However, as you can also see in the Fed chart above when you compare the current Fed rate hike cycle to those of the previous 3 cycles, the Fed just raised rates by more than the previous three cycles in a much shorter period of time, that would lead me to believe that this Fed Table Top could be shorter because the 9-month lag of the interest rate hikes on the economy will happen at a greater magnitude compared to the Fed rating rates at 0.25% - 0.50% per meeting as they did in the previous two Fed rate hike cycles.
Bulls or the Bears?
Only time will tell if the economic patterns of the past will remain true and a recession will emerge within the next 12 months or if this time it is truly different, and a recession will be avoided. For investors that have chosen the path of the bull, they will have to remain on their toes, because historically when the turn comes, it comes fast, and with very little warning.

About Michael……...
Hi, I’m Michael Ruger. I’m the managing partner of Greenbush Financial Group and the creator of the nationally recognized Money Smart Board blog . I created the blog because there are a lot of events in life that require important financial decisions. The goal is to help our readers avoid big financial missteps, discover financial solutions that they were not aware of, and to optimize their financial future.


Why Did Silicon Valley Bank Fail? The Contagion Risk
This week, Silicon Valley Bank (SVB), the 16th largest bank in the United States, became insolvent in a matter of 48 hours. The bank now sits in the hands of the FDIC which has sent ripples across the financial markets.
This week, Silicon Valley Bank (SVB), the 16th largest bank in the United States, became insolvent in a matter of 48 hours. The bank now sits in the hands of the FDIC which has sent ripples across the financial markets. In this article, I’m going to address:
What caused SVB to fail?
The contagion risk for the banking sector
The business fallout for start-ups
How this could impact Fed policy
FDIC insurance coverage
Silicon Valley Bank
SVB has been in business for 40 years and at the time of the failure, had about $209 Billion in total assets, ranking it as the 16th largest bank in the U.S., so not a small or new bank. But it’s important to acknowledge that this bank was unique when compared to its peers in the banking sector. This bank was known for its concentrated lending to start-up tech companies and venture capital firms.
SVB Isolated Event?
Before we discuss the contagion factors associated with the SVB failure, there are definitely catalysts for this insolvency that were probably specific just to Silicon Valley Bank. Since the bank had such a high concentration of lending practices to start-ups and venture capital firms, that in itself exposed the bank to higher risk when comparing it to traditional bank lending practices. While most major banks in some form or another, lend money to start-up companies, it’s typically not a high percentage of their overall loan portfolio. Over the years, Silicon Valley Bank has become known as the “go-to lender” for start-ups and venture capital firms.
What is a venture capital firm?
Venture capital firms, otherwise known as “VC’s”, are large investment companies that essentially raise money, and then invest that capital primarily and start-up companies. Venture capital firms will sometimes take loans from banks, like SVB, and then invest that money in start-up companies with the hopes of earning a superior rate of return. For example, a venture capital firm could requests a $50 million loan at a 5% interest rate and then invests that money into 5 different start-up companies, with the hopes of earning a return greater than 5% interest rate that they are paying to the bank.
Start-up lending is risky
Lending money to start-up companies generally carries a higher risk than lending money to long-term, cash-stable companies. It’s not uncommon for start-up companies to be producing little to no revenue because they have a promising business idea that has yet to see wide spread adoption. Then add into the mix, the reality that a lot of these start-up companies fail before reaching profitability.
For this reason, if you have a bank, like SVB that has a high concentration of lending activity to start-ups and venture capital firms, they are naturally going to have more risk than a bank that does not engage in concentrated lending activities to this sector of the market.
A Challenging Market Environment For Start-Ups
In 2020 in 2021, the start-up market was booming because there was so much capital injected into the US economy from the Covid stimulus packages issued by the US government. That favorable liquidity environment changed dramatically in 2022 when inflation got out of control, and then the Federal Reserve started quantitative tightening, essentially pulling that cash back out of the economy. This lack of liquidity and higher interest rates put stress on the start-up industry, who depends, mainly on loans and new capital investment to keep operations going. Given this adverse market environment for start-ups, there has been an increase in the number of start-up defaulting on their loans, running out of cash, and going bankrupt. Since SVB’s loan portfolio is heavily concentrated in that start-up sector of the market, they would naturally feel more pain than their peers that have less exposure.
This gives way to the argument that this could in fact just be an unfortunate isolated incident by a bank that overextended its level of risk to a sector of the market that due to monetary tightening by the Fed has gotten crushed over the past year.
However, in the midst of the failure of SVB, another risk has surfaced that could spell trouble for the rest of the banking industry in the coming weeks.
The Contagion Risk
There is some contagion risk associated with what has happened with the failure of SVB which is why I think you saw a rapid drop in the price of other bank stocks, especially small regional banks, over the past two days. The contagion risk centers around, not their loan portfolio, but rather the assets that SVB was holding as reserves that many other banks hold as well, which rendered them unable to meet the withdrawal request of their depositors, and ultimately created a run on the bank.
The Treasury Bond Issue
When banks take in money from depositors, one of the ways that a bank makes money is by taking those deposits that are sitting on the bank’s balance sheet and investing them in “safe” securities which allow the bank to earn interest on that money until their clients request withdrawals. It’s not uncommon for banks to invest that money in low-risk fixed-income investments like U.S. Treasury Bonds which principal and interest payments are backed by U.S. government.
SVB was holding many of these Treasuries and other fixed-income securities when these start-up companies began to default on their loans which then spooked the individuals and companies that still had money on deposit with SVB, worried that the bank might fail, and they started requesting large withdrawals, which then required SVB to begin selling their fixed income assets to raise cash to meet the redemption requests.
Herein lies the problem. While the value of a U.S. Treasury Bond is backed by the U.S. Government, meaning they promise to hand you back the face value of that bond when it matures, the value of that bond can fluctuate in value while it’s waiting to reach maturity. In other words, if you sell the bond before its maturity date, you could lose money.
The enemy of bond prices is rising interest rates because when interest rates go up, bond prices go down. Over the past 12 months, in an effort to fight inflation, the Fed has increased interest rates bigger and faster than it ever has within the past 50 years. So banks, like SVB, that were most likely buying bonds back in 2017, 2018, and 2019 before interest rates skyrocketed, if they were holding longer duration bonds hoping to hold them to maturity, the prices of those bonds are most likely underwater.
Below is a chart that shows price decline of U.S. Treasury Bonds in 2022 based on the duration of the bonds:
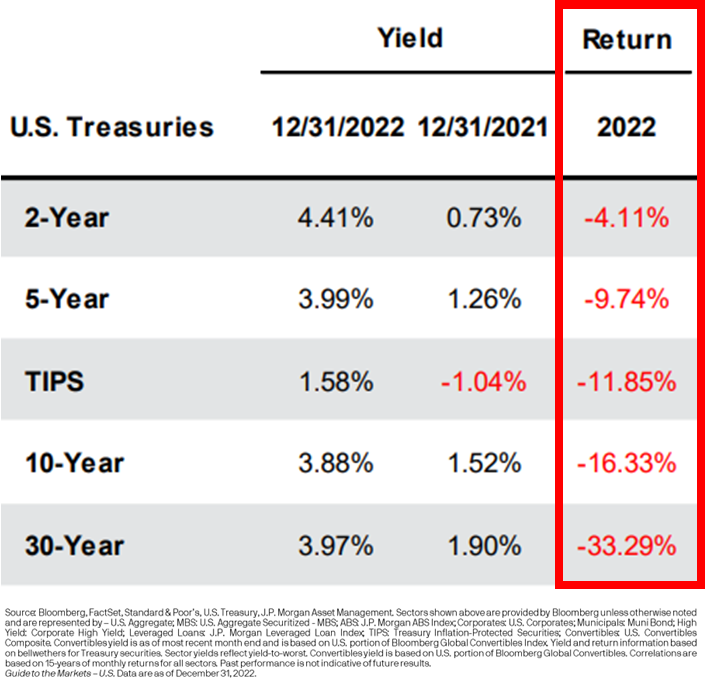
As you can see on the chart, in 2022, the price of a 5 Year US Treasury Bond declined by 9.74% but if you owned a 30 Year U.S. Treasury Bond, the price of that bond declines by 33.29% in 2022. Ouch!!
SVB Forced To Sell Assets At A Bad Time
When a bank needs to raise capital to either make up for loan defaults or because depositors are requesting their cash back, if they do not have enough liquid cash on hand, then they have to begin selling their reserve investments to raise cash. Again, if SVB was buying longer duration bonds back in 2018 and 2019, the intent might have been to hold those bonds until maturity, but the run on their bank forced them to sell those bonds at a loss, so they no longer had the cash to meet the redemption requests.
Will This Problem Spread To Other Banks?
While other banks may not lend as heavily to start-up companies, it is not uncommon at all for banks to purchase Treasuries and other fixed-income securities with their cash reserves. With the economy facing a potential recession in 2023, this has investors asking, what if defaults begin to rise on auto loans, mortgages, and lines of credit during a recession, and then these other banks are forced to liquidate their fixed-income assets at a loss, rendering them unable to meet redemption requests?
Over the next few weeks, this is the exact type of analysis that is probably going to take place at banks across the U.S. banking sector. It’s no longer just a question of “how much does a bank have in reserve assets?” but “What type of assets are being held by the bank and if redemptions increased dramatically would they have the cash to meet those redemption requests?”
The answer may very well be “Yes, there is no reason to panic.” SVB may end up being an isolated incident, not only because they had overexposure to high-risk start-up companies but also because they made poor choices with the fixed-income securities that they purchased with longer durations which compounded the issues when redemptions flooded in and they were forced to sell them at a loss. It’s too early to know for sure so we will have to wait and see.
Change In Fed Policy
This SVB failure could absolutely have an impact on Fed policy. If the Fed realizes that by continuing to push interest rates higher, it could create larger losses in these Treasury cash reserve portfolios at banks across the U.S., a recession shows up, redemptions at banks increase, and then more banks face the same fate as SVB due to the forced selling of those bonds at a loss, it may prompt the Fed to only raise rates by 25bps at the next Fed meeting instead of 50bps.
The reality is we have not seen interest rates rise this fast or by this magnitude within the last 50 years, so the Fed has to be aware that things can begin to break within the U.S. economy that were not intended to break. While getting inflation back down to the 2% - 3% level is the Fed’s primary focus right now, it will be interesting to see if they acknowledge some of these outlier events like SVB failure at the next Fed meeting.
FDIC Insurance
The FDIC has stepped in and taken control of Silicon Valley Bank. Banks have something called FDIC insurance which basically protects an individual’s deposits at a bank up to $250,000 if the bank were to be rendered insolvent. The FDIC saw the run on the bank and basically stepped in to make sure the remainder of the bank’s assets were being preserved as much as possible to meet their $250,000 protection obligation. But there is no protection for individuals and companies that had balances over $250,000 and considering this was a big bank, there are probably a lot of clients of the bank that fall into that category. Not just small companies either. For example, Roku came out on Friday and announced they had approximately $487 Million on deposit with Silicon Valley Bank (Source: CNBC).
The FDIC has issued preliminary guidance that the $250,000 protected amount should be available to depositors for withdrawal but Monday, March 13th, but there has been little to no guidance on what is going to happen to clients of SVB that had balances over $250,000. How much are they going to be able to recoup? When will they have access to that money?
The Business Fallout
Investors are probably going to see a lot of headlines over the next few weeks about businesses not being able to meet payroll or businesses going bankrupt due to SVB failure. Since SVB had a large concentration of start-up companies as clients, this may be more pronounced because many start-ups are not producing enough cash yet to sustain operations. If a company had their business checking account at SVB, depending on the answers from the FDIC as to how much money over the $250,000 they will be able to recoup, and when will they have access to the cash, some of these companies could fold just because they lost access to their cash which is very sad and unfortunate collateral damage from this banking fallout.
Isolated Incident or Contagion?
On the surface, the failure of Silicon Valley Bank may end up being an isolated event that does not spread to the rest of the banking industry but sitting here today, it’s too early to know that for sure. If there are other banks out there that have made similar mistakes by taking on too much duration in their bond portfolio prior to the rapid rise in interest rates, they could potentially face similar redemption problems if the U.S. economy sinks into a recession and defaults and redemption requests start piling up. A lot will depend on the results of these bank asset stress tests, Fed policy, and the direction of the economy over the next 12 months.
About Michael……...
Hi, I’m Michael Ruger. I’m the managing partner of Greenbush Financial Group and the creator of the nationally recognized Money Smart Board blog . I created the blog because there are a lot of events in life that require important financial decisions. The goal is to help our readers avoid big financial missteps, discover financial solutions that they were not aware of, and to optimize their financial future.

2023 Market Outlook: A New Problem Emerges
While the markets are still very focused on the battle with inflation, a new problem is going to emerge in 2023 that is going to take it’s place. The markets have experienced a relief rally in November and December but we expect the rally to fade quickly going into 2023.
While the markets are still very focused on the battle with inflation, a new problem is going to emerge in 2023 that is going to take its place. The markets have experienced a relief rally in November and December, but we expect the rally to fade quickly going into 2023.
Inflation Trend and Fed Policy
I’m writing this article on December 15, 2022, and this week, we received the inflation reading for November and the Fed’s 0.50% interest rate hike. Headline CPI, the primary measure of inflation, dropped from 7.7% in October to 7.1% in November which is a meaningful decline, most likely signaling that peak inflation is behind us. So why such a grim outlook for 2023? One word……History. If you look at the historical trends of meaningful economic indicators and compare them to what the data is telling us now, the message to us is it will be nothing short of a Christmas miracle for the U.S. economy to avoid a recession in 2023.
The Inflation Battle Will Begin at 5%
While it's encouraging to see the inflation rate dropping, the true battle will begin once the year-over-year inflation rate measured by headline CPI reaches the 5% - 6% range. Inflation most likely peaked in June 2022 at 9% and dropped to 7.1% in November, but remember, the Fed’s target range for inflation is 2% - 3%, so we still have at least another 4% to go.
RECESSION RISK #1: If you look back through U.S. history, the Fed has never successfully reduced the inflation rate by more than 2% WITHOUT causing a recession. We have already dropped by 2%, and we still have another 4% to go.
I expect the next 3 months to show meaningful drops in the inflation rate and would not be surprised if we are in a 5% - 6% range by March or April, largely because supply chains have healed, the economy is slowing, the price of oil has come down substantially, and the job market is beginning to soften. But once we get down to the 5% - 6% range, we could see slow progress, which could end the party for investors that are stilling in the bull rally camp.
The Wage Growth Battle
We expect progress to be halted because of the shortage of supply of workers in the labor force, which will keep wages persistently higher, allowing the US consumer to keep paying higher prices for goods and services, which will leave us with higher interest rates for longer. Every time Powell has spoken over the past few months (the head of the Federal Reserve), he expresses his concerns that wages remain far too high. The solution is simple but ugly. The Fed needs to continue to apply pressure on the economy until the unemployment rate begins to rise which will bring wage growth level down to a level that will allow them to reach their 2% - 3% target inflation range.
Companies Are Reluctant To Let Go of Employees
Since one of the major issues plaguing US businesses is trying to find employees, companies will be more reluctant to let go of employee with the fear that they will need them once the economy begins to recover. This situation could create an abrupt spike and the unemployment rate when companies are finally forced to give in all at once to the reality that they will need to shed employees due to the slowing economy.
Rising Unemployment
Another lesson from history, if you look back at the past 9 recessions, how many times did the stock market bottom BEFORE the recession began? Answer: ZERO. So, if you think the bottom is already in the stock market but you also believe that there is a high probability that the U.S. economy will enter a recession in 2023, you are on the wrong side of history.
When we look back at the past 9 recessions, there is a common trend. As you would expect, when the economy begins to contract, people lose their jobs, which causes the unemployment rate to rise. In all of the past 9 recessions, the stock market did not bottom until AFTER the unemployment rate began to rise. If you think there is a high probability that the unemployment rate will rise in 2023, which is what the Fed is targeting to bring down wage growth, then we most likely have not seen the market bottom in this bear market cycle.
JP Morgan has a great chart summarizing this point across the past 9 recessions. While it looks like a lot is going on in this illustration, each chart shows one of the past 9 recessions.
The Purple Line = Unemployment Rate
The Black Straight Line = Where the stock market bottomed
The Gray Area = The recession
In each of the charts below, observe how the purple line begin to rise and then the solid black line follows in each chart. That would support the trend that the bottom in the stock market historically happens after the unemployment rate begin it’s climb which has not happened yet.

A New Problem Will Emerge
While the markets have been super focused on inflation in 2022, a new problem is going to surface in 2023. The economy is going to trade its inflation problem for the reality of a weakening U.S. consumer.
The Fed will be successful at slowing down the economy via their rate hikes, which will eventually lead to job losses, weakness in the housing market, a slowdown in consumer spending on goods and travel, and less capital spending. Those forces should be enough to deliver the two quarters of negative GDP growth in 2023, which would coincide with a recession.
The Fed Will Have Its Hands Tied
Normally, when the economy begins to contract, the Fed will step in and begin lowering interest rates to restart economic growth. However, if the inflation rate, while moving lower, is still between 4% and 5% when the economic slowdown hits, the Fed will not be able to come to the economy’s aid with fear that premature reductions in the fed funds rate could reignite inflation which is exactly what happened in the 1970s.
The recession itself will eventually bring inflation down to the Feds 2% inflation target, but while it’s happening, it’s going to feel like you are watching a train wreck in slow motion, but you can’t do anything about it. Not a great environment for the stock market.
Length of the recession
The next question I receive is, do we expect a mild recession or severe recession? I’ll be completely honest, it’s impossible to know. A lot will depend on the timing of when the economy begins to contract and where the rate of inflation is. The longer it takes inflation to get down to the 2% range while the economy contracts, the longer and more severe the recession will be. This absolutely could end up being a mild recession but there’s no way to know that sitting here in December 2022, looking at all of the challenges that lie ahead for the markets in 2023.
An Opportunity For Bonds
Due to the rising interest rates in 2022, the bond market has had one of the worst years in history. Below is a chart showing the annual returns of the aggregate bond index going back to 1970.

We have never seen a year where bonds are down 11% in a single year. It’s our expectation that this trend will reverse course in 2023. When interest rates stop rising, the Fed pauses and eventually begins lowering rates, that should be a positive environment for fixed-income returns. Where bonds failed to give investors any type of safety net in 2022, I think that safety net will return in 2023. We are already beginning to see evidence of interest rates moving lower, with the 10-year US Treasury yields moving from 4.2% down to the current rate of 3.5% over the past 45 days.
Warnings From The Inverted Yield Curve
While a number of the economic indicators that we watching are flashing red going into 2023, there are very few that tell the story better than the inverted yield curve. Without getting into all the technical details about what an inverted yield curve is, the simple version of this explanation is, it's basically the bond market telling the stock market that trouble is on the horizon. Historically, when the yield curve inverts, The US economy enters a recession within the next 6 to 18 months. See below, a chart of the yield curve going back to 1970.
Each of the red arrows is where the yield curve inverts. The gray areas on the chart are the recessions. You can see very quickly how consistent the yield curve inversion has been at predicting recessions over time. If you look on the far right-hand side of the chart, that red arrow is where we are now, heavily inverted. So if you believe that we are not going to get a recession within the next 6 to 18 months, you are sitting heavily on the wrong side of history and have adopted a “this time it's different” mentality which can be dangerous. History tends to repeat itself more times than people like to admit.
Proactive investment decisions
Going into 2023, I think it's very important to be realistic about your expectations for the equity markets, given the headwinds that we face. This market environment is going to require very proactive investment decisions and constant monitoring of the economic data as we receive it throughout the year. A mild recession is entirely possible. If we end up in a mild recession, inflation drops down into the Feds comfort range due to the contracting economy, and the Fed can begin lowering rates before the end of 2023, that could put a bottom in the stock market, and the next bull market rally could emerge. But it's just too early to know that sitting here in December 2022 with a lot of headwinds facing the market.
About Michael……...
Hi, I’m Michael Ruger. I’m the managing partner of Greenbush Financial Group and the creator of the nationally recognized Money Smart Board blog . I created the blog because there are a lot of events in life that require important financial decisions. The goal is to help our readers avoid big financial missteps, discover financial solutions that they were not aware of, and to optimize their financial future.

Government Savings Bonds (I Bonds) Are Paying A 9.62% Interest Rate
U.S. Government Savings Bonds called I Bonds are currently paying an interest rate of 9.62%. There are certain restrictions associated with these bonds that you should be aware of……..

There are U.S. Government Savings Bonds, called “I Bonds”, that are currently paying a 9.62% interest rate as of August 2022, you can continue to buy the bonds at that interest rate until October 2022, and then the rate resets. Before you buy these bonds, you should know the 9.62% interest rate is only for the first 6 months that you own the bonds and there are restrictions as to when you can redeem the bonds. In this article I will cover:
How do I Bonds works?
Are they safe investments?
Purchase limits
Why does the interest rate vary over the life of the bond?
How do you purchase an I Bond?
Redemption restrictions
Tax considerations
How do I Bonds Work?
I Bonds are issued directly from the U.S. Treasury. These bonds earn interest that compounds every six months but the interest is not paid to the bondholder until the bond is either redeemed or when the bond matures (30 years from the issue date).
Variable Interest Rate
Unlike a bank CD that pays the same interest rate until it matures, an I Bond has a variable interest rate the fluctuates every 6 months based on the rate of inflation. There are two components that make up the I Bond’s interest rate:
The Fixed Rate
The Inflation Rate
The fixed rate, as the name suggests, stays the same over the life of the bond. The fixed rate on the I Bonds that are being issued until October 31, 2022 is 0%.
The inflation rate portion of the bond interest usually varies every 6 months. A new inflation rate is set by the Treasury in May and in November. The inflation rate is based on the non-seasonally adjusted Consumer Price Index for all Urban Consumers (CPI-U) for all items, excluding food and energy. You can find the rates that the bonds are currently paying via this link: I Bond Rates
The total initial interest rate ends up being the Fixed Rate + the Inflation Rate which is currently 9.62%. But that initial interest rate only lasts for the first 6 months that you own the bond, after the first 6 months, the new inflation rate is used to determine what interest rate your bond will pay for the next 6 months. Your 6 month cycle is based on when you purchased your bond, here is the chart:

For example, if you purchase an I Bond in September 2022 at a current rate of 9.62%, that bond will accumulate 4.81% in interest over the next 6 months (50% of the annual 9.62% rate) and then on March 1, 2023, you will receive the new rate based on the new inflation rate. Between March 2023 – August 2023, you will receive that new rate, and then it will be recalculated again on September 1, 2023. This pattern continues until you redeem the bond.
Was The Fixed Rate Ever Higher Than 0%?
Yes, in May 2019, the fixed rate was 0.50% but the last time it was above 1% was November 2007.
Can These Bonds Lose Value?
To keep my compliance department happy, I’m going to quote this directly from the U.S. Treasury Direct website:
“No. The interest rate can’t go below zero and the redemption value of your I bond can’t decline” (Source www.treasurydirect.com)
These bonds are viewed as very safe investments.
Purchase Restrictions $10,000 - $15,000 Per Year
There are purchase restrictions on these bonds but it’s not income based. They restrict purchases to $10,000 - $15,000 each calendar year PER tax ID. Why the $10,000 to $15,000 range? Most taxpayers are restricted to purchasing $10,000 per calendar year but if you are due a federal tax refund, they allow you to buy up to an additional $5,000 with your tax refund, so an individual with a large enough federal tax return, could purchase up to $15,000 in a given calendar year.
If your married, you can purchase $10,000 for your spouse and $10,000 for yourself.
Self Employed Individuals
If you are self employed and your company has an EIN, your company would be allowed to purchase $10,000 in the EIN number.
Trusts Can Purchase I Bonds
If you have a trust that has an EIN number, your trust may be eligible to purchase $10,000 worth of I Bonds each year.
Gift An I Bond
You can buy a bond in the name and social security number of someone else, this is common when parents purchase a bond for their child, or grandparents for their grandchildren.
$80,000 Worth of I Bonds In A Single Year
Let’s look at an extreme hypothetical example of how someone could make an $80,000 purchase of I Bonds in a single year. You have a family that is comprised of two parents and three children, one of the parents owns an accounting firm setup as an S-Corp, and the parents each have a trust with a Tax ID.
Parent 1: $10,000
Parent 2: $10,000
Child 1: $10,000
Child 2: $10,000
Child 3: $10,000
S-Corp: $10,000
Parent 1 Trust: $10,000
Parent 2 Trust: $10,000
Total: $80,000
The $80,000 is just for one calendar year. If this structure stays the same, they could keep purchasing $80,000 worth of I Bonds each year. Given what’s happened with the markets this year, investors may welcome a guaranteed 4.61% rate of return over the next 6 months.
Restrictions on Selling Your I Bonds
You are not allowed to sell your I Bond within 12 months of the issue date. If you decide to sell your bond after 1 year but before 5 years, you will lose the last three months of interest earned by the bond. Once you are past the 5-year holding period, there is no interest penalty for selling the bond.
When Do You Pay Tax On The I Bond Interest?
The interest that you earn on I Bonds is subject to federal income tax but not state or local income tax but you have a choice as to when you want to realize the interest for tax purposes. You can either report the interest each year that is accumulated within the bond or you can wait to realize all of the interest for tax purposes when the bond is redeemed, gifted to another person, or it matures.
Warning: If you elect to realize the interest each year for tax purposes, you must continue to do so every year after for ALL of your saving bonds, and any I Bonds that you acquire in the future.
How Do You Purchase An I Bond?
I Bonds are issued electronically from the Treasury Direct website. You have to establish an online account and purchase the bonds within your account. Paper bonds are not available unless you are purchasing them with your federal tax refund. If you are purchasing I bonds with your federal tax refund, you can elect to take either electronic or paper delivery.
I Bond Minimum Purchase Amount
The minimum purchase amount for an electronic I Bond is $25. Over that threshold, you can purchase any amount you want to the penny. If you wanted to you could purchase an I Bond for $81.53. If you elect to receive paper bonds from a fed tax refund, those are issued in increments of $50, $100, $200, $500, and $1,000.
How Do You Redeem Your I Bonds
If you own the bonds electronically, you can redeem them by logging into your online account at Treasury Direct and click the link for “cashing securities” within the Manage Direct menu.
If you own paper bonds, you can ask your local bank if they cash I Bonds. If they don’t, you will have to mail them to the Treasury Retail Securities Services with FP Form 1522. The mailing address is listed on the form. You DO NOT need to sign the back of the bonds before mailing them in.
What Are Your Savings Bonds Worth?
If you want to know how much your savings bonds are worth before cashing them in, for electronic bonds you can log into to your online account to see the value. If you have paper bonds, you can use the Savings Bond Calculator provided by the Treasury.
DISCLOSURE: This article is for educational purposes only and is not a recommendation to buy I Bonds. Please consult your financial professional for investment advice.
About Michael……...
Hi, I’m Michael Ruger. I’m the managing partner of Greenbush Financial Group and the creator of the nationally recognized Money Smart Board blog . I created the blog because there are a lot of events in life that require important financial decisions. The goal is to help our readers avoid big financial missteps, discover financial solutions that they were not aware of, and to optimize their financial future.

This Market Rally Could Be A Bear Trap!! Here’s why……
The recent stock market rally could end up being a bear market trap for investors. If it is, this would be the 4th bear market trap of 2022.

After a really tough first 6 months of the year, the stock market has been in rally mode, rising over 9% within the last 30 days. It’s left investors anxious to participate in the rally to recapture the losses that were incurred in the first half of the year. Our guidance to clients, while there are plenty of bobbing heads on TV talking about “buying the dip” and trying to call the “bottom” in the market, this could very well be what we call a “bear trap”. A bear trap is a short-term rally that baits investors into thinking the market has bottomed only to find out that they fell for the trap, and experience big losses when the market retreats to new lows.
The 4th Bear Trap In 2022
If the current rally ends up being a bear trap, it would actually be the 4th bear trap so far in 2022.

The green boxes in the chart show when the rallies occurred and the magnitude. Notice how the market moved to a new lower level after each rally, this is a common pattern when you are in a prolonged bear market environment.
So how do you know when the bear market is over and the new sustainable bull market rally has begun? It’s actually pretty simple. Ask yourself, what were the issues that drove the market lower in the first place? Next question, “Is the economy making MEANINGFUL progress to resolve those issues?” If the answer is yes, you may in fact be at the beginning of the rally off of the bottom; if the answer is no, you should resist the temptation to begin loading up on risk assets.
It's Not A Secret
It’s not a secret to anyone that inflation is the main issue plaguing not just the U.S. economy but economies around the world. Everyone is trying to call the “peak” but we did a whole video on why the peak doesn’t matter.
The market cheered the July inflation report showing that headline year over year inflation dropped from 9.1% in June to 8.5% in July. While progress is always a good thing, if the inflation rate keeps dropping by only 0.60% per month, we are going to be in a lot of trouble heading into 2023. Why? As long as the inflation rate (the amount prices are going up) is higher than the wage growth rate (how much more people are making), it will continue to eat away at consumer spending which is the bedrock of the U.S. economy. As of July, wages are growing at only 6.2% year over year. That’s still a big gap until we get to that safety zone.
Understand The Math Behind The CPI Data
While it’s great that the CPI (Consumer Price Index) is dropping, the main CPI number that hits the headlines is the year-over-year change, comparing where prices were 12 months ago to the prices on those same goods today. Let me explain why that is an issue as we look at the CPI data going forward. If I told you I will sell you my coffee mug today for $100, you would say “No way, that’s too expensive.” But a year from now I try and sell you that same coffee mug for $102 and I tell you that the cost of this mug has only risen by 2% over the past year, does that make you more likely to buy it? No, it doesn’t because the price was already too high to begin with.
In August 2021, inflation was already heating up. The CPI headline number for August 2021 was 5.4%, already running above the Fed’s comfort level of 3%. Similar to the example I just gave you above with the coffee mug, if the price of everything was ALREADY at elevated levels a year ago, and it went up another 8.5% on top of that elevated level, why is the market celebrating?
Probability of A 2023 Recession
Even though no single source of data is an accurate predicator as to whether or not we will end up in a recession in 2023, the chart that I am about to show you is being weighted heavily in the investment decisions that we are making for our clients.
Historically an “inverted” yield curve has been a fairly accurate predicator of a coming recession. Without going into all of the details of what causes a yield curve inversion, in its simplest form, it’s the bond market basically telling the stock market that a recession could be on the horizon. The chart below shows all of the yield curve inversions going back to 1970. The red arrows are where the inversion happened and the gray shaded areas are where recession occurred.

Look at where we are right now on the far right-hand side of the chart. There is no question that the yield curve is currently inverted and not just by a little bit. There are two main takeaways from this chart, first, there has been a yield curve inversion prior to every recession going back to 1970, an accurate data point. Second, there is typically a 6 – 18 month delay between the time the yield curve inverts and when the recession actually begins.
Playing The Gap
I want to build off of that last point about the yield curve. Investors will sometimes ask, “if there is historically a 6 – 18 month delay between the inversion and the recession, why would you not take advantage of the market rally and then go to cash before the recession hits?” My answer, if someone could accurately do that on a consistent basis, I would be out of a job, because they would manage all of the money in the world.
Recession Lessons
I have been in the investment industry since 2002. I experienced the end of the tech bubble bust, the Great Recession of 2008/2009, Eurozone Crisis, and 2020 COVID recession. I have learned a number of valuable lessons with regard to managing money prior to and during those recessions that I’m going to share with you now:
It’s very very difficult to time the market. By the time most investors realize we are on the verge of a recession, the market losses have already piled up.
Something typically breaks during the recession that no one expects. For example, in the 2008 Housing Crisis, on the surface it was just an issue with inflated housing prices, but it manifested into a leverage issue that almost took down our entire financial system. The questions becomes if we end up in a recession in 2023, will something break that is not on the surface?
Do not underestimate the power of monetary and fiscal policy.
The Power of Monetary & Fiscal Policy
I want to spend some time elaborating on that third lesson. The Fed is in control of monetary policy which allows them to use interest rates and bond activity to either speed up or slow down the growth rate of the economy. The Fed’s primary tool is the Fed Funds Rate, when they want to stimulate the economy, they lower rates, and when they want to slow the economy down (like they are now), they raise rates.
Fiscal policy uses tax policy to either stimulate or slow down the economy. Similar to what happened during COVID, the government authorized stimulus payments, enhanced tax credits, and created new programs like the PPP to help the economy begin growing again.
Many investors severely underestimate the power of monetary and fiscal stimulus. COVID was a perfect example. The whole world economy came to a standstill for the first time in history, but the Fed stepped in, lowered rates to zero, injected liquidity into the system via bond purchases, and Congress injected close to $7 Trillion dollars in the U.S. economy via all of the stimulus policies. Even though the stock market dropped by 34% within two months at the onset of the COVID crisis in 2020, the S&P 500 ended up posting a return of 16% in 2020.
Now those same powerful forces that allowed the market to rally against unsurmountable odds are now working against the economy. The Fed is raising rates and decreasing liquidity assistance. Since the Fed has control over short term interest rates but not long-term rates, that is what causes the yield curve inversion. Every time the Fed hikes interest rates, it takes time for the impact of those rate hikes to make their way through the economy. Some economists estimate that the delay between the rate hike and the full impact on the economy is 6 – 12 months.
The Fed Is Raising More Aggressively
The Fed right now is not just raising interest rates but raising them at a pace and magnitude that is greater than anything we have seen since the 1970’s. A chart below shows historical data of the Fed Fund Rate going back to 2000.

Look at 2004 and 2016, it looks like a staircase. Historically the Fed has raised rates in small steps of 0.25% - 0.50%. This gives the economy the time that it needs to digest the rate hikes. If you look at where we are now in 2022, the line shoots up like a rocket because they have been raising rates in 0.75% increments and another hike of 0.50% - 0.75% is expected at the next Fed meeting in September. When the Fed hikes rates bigger and faster than it ever has in recent history, it increases the chances that something could “break” unexpectedly 6 to 12 months from now.
Don’t Fight The Fed
You will frequently hear the phrase “Don’t Fight The Fed”. When you look back at history, when the Fed is lowering interest rates in an effort to jump start the economy, it usually works. Conversely, when the Fed is raising rates to slow down the economy to fight inflation, it usually works but it’s a double edged sword. While they may successfully slow down inflation, to do so, they have to slow down the economy, which is traditionally not great news for the stock market.
I have to credit Rob Mangold in our office with this next data point that was eye opening to me, when you look back in history, the Fed has NEVER been able to reduce the inflation rate by more than 2% without causing a recession. Reminder, the inflation rate is at 8.5% right now and they are trying to get the year over year inflation rate back down to the 2% - 3% range. That’s a reduction of a lot more than 2%.
Stimulus Packages Don’t Work
In the 1970’s, when we had hyperinflation, the government made the error of issuing stimulus payments and subsidies to taxpayers to help them pay the higher prices. They discovered very quickly that it was a grave mistake. If there is inflation and the people have more money to spend, it allows them to keep paying those higher prices which creates MORE inflation. That is why in the late 70’s and early 80’s, interest rates rose well above 10%, and it was a horrible decade for the stock market.
In the U.S. we have become accustomed to recessions that are painful but short. The COVID Recession and 2008/2009 Housing Crisis were both painful but short because the government stepped in, lowered interest rates, printed a bunch of money, and got the economy growing again. However, when inflation is the root cause of our pain, unless the government repeats their mistakes from the 1970’s, there is very little the government can do to help until the economy has contracted by enough to curb inflation.
Is This The Anomaly?
Investors have to be very careful over the next 12 months. If by some chance, the economy is able to escape a recession in 2023, based on the historical data, that would be an “anomaly” as opposed to the rule. Over my 20 year career in the industry, I have heard the phrase “well this time it’s different because of X, Y, and Z” but I have found that it rarely is. Invest wisely.
About Michael……...
Hi, I’m Michael Ruger. I’m the managing partner of Greenbush Financial Group and the creator of the nationally recognized Money Smart Board blog . I created the blog because there are a lot of events in life that require important financial decisions. The goal is to help our readers avoid big financial missteps, discover financial solutions that they were not aware of, and to optimize their financial future.

What Causes Bonds To Lose Value In Certain Market Environments?
Bonds are often revered as a safe investment compared to stocks but make no mistake, bonds like other investments are not risk-free, and there are certain market environments where they can lose value. As I write this article in May 2022, the Aggregate Bond Index is currently down 8% year to date.

Bonds are often revered as a safe investment compared to stocks but make no mistake, bonds like other investments are not risk-free, and there are certain market environments where they can lose value. As I write this article in May 2022, the Aggregate Bond Index is currently down 8% year to date. While this is definitely a more extreme year for the bond market, there are other years in the past where bonds have lost value.
How do bonds work?
Bonds in their most basic form are essentially loans paid with interest. Companies, government entities, and countries issue bonds to raise money to fund their operations. When you buy a bond you are essentially lending money to these organizations in return for interest payments and potentially appreciation on the value of the bond. Similar to traditional loans, bonds can default, interest can be fixed or variable, and bonds are issued for varying durations. But unlike loans, the value of your original investment can fluctuate over the life of the bond.
Bond example
Before we get into all of the variables associated with bonds, let’s first look at a basic example. The US government is issuing a 10-year treasury bond with a 3% interest rate. You buy $10,000 worth of bonds so essentially you are lending the US government $10,000 for a duration of 10 years and during that 10 years, the US government will pay you 3% interest every single year, then after 10 years, the bond matures, the US government hands you back your $10,000.
Credit worthiness
Similar to someone asking to borrow money from you, all bond issuers are not created equal. You have to assess the credit worthiness of the company or organization that is issuing the bonds to make sure that they are going to be able to make their interest payments and return your principal at the maturity date. “Maturity date” is just bond lingo for when the bond issuer has to repay you the amount that you lent to them. When the US government issues bonds, they are considered by the market to be some of the safest bonds in the world because they are backed by the credit worthiness of the United States government. It would be a historic event if the US government were to default on its debt because the government can always print more money or raise taxes to make the debt payments. Compare this to a risky company, that is trying to emerge from bankruptcy, and is issuing bonds to raise capital to turn the company around. This could be viewed as a much riskier investment because if you lend that company $10,000, you may never see it again if the company is unable to emerge from bankruptcy successfully. For this reason, you have to be selective as to who is issuing you the bond.
Bond rating agencies
Thankfully there are bond rating agencies that help investors assess the credit worthiness of the bond issuer. The two main credit rating agencies are Standard & Poors and Moody’s. Both have grades that they assign to each bond issuer that can range from AAA for the highest quality issuers all the way down to D. It’s important to look at both rating agencies because they may assign different credit scores or in the bond world called “quality ratings” to a bond issuer. But as we learned during the 2008 and 2009 recession, even the bond rating agencies sometimes make the wrong call, so you should complete your own due diligence in assessing the credit worthiness of a particular bond issuer.
Bond defaults
When a company or government agency defaults on its debt it’s ugly. All of the creditors of the company including the bondholders line up to split up whatever’s left, if there is anything left. There could be a number of creditors that have priority over bondholders of a company even though bondholders have priority over stockholders in a company. If you bought a $10,000 bond from a company that goes bankrupt, you have to wait for the bankruptcy process to play out to find out how much, if any, of your original $10,000 investment will be returned to you.
Bond coupon rate
A bond coupon is the interest rate that is paid to the bondholder each year. If a bond has a 5% coupon that means it pays the bondholder 5% in interest each year over the life of that bond. While there are many factors that determine the interest rate of a bond, two of the primary factors are the credit worthiness of the organization issuing the bonds and the bond’s duration.
The credit worthiness of the bond issuer probably has the greatest weight. If a high-risk company is issuing bonds, investors will most likely demand a high coupon rate compared to a more financial stable company to compensate them for the increased level of risk. If a 10 year US government bond is being issued for a 3% coupon rate, a high-risk corporate bond may be issued at a coupon rate of 7% or more. Higher risk bonds are sometimes referred to as high yield bonds or junk bonds. On the flipside, organizations with higher credit ratings, normally have the luxury of issuing their bonds at lower interest rates because the market views them as safer.
The coupon payments, or interest payments, can be made to the bondholder in different durations during the year depending on the terms of the bond. Some bonds issue interest payments quarterly, semi-annually, once a year, and some bonds don’t issue any interest payments until the bonds matures.
It’s because of this fixed interest-rate structure that high quality bonds are often viewed as a safer investment than stocks because the value of a stock varies every day based on what the value of the company is perceived to be. Whereas bonds just make fixed interest payments and then re-pay you the face value of the bond at a future date. “Face value” is bond lingo for the dollar amount the bond was issued for and the amount that is returned to the bondholder at maturity.
Fixed interest versus variable interest
While most bonds are issued with a fixed interest rate, some bonds have a variable interest rate. If it’s a fixed interest rate, the bond pays the holder a set interest payment over the life of the bond. If it’s a variable interest rate, the interest rate paid to the bond holder can vary throughout the life of the bond. Some of the more common types of bonds that have variable interest rates are floating rate bonds. The interest rate that these bonds pay is typically tied to the variable rate associated with a short term bond benchmark like the LIBOR or the fed funds rate. As the interest of those benchmarks moves up and down, so do the corresponding interest rate paid by the bond.
Duration of a bond
The next big factor that influences the interest rate on a bond is the duration of the bond. “Duration” is bond lingo for the length from time between when the bond is first issued and when the bond matures. Typically, the longer the duration of the bond, the higher the interest rate which makes sense. If a company wants to borrow $10,000 from you for 1 year versus 10 years, as the person lending them the money, you will most likely want a higher interest rate for a 10 year loan versus a 1 year loan because they are holding onto your money for a longer period of time which represents a greater risk to you as the bondholder.
Interest rate risk
Bonds also have something called interest rate risk. Typically, when interest rates rise, the value of a bond falls, and vice versa if interest rates fall, the value of a bond rises. Up until this point, we have really just talked about coupon payments or interest payments made to a bondholder but the bond itself can change in value over the life of the bond. Let’s say a company is issuing bonds at $1,000 face value each, you buy a bond for $1,000 and at maturity you would expect to receive $1,000 back, but from the time that bond is issued and when it matures, you can normally trade that bond in the open market, and the value of that bond could sell for more or less than your original $1,000 investment.
If you buy a bond from a company that is a 10 year bond with a 5% interest rate but then interest rates across the economy begin to fall, and a year from now investors have difficulty finding bonds that are being issued with a 5% interest rate, another investor may pay you more than $1,000 to buy your bond and collect the 5% interest payment for the rest of that bonds life. So instead of just receiving $1,000 for the bond you may receive $1,500. The value paid over and above the bonds face value is considered appreciation which adds to your total return so the total return on a bond investment includes both dividends received and any appreciation if you sell it prior to maturity.
But that is a two way street, using that same example above, let’s say a company issues you a bond for $1,000 paying a 5% coupon, but now interest rates have moved higher over the next year, and that same company is now issuing bonds at a 7% interest rate, no one wants your 5% bond because they can get a higher interest-rate by buying the new bonds today. If you were to try and sell your bond in the open market you may only receive $900 from another investor because again, they can just pay $1,000 by purchasing the new bonds with the higher interest rate.
Holding to maturity
If you hold bonds to their maturity, which means you don’t trade them while you’re waiting for the bond to mature, it eliminates a lot of this interest-rate risk because then it’s just a pure loan. You lent a company $1,000, they pay you interest over the life of the loan, and then they hand you back your $1,000 at maturity. Interest rates do not impact the face value of a bond in most cases.
However, when we talk about bond mutual funds, those bond funds can hold hundreds or thousands of bonds, and those mutual funds are priced by “marking to market” each day, meaning they total up all of the value of the bonds in that portfolio as if they were all being sold at 4pm each day. It’s similar with bond ETFs but they trade intraday. Thus, if you own bonds via mutual funds or ETFs, interest-rate fluctuations will have a greater influence on the total return of your bond investment because there’s no option to just hold it to maturity. Depending on the interest rate environment this could either work for you or against you. The reason why many high-quality bond funds have lost value in 2022 is because interest rates have risen rapidly this year which has caused the value of those bonds to fall.
Duration Matters
There is a correlation between the time to maturity and the impact of interest rates on the price of a bond. The longer the duration of the bond, the more that can happen to interest rates between the time a bond is issued and the time the bond matures. For this reason, when interest rates move, it typically has a greater price impact on longer term bonds versus short-term bond.
Simple example, your own a bond paying 4% that is maturing in 1 year and another bond paying 4% that matures in 20 years, interest rates are moving higher, and the equivalent bonds are now being issued at a 5% coupon rate. Both of your bonds would most likely drop in value but the bond that is maturing in one year will most likely drop by less because they will return your investment sooner, and you can reinvest that money at the new higher rate compared to the 20 year bond that is locked in at the lower interest rate for the next 20 years.
Why would you own a bond mutual fund?
After reading this, I’ll have investors ask, “why would you own a bond mutual fund versus individual bonds if you have this interest rate risk?” For most investors, the answer is diversification. If you have $100,000 to allocate to bonds, purchasing a few different bond funds may be a more efficient and cost-effective way to obtain a diversified bond portfolio compared to purchasing individual bonds. As mentioned earlier, these bond mutual funds may have thousands of bonds within this single investment which have been selected by a professional bond manager that understands all of the intricacies of the fixed income markets. Compare this to an individual investor that now has to go out and select each bond, do their own analysis on a variety of different bond issuer‘s to create diversification of credit, duration, and coupon payments to create their own diversified portfolio. Also, since we’ve been in historically low interest rate environments, many fixing income investors have been reluctant to lock into a bond ladder which is a popular strategy for individual bond investors.
Creating a diversified bond portfolio
Similar to stocks, when investing in bonds, it’s important to create a diversified portfolio to help safeguard bondholders against risk. Within a diversified bond portfolio, you may have bonds with varying credit ratings to help achieve a higher level of interest overall with the safer bond issuer‘s offsetting some of the more risky ones that are paying a higher interest rate. You may have bonds that are varying in duration from short-term, intermediate term, all the way to long-term bonds which may also allow a bond investor to achieve higher rates of return over the long term but maintain the necessary amount of liquidity because the short-term bonds are always maturing and are less sensitive to interest rate risks.
About Michael……...
Hi, I’m Michael Ruger. I’m the managing partner of Greenbush Financial Group and the creator of the nationally recognized Money Smart Board blog . I created the blog because there are a lot of events in life that require important financial decisions. The goal is to help our readers avoid big financial missteps, discover financial solutions that they were not aware of, and to optimize their financial future.
Additional Disclosure: All bonds are subject to interest rate risk and you may lose money. Before investing in, you should carefully consider and understand the risks associated with investing. U.S. Treasury bonds and municipal bonds maybe susceptible to some of the following risks: Lower yields, interest rate risk, call risk, inflation risk and credit or default risk. Investors need to be aware that bonds may have the risk of default.
Is Inflation Peaking? That’s The Wrong Question…….
While a lot of investors are asking if inflation has peaked, there is a more importnat question they should be asking which will have a bigger impact on our path forward…….

As I write this article on May 11, 2022, the inflation number was just released for April indicating an 8.3% increase in the Consumer Price Index (CPI) which is the primary measure of the inflation rate. The news and market analysts seem to be consumed with the question “has inflation peaked?” Since the April CPI reading was below the March CPI of 8.5%, the answer may very well be “yes”, but I think there is a more important question that analysts and investors should be paying attention to and I would argue that the answer to this question will be more meaningful to the markets. Here it is, looking at all of the drivers of inflation right now, how does the inflation rate get back down to a level that will help the U.S. economy to avoid a recession?
Claiming victory that inflation has peaked could be a very short celebration if the level of inflation REMAINS at an elevated level for longer than the market and the Fed expects.
The Inflation Problem Has Become More Complex
At the end of 2021, it seemed to be the consensus that the primary driver of higher inflation was due to supply chain constraints in a post COVID world. The solution to that problem seemed fairly simple, as the global supply chain heals, there will be more goods to buy, and prices will gradually come down throughout 2022; but that has changed now. It’s not just supply chain issues that are driving inflation any longer, we now have:
Global supply chain issues
Russian / Ukraine conflict
Oil still over $100 per barrel
Tight labor markets
Wage growth
Strong corporate earnings but weaker forecasts
Fed policy
I would also argue that some of the inflation catalysts listed above will have a more significant impact on the rate of inflation than just the COVID supply constraints. In this article I’m going to walk you through the trends that we are seeing in each of these inflation catalysts and how they could impact inflation going forward. We do not believe that the market is doomed to enter a recession at this point but with so many more forces driving inflation higher, monitoring what really matters to the longer term inflation trend should be foremost in the mind of investors as the war against inflation enters the second half of the 2022.
Russia / Ukraine Conflict
Russia’s continued assault on Ukraine has caused a number of supply chain disruptions in itself but none more impactful to the U.S. than the price of oil. The price of oil has been over $100 per barrel for months which is huge driver of inflation since goods need to be transported on planes, ships, trucks, and trains. Oil companies are not in a rush to produce more because they are enjoying lofty profits and they realize that the price of oil could come down quickly if the violence ends in Ukraine. This is why they are hesitant to spend a lot of money to bring more production online because the price of oil could drop down to $80 or below within the next few months. Could oil go higher from here? It could. The Chinese economy has recently been hampered by COVID outbreaks so demand for oil has eased within the last month, but if this changes you could see the price of oil hit new highs on increased demand from China and we are about to enter the summer travel season in the U.S. If oil prices stay above $100 per barrel throughout the summer, it may keep inflation at elevated levels for longer than anticipated.
The Price of Oil
We just went through what’s driving the price of oil higher but if the price of oil drops within the next few months it’s not an automatic victory. If the price of oil is dropping because there is more supply coming online or because there is peace in Ukraine that is excellent, that should reduce inflationary pressures. However, if the price of oil is decreasing because demand is beginning to soften because the consumer is beginning to buy less, that’s not a positive indicator.
More Jobs Than Workers
Currently there are 5.9 million unemployed people in the U.S., and as of March there are 11.5M job openings which puts us at 2 job openings for every 1 person looking for work. If you look at the chart below of the total job openings, it’s easy to see that we are in uncharted territory here:
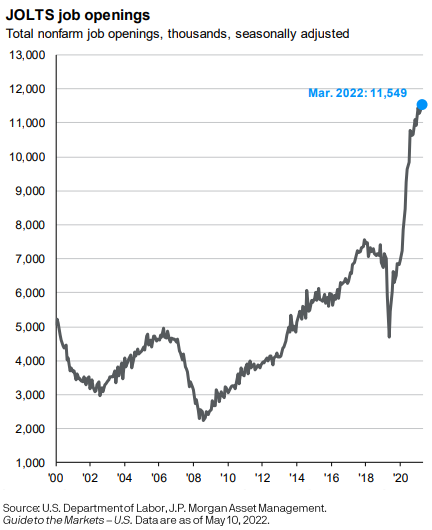
So, when you have more jobs than people looking for work, what do you think is going to happen to wages? They are going to go up. When you look back in history, one of the largest drivers of big inflationary periods is wage growth. Think about it this way, if the government hands you a stimulus check, you will be able to buy more stuff or pay higher prices for goods and services than you normally would, but this is temporary. Once you have spent that government stimulus money, you can no longer afford to pay higher prices.
If you change jobs, and you receive a $30,000 raise, now you can pay higher prices, not just this year but next year, and the year after that. Wage growth creates “sticky inflation”. It doesn’t just go away when the supply chain recovers or when oil prices retreat. As of April, wage growth has risen 6.4% over the past year, and the last time we saw wage growth over 6% was the 1970’s which not so coincidentally was a period of prolonged hyperinflation.
The only way I can foresee wage growth decreasing is a slow down in the economy which raises the risk of a recession. It’s simple supply and demand. If you have more jobs than people to fill them, companies will have to pay hire wages to attract and keep employees, the companies will most likely pass those higher costs onto the consumer in the form of higher prices, eventually the consumer can no longer afford those higher prices, the economy slows down, and then those excess jobs are eliminated. Not a fun storyline.
Subtle Warning Signs In Corporate Earnings
The tone from the Fed at the beginning of 2022 was that they will be raising rates to slow down inflation, but the economy is strong enough to withstand the rate hikes and we should be able to avoid a recession. The U.S. economy is driven primarily by consumer spending, and the consumer definitely showed up to spend in the first quarter of 2022. However, while many of the companies in the S&P 500 Index exceeded earning expectations, a number of them softened their outlook for the remainder of 2022 due to rising input costs and the impact of higher prices on consumer spending. Knowing that the stock market and bond market are forward looking animals, even though inflation has not taken a huge toll on corporate earnings yet, clouds are beginning to form which investors should pay close attention to.
Tech Stocks Getting Hit
As of May 9th, the S&P 500 Index is down 16% but the Nasdaq is down 26%. When inflation shows up, valuations begin to matter over a company’s growth story because cash becomes king. Here is how I explain it, if inflation is going up at 8% per year, if I ask you if you want me to give you $1 today or $1 a year from now, you would choose $1 today because a year from now, that dollar would have less purchasing power, because inflation is causing the price of everything to go up. It works the same way with stock prices.
The market uses P/E Ratios to determine how expensive stock is which is simply a company’s stock price divided by its earnings per share. If a company’s stock price is $100 and they are expected to earn $100 in profit for each share of stock, the P/E ratio would be 1. But it’s common for stocks to trade at 10, 15, or even 30 times one year of forward earnings. The higher the PE ratio, the more assumed future growth is built into the price of that stock. Some growth companies have very little in terms of net profit because they are spending a lot of money to make their big growth dreams come to life. These growth stocks can sometimes trade at a PE of 50, 100, or higher!!
When inflation hits and investors realize a dollar today is more valuable than a dollar tomorrow, they have to begin to discount those future returns that are built into stock prices. A stock that is trading at 50 times their one year earnings will typically have to drop in price a lot more than a stock that is only trading at 10 times it’s future one year earnings because you have to discount 50 years of earnings instead of 10.
Fed Policy
The last variable in the inflation equation is Fed policy. The Fed has a really tough job right now, reduce inflation without pushing the economy into a recession. When it was just supply chain issues, I think the market had it right by describing it as “the Fed is trying to engineer a soft landing”. With new inflationary forces now entering the equation, I would describe the Feds task as “threading a needle while the needle is moving”.
At the May meeting, the Fed announced, as expected, a 0.50% increase to the Fed funds rate, but during that meeting they also dismissed that a future 0.75% rate hike was on the table. The markets cheered and rose significantly that day hearing that a 0.75% hike was unlikely but then the next day the market lost all of those gains, and continues to add to the losses - worried that the Fed was not raising rates fast enough to keep higher inflation at bay.
It's All About Inflation
While a lot of attention is being given to the Fed and what the Fed might do next, the focus has to come back to not just stopping inflation from going higher but how do they get inflation to decrease fast enough before it derails the consumer. I highlight all of these inflation variables because you could get good news on supply chain improvements and corporate earnings but if oil remains above $100 per barrel and wage growth is still 6%+, it difficult to picture how the year over year change in the inflation rate gets below 4% or 5% before the end of the year.
The consumer is everything. If the consumer has higher wages and the cash reserves to withstand the higher prices while the Fed is working to bring inflation down, it is possible that we could see a rally in the second half of the year. But the long inflation persists, the less likely that relief rally scenario becomes.
This Time It’s Different
I urge all investors to be careful here. In the investment world you will sometimes hear the phase “this time it’s different” or “we have never been here before” which can add additional stress and anxiety to a market environment that is already scary. I urge caution here because in 2022 there has been a trend that is very different. In most market downturns, when stocks go down, bonds will typically be up, which is one of the benefits of a properly diversified portfolio. When you compare historical returns of the S&P 500 Index versus the Aggregate Bond Index, you will see this pattern:
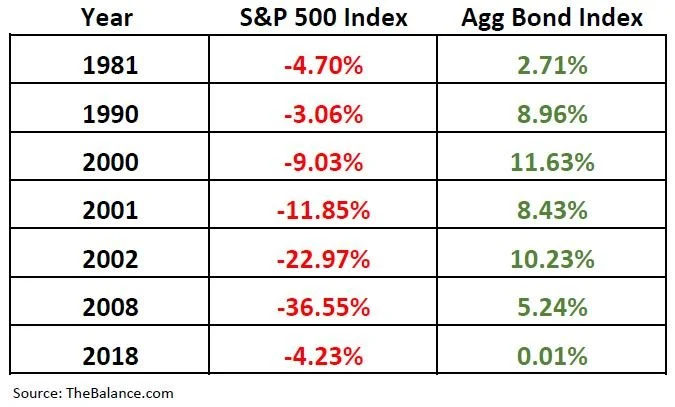
Unfortunately, as of May 9, 2022, stocks and bonds are both down a significant amount year-to -date:

It feels like we are getting close to a fork in the road. Either we will begin to see meaningful improvement in the inflation rate over the next few months setting both the stock and bond market on a path to recovery in the second half of 2022, or despite the Fed’s best efforts, regardless of whether or not we have seen a peak in inflation, if inflation does not come down a meaningful amount by the fall, the U.S. economy may slip into a mild recession in 2023. Until we know, investors will have to pay very close attention to these monthly indicators that are driving the inflation rate.
About Michael……...
Hi, I’m Michael Ruger. I’m the managing partner of Greenbush Financial Group and the creator of the nationally recognized Money Smart Board blog . I created the blog because there are a lot of events in life that require important financial decisions. The goal is to help our readers avoid big financial missteps, discover financial solutions that they were not aware of, and to optimize their financial future.

Russia & Ukraine: Where Does The Stock Market Go From Here?
Russia’s invasion of Ukraine continues to add uncertainty to global markets. It’s left investors asking the following questions:
Russia’s invasion of Ukraine continues to add uncertainty to global markets. It’s left investors asking the following questions:
What is the most likely outcome of the invasion?
How will this impact the U.S. stock market and global economy?
How high will oil prices go?
Should the U.S. be worried about a Russia cyberattack?
What is China’s role in this conflict?
Will the stock and bond market crash in Russia create a global liquidity event?
Does this change the Fed’s timeline for interest rate hikes?
Do we expect a relief rally or the market selloff to continue?
We will provide you with our answers to these questions in this market update.
About Michael……...
Hi, I’m Michael Ruger. I’m the managing partner of Greenbush Financial Group and the creator of the nationally recognized Money Smart Board blog . I created the blog because there are a lot of events in life that require important financial decisions. The goal is to help our readers avoid big financial missteps, discover financial solutions that they were not aware of, and to optimize their financial future.

Will The January Market Selloff Continue?
The markets have experienced an intense selloff in the first three weeks of 2022. As of January 21st, the S&P 500 Index is down over 7% for the month. There are only a few times in the past 10 years that the index has dropped by more the 5% in a single month. That begs the questions, “After those big monthly declines, historically, what happens next?”

The markets have experienced an intense selloff in the first three weeks of 2022. As of January 21st, the S&P 500 Index is down over 7% for the month. There are only a few times in the past 10 years that the index has dropped by more the 5% in a single month. That begs the questions, “After those big monthly declines, historically, what happens next?” Continued decline? Market recovery? We are going to answer that question in this article
The recent selloff has also been widespread. The selloff in January has negatively impacted stocks, bonds, crypto, while inflation continues to erode the value of cash. It has essentially created a nowhere to hide market environment. As of January 21, 2022, the YTD returns of the major indices are:
S&P 500 Index: -7.7%
Nasdaq: -12.0%
Small Cap 600: -8.5%
Agg (Bonds): -1.7%
Bitcoin: -24.1%
In this article I’m going to cover:
What has caused the selloff?
Do we expect the selloff to continue?
This Has Happened Before
How many times has the S&P 500 index dropped by more than 5% in a month over the past 10 years?
Answer: 4 times
February 2020: -18.92%
November 2018: -5.56%
December 2015: -6.42%
July 2011: -10.40%
Next question: How many times did the S&P 500 Index post a positive return 3 months following the month with the 5%+ loss?
Answer: ALL OF THEM
Mar 2020 – May 2020: 16.7%
Dec 2018 – Feb 2019: 9.5%
Jan 2016 – Mar 2016: 8.6%
Aug 2011 – Oct 2011: 4.0%
Don’t Make The Jump In / Jump Out Mistake
There is no doubt that the big, swift downturns in the markets bring fear, uncertainty, and stress for investors but all too often investors let their emotions get the better of them and the lose sight of the biggest economic trends that are at work. The most common phrase that I hear from investors during these steep declines is:
“Maybe we should just go to cash to stop the losses and then we can buy back into the stock market once the risks have passed.”
The issue becomes: when do you get back in? Following these big temporary sells offs in the market, it is common that the lion share of the gains happened before things feel good again. Investors get back in after the market has already rallied back, meaning they solidified their losses and they are now allocating money back into stocks when they have returned to higher levels.
We accurately forecasted higher levels of volatility in the market in 2022 when we release our 2022 Market Outlook video. It is also our expectation that with inflation rising and the Fed moving interest rates higher, the selloff that we have experienced in January, will not be the only steep selloff that we are faced with this year. Before we get into the longer- term picture, let’s first look at what prompted the January selloff in the markets.
What Caused The Market Selloff in January?
There are a number of factors that we believe has caused this severe selloff in January:
COVID Omicron cases have surged
The Fed’s more hawkish tone
Rising interest rates
Tech sector selloff
COVID investment plays unwinding
Loss of enhanced child tax credit monthly payments
While that looks like a long list, at the risking sounding like a broken record, if you go back to the Market Outlook video that we released in December, all of these were expected. It’s only when unexpected events occur that we then have to shift our strategy for the entire year. Let’s look at each of these items one by one:
COVID Cases Have Peaked
One thing that caught the market by surprise over the past few months is how contagious the Omicron variant was and how many cases there would be. This caused the recovery story to stall as safety measures were put back into place to control the spread of the most recent variant. The good news is it looks like the cases have peaked and are now on the decline. See the chart below:

It's a little tough to see in the chart but the blue line represents the number of confirmed COVID cases. If you look all the way on the righthand side, as of January 20th, they have dropped dramatically. The 7-day moving average has dropped by about 100,000 cases. This trend supports our forecast that the economy will begin opening up again starting in February. We expect the reopening trade story to be part of the market rally coming off of this tough January for the markets.
The Fed’s Hawkish Tone
It's the Fed’s job to keep inflation under control so the economy does not overheat. Inflation has been running at rate of over 6% for the past several months and going into 2022, the Fed telegraphed making 3 rate hikes in 2022. After the Fed’s January meeting, an even more hawkish tone was found in those meeting minutes, suggesting that more than 3 rate hikes could be on the table this year. This caused interest rates to rise rapidly which hurt both stocks and bonds in January.
But let’s take a look at history. The last time the Fed started raising rates was in 2016. Between 2016 and 2018, they hiked the Fed Funds Rate 8 times. During that two-year period, the S&P 500 was up 15.8%. The lesson here is just because the Fed is beginning to raise rates does not necessarily mark the end of the bull market rally.
Rising Interest Rates
Interest rates rose sharply in January which put downward pressure on both stocks and bonds. Investor often have bonds in their portfolio to offer protection when the there are selloffs in the stock market but when interest rates are moving high and the stock market is selling off at the same time, both stocks and bonds tend to move lower together. The yield on the 10 Year Treasury jumped from 1.51% on December 31, 2021 to 1.86% on January 18, 2022. That does not sound like a big increase but in terms of interest rates that is a huge move in 18 days. (In percentage terms, over 23%)
We do expect interest to continue to rise in 2022 but not at the concentrated monthly pace that we saw in January.
Tech Stock Drop
Tech stock took a big hit in January. The Nasdaq is down 12% in the first three weeks of 2022. In the 2022 Market Outlook we talked about tech stock coming under pressure this year in the face of rising interest rate and a lesson from the 1970’s about the “Nifty Fifty”. These tech stocks tend to trade at higher valuations. Interest rates and valuation levels tend to have an inverse relationship meaning if a stock is trading at a higher valuation level (P/E), they tend to be more adversely affected compared to the rest of the market when interest rates move higher.
COVID Investment Plays Unwind
In January, stocks that were considered “stay at home” COVID plays, like streaming, home exercise equipment, and electronic document providers experience large corrections. Here are some of the names that fall into that space and their performance YTD as of January 21, 2022:
Netlfix: -33%
Peloton: -23%
DocuSign: -23%
Now that the United States has reached a level of vaccinations and positive COVID cases that would suggest that we are at or close to herd immunity, there seems to be a higher likelihood that future COVID variants may not cause extreme economic shutdowns that supported the higher valuation level of these “stay at home” investment strategies.
Loss of Child Tax Credit Payments
Since the Build Back Better bill did not pass in December 2021, the $300+ per month that many parents were receiving for the Enhanced Child Tax Credits stopped in January. While those monthly payments to families were only meant to be temporary, it was highly anticipated that they were going to be extended into 2022 with the passing of the Build Back Better bill. Not having that extra money every month could slow down consumer spending in the first quarter of 2022.
Do We Expect The Selloff To Continue?
No one has a crystal ball but I would be very surprised if we do not see a recovery rally in the markets over the next few months. I think people underestimate the amount of money that has been injected into the U.S. economy over the past 18 months. If you total up all of the COVID stimulus packages over the past 18 months, they total $6.9 Trillion dollars. Compare that to the TARP Stimulus package that saved the banks and housing market in the 2008/2009 recession which only totaled $700 Billion. A lot of that stimulus money has yet to be spent due to supply change and labor constraints over the past year.
It's our expectations that the supply chain, which is already showing improvement, will continue to heal as we move further into 2022, which will give rise to higher levels of consumer spending and in turn, higher corporate earnings.
Inflation will be the greatest risk to the economy in 2022, but if the recovery of the supply chain causes prices to stabilize and consumers have the cash and wages to pay these temporarily higher prices, the bull rally could continue in 2022. But again, it will be choppy. The market could experience numerous corrections similar to what we are experiencing in January that investors may have to hold through, especially as the Fed begins to announce interest rate hikes later this year. We expect patience to be rewarded in 2022.

About Michael……...
Hi, I’m Michael Ruger. I’m the managing partner of Greenbush Financial Group and the creator of the nationally recognized Money Smart Board blog . I created the blog because there are a lot of events in life that require important financial decisions. The goal is to help our readers avoid big financial missteps, discover financial solutions that they were not aware of, and to optimize their financial future.
DISCLOSURE: This material is for informational purposes only. Neither American Portfolios nor its Representatives provide tax, legal or accounting advice. Please consult your own tax, legal or accounting professional before making any decisions. Any opinions expressed in this forum are not the opinion or view of American Portfolios Financial Services, Inc. and have not been reviewed by the firm for completeness or accuracy. These opinions are subject to change at any time without notice. Any comments or postings are provided for informational purposes only and do not constitute an offer or a recommendation to buy or sell securities or other financial instruments. Readers should conduct their own review and exercise judgment prior to investing. Investments are not guaranteed, involve risk and may result in a loss of principal. Past performance does not guarantee future results. Investments are not suitable for all types of investors. Investment advisory services offered through Greenbush Financial Group, LLC. Greenbush Financial Group, LLC is a Registered Investment Advisor. Securities offered through American Portfolio Financial Services, Inc (APFS). Member FINRA/SIPC. Greenbush Financial Group, LLC is not affiliated with APFS. APFS is not affiliated with any other named business entity. There is no guarantee that a diversified portfolio will enhance overall returns or outperform a non-diversified portfolio. Diversification does not ensure against market risk. The opinions voiced in this material are for general information only and are not intended to provide specific advice or recommendations for any individual. To determine which investments may be appropriate for you, consult your financial advisor prior to investing. All performance referenced is historical and is no guarantee of future results. All indices are unmanaged and cannot be invested into directly. Guarantees apply to certain insurance and annuity products (not securities, variable or investment advisory products) and are subject to product terms, exclusions and limitations and the insurer's claims-paying ability and financial strength. Before investing, consider the investment objectives, risks, charges, and expenses of the annuity and its investment options. Please submit using the same generated coversheet for this submission number. Potential investors of 529 plans may get more favorable tax benefits from 529 plans sponsored by their own state. Consult your tax professional for how 529 tax treatments and account fees would apply to your particular situation. To determine which college saving option is right for you, please consult your tax and accounting advisors. Neither APFS nor its affiliates or financial professionals provide tax, legal or accounting advice. Please carefully consider investment objectives, risks, charges, and expenses before investing. For this and other information about municipal fund securities, please obtain an offering statement and read it carefully before you invest. Investments in 529 college savings plans are neither FDIC insured nor guaranteed and may lose value.


What Caused The Market To Sell Off In September?

What Caused The Market To Sell Off In September?
The stock market experienced a fairly significant drop in the month of September. In September, the S&P 500 Index dropped 4.8% which represents the sharpest monthly decline since March 2020. I wanted to take some time today to evaluate:
· What caused the market drop?
· Do we think this sell off is going to continue?
· Have the recent market events caused us to change our investment strategy?
September Is Historically A Bad Month
Looking back at history, September is historically the worse performing month for the stock market. Since 1928, the S&P 500 Index has averaged a 1% loss in September (WTOP News). Most investors have probably forgotten that in September 2020, the market experienced a 10% correction, but rallied significantly in the 4th quarter.
The good news is the 4th quarter is historically the strongest quarter for the S&P 500. Since 1945, the stock market has averaged a 3.8% return in the final three months of the year (S&P Global).
The earned income penalty ONLY applies to taxpayers that turn on their Social Security prior to their normal retirement age. Once you have reached your normal retirement age, this penalty does not apply.
Delta Variant
The emergence of the Delta Variant slowed economic activity in September. People cancelled travel plans, some individuals avoided restaurants and public events, employees were out sick or quarantined, and it delayed some companies from returning 100% to an office setting. However, we view this as a temporary risk as vaccination rates continue to increase, booster shots are distributed, and the death rates associated with the virus continue to stay at well below 2020 levels.
China Real Estate Risk
Unexpected risks surfaced in the Chinese real estate market during September. China's second largest property developer Evergrande Group had accumulated $300 billion in debt and was beginning to miss payments on its outstanding bonds. This spread fears that a default could cause issues other places around the globe. Those risks subsided as the month progressed and the company began to liquidate assets to meet its debt payments.
Rising Inflation
In September we received the CPI index report for August that showed a 5.3% increase in year over year inflation which was consistent with the higher inflation trend that we had seen earlier in the year. In our opinion, inflation has persisted at these higher levels due to:
· Big increase in the money supply
· Shortage of supply of good and services
· Rising wages as companies try to bring employees back into the workforce
The risk here is if the rate of inflation continues to increase then the Fed may be forced to respond by raising interest rates which could slow down the economy. While we acknowledge this as a risk, the Fed does not seem to be in a hurry to raise rates and recently announced plans to pare back their bond purchases before they begin raising the Fed Funds Rate. Fed Chairman Powell has called the recent inflation trend “transitory” due to a bottleneck in the supply chain as company rush to produce more computer chips, construction materials, and fill labor shortages to meet consumer demand. Once people return to work and the supply chain gets back on line, the higher levels of inflation that we are seeing could subside.
Rising Rates Hit Tech Stocks
Interest rates rose throughout the month of September which caused mortgage rates to move higher, but more recently there has been an inverse relationship between interest rates and tech stocks. As interest rates rise, tech stocks tend to fall. We attribute this largely to the higher valuations that these tech stocks trade at. As interest rates rise, it becomes more difficult to justify the multiples that these tech stocks are trading at. It is also important to acknowledge that these tech companies have become so large that the tech sector now represents about 30% of the S&P 500 Index (JP Morgan Guide to the Markets).
Risk of a Government Shutdown
Toward the end of the month, the news headlines were filled with the risk of the government shutdown which has been a reoccurring issue for the U.S. government for the past 20 years. This was nothing new, but it just added more uncertainty to the pile of negative headlines that plagued the markets in September. It was announced on September 30th that Congress had approved a temporary funding bill to extend the deadline to December 3rd.
Expectation Going Forward
Even though the Stock Market faced a pile of bad news in September, our internal investment thesis at our firm has not changed. Our expectation is that:
· The economy will continue to gain strength in coming quarters
· There is a tremendous amount of liquidity still in the system from the stimulus packages that has yet to be spent
· People will begin to return to work to produce more goods and services
· Those additional goods and services will then ease the current supply chain bottleneck
· Interest rates will move higher but they still remain at historically low levels
· The risk of the delta variant will diminish increasing the demand for travel
We will continue to monitor the economy, financial markets, and will release more articles in the future as the economic conditions continue to evolve in the coming months.
About Michael……...
Hi, I’m Michael Ruger. I’m the managing partner of Greenbush Financial Group and the creator of the nationally recognized Money Smart Board blog . I created the blog because there are a lot of events in life that require important financial decisions. The goal is to help our readers avoid big financial missteps, discover financial solutions that they were not aware of, and to optimize their financial future.
DISCLOSURE: This material is for informational purposes only. Neither American Portfolios nor its Representatives provide tax, legal or accounting advice. Please consult your own tax, legal or accounting professional before making any decisions. Any opinions expressed in this forum are not the opinion or view of American Portfolios Financial Services, Inc. and have not been reviewed by the firm for completeness or accuracy. These opinions are subject to change at any time without notice. Any comments or postings are provided for informational purposes only and do not constitute an offer or a recommendation to buy or sell securities or other financial instruments. Readers should conduct their own review and exercise judgment prior to investing. Investments are not guaranteed, involve risk and may result in a loss of principal. Past performance does not guarantee future results. Investments are not suitable for all types of investors. Investment advisory services offered through Greenbush Financial Group, LLC. Greenbush Financial Group, LLC is a Registered Investment Advisor. Securities offered through American Portfolio Financial Services, Inc (APFS). Member FINRA/SIPC. Greenbush Financial Group, LLC is not affiliated with APFS. APFS is not affiliated with any other named business entity. There is no guarantee that a diversified portfolio will enhance overall returns or outperform a non-diversified portfolio. Diversification does not ensure against market risk. The opinions voiced in this material are for general information only and are not intended to provide specific advice or recommendations for any individual. To determine which investments may be appropriate for you, consult your financial advisor prior to investing. All performance referenced is historical and is no guarantee of future results. All indices are unmanaged and cannot be invested into directly. Guarantees apply to certain insurance and annuity products (not securities, variable or investment advisory products) and are subject to product terms, exclusions and limitations and the insurer's claims-paying ability and financial strength. Before investing, consider the investment objectives, risks, charges, and expenses of the annuity and its investment options. Please submit using the same generated coversheet for this submission number. Potential investors of 529 plans may get more favorable tax benefits from 529 plans sponsored by their own state. Consult your tax professional for how 529 tax treatments and account fees would apply to your particular situation. To determine which college saving option is right for you, please consult your tax and accounting advisors. Neither APFS nor its affiliates or financial professionals provide tax, legal or accounting advice. Please carefully consider investment objectives, risks, charges, and expenses before investing. For this and other information about municipal fund securities, please obtain an offering statement and read it carefully before you invest. Investments in 529 college savings plans are neither FDIC insured nor guaranteed and may lose value.