

So Where Is The Recession?
Toward the end of 2022 and for the first half of this year, many economics and market analysts were warning investors of a recession starting within the first 6 months of 2023. Despite those widespread warnings, the S&P 500 Index is up 16% YTD as of July 3, 2023, notching one of the strongest 6-month starts to a year in history. So why have so many people been wrong about their prediction and off by so much?
Toward the end of 2022 and for the first half of this year, many economists and market analysts were warning investors of a recession starting within the first 6 months of 2023. Despite those widespread warnings, the S&P 500 Index is up 16% YTD as of July 3, 2023, notching one of the strongest 6-month starts to a year in history. So why have so many people been wrong about their prediction and off by so much?
The primary reason is that the U.S. economy and the U.S. stock market are telling us two different stories. The U.S. stock market seems to be telling the story that the worst is behind us, inflation is coming down, and we are at the beginning of a renewed economic growth cycle fueled by the new A.I. technology. But the U.S. economy is telling a very different story. The economic data suggests that the economy is slowing down quickly, higher interest rates are taking their toll on bank lending, the consumer, commercial real estate, and many of the economic indicators that have successfully forecasted a recession in the past are not only flashing red but have become progressively more negative over the past 6 months despite the rally in the stock market.
So are the economists that predicted a recession this year wrong or just early? In this article, we will review both sides of the argument to determine where the stock market may be heading in the second half of 2023.
The Bull Case
Let’s start off by looking at the bull case making the argument that the worst is behind us and the stock market will continue to rally from here.
Strong Labor Markets
The bulls will point to the strength of the U.S. labor market. Due to the shortage of workers in the labor market, companies are still desperate to find employees to hire, and even companies that have experienced a slowdown within the last 6 months are reluctant to layoff employees for fear that they will not be able to hire them back if either a recession is avoided or if it’s just a mild recession.
I agree that the labor market environment is different than previous market cycles, as a business owner myself, I cannot remember the last time it was this difficult to find qualified employees to hire. From the research that we have completed, the main catalyst of this issue stems from a demographic issue within the U.S. labor force. It’s the simple fact that there are a lot more people in the U.S. ages 50 to 70 than there are people ages 20 – 40. You have people retiring in droves, dropping out of the workforce, and there are just not enough people to replace them.
The bulls are making the case that because of this labor shortage, the unemployment rate will remain low, the consumer will retain their spending power, and a recession will be avoided.
Inflation is Dropping Fast
The main risk to the economy over the past 18 months has been the rapid rise in inflation. The bulls will highlight that not only has the inflation dropped but it has dropped quickly. Inflation peaked in June 2022 at around 9% and as of May 2023, the inflation rate has dropped all of the way down to 4% with the Fed’s target at 2% - 3%. The inflation battle is close to being won. As a result of the rapid drop in inflation, the Fed made the decision to pause as opposed to raising the Fed Fund Rate at their last meeting, which is also welcomed news for bullish investors since avoiding additional interest rate hikes and shifting the discussion to Fed Fund rate cuts could eliminate some of the risks of a Fed-induced recession.
The Market Has Already Priced In The Recession
Some bulls will argue that the stock market has already priced in a mild recession which is the reason why the S&P 500 Index was down 19% in 2022, so even if we end up in a recession, the October 2022 market lows will not be retested. Also, since the market was down in 2022, historically it’s a rare occurrence that the market is down two years in a row.
The Bear Case
Now let’s shift gears over to the bear case that would argue that while a recession has not surfaced yet, there are numerous economic indicators that would suggest that there is a very high probability that the U.S. economy will enter a recession within the next 12 months. Full disclosure, we are in this camp and we have been in this camp since December 2021. Admittedly, I am surprised at the “magnitude” of the rally this year but not necessarily surprised at the rally itself.
Bear Market Rallies Are Common
Rarely does the stock market fire a warning shot and then proceed to enter a recession. Historically, it is more common that the stock market experiences what we call a “false rally”, right before the stock market wakes up to the fact that the economy is headed for a recession, followed by a steep selloff but there is always a bull market case that exists that investors want to believe.
The last real recession that we had was the 2008 housing crisis and while investors remember how painful that recession was for their investment accounts, they typically don’t remember what was happening prior to the recession beginning. Leading into the 2008/2009 recession, the S&P 500 Index had rallied 12%, the housing market issues were beginning to surface, but there was still a strong case for a soft landing as the Fed paused interest rate hikes, and began decreasing the Fed Funds Rate at the beginning of 2008, but as we know today the Great Recession occurred anyways.
The Fed Has Never Delivered A Soft Landing
While there is talk of a soft landing with no recession, if you look back in history, anytime the Fed has had to reduce the inflation rate by more than 2%, the Fed rate hike cycle has been followed by a recession every single time. As I mentioned above, the inflation rate peaked at 9% and their target is 2% - 3% so they have to bring down the inflation rate by much more than 2%. If they pull off a soft landing with no recession, it would be the first time that has ever happened.
The Market Bottom
For the bulls that argue that the market is expecting a mild recession and has already priced that in, that would also be the first time that has ever happened. If you look back at the past 9 recessions, how many times in the past 9 recessions did the market bottom PRIOR to the recession beginning? Answer: Zero. In each of the past 9 recessions, the market bottomed at some point during the recession but not before it.
Also, the historical P/E ratio of the S&P 500 Index is a 17. P/E ratios are a wildly used metric to determine whether an investment or index is undervalued, fairly valued, or overvalued. As I write this article on July 3, 2023, the forward P/E of the S&P 500 Index is 22 so the stock market is already arguably overvalued or as others might describe it as “priced to perfection”. So not only is the stock market priced for no recession, it’s priced for significant earnings growth from the companies that are represented within the S&P 500 Index.
A Rally Fueled by 6 Tech Companies
The S&P 500 Index, the stock market, is comprised of 500 of the largest publicly traded companies in the U.S. The S&P Index is a “cap-weighted index” which means the larger the company, the larger the impact on the direction of the index. Why does this matter? In 2023, many of the big tech companies in the U.S. have rallied substantially on the back of the artificial intelligence boom.
As of June 2, 2023, the S&P 500 Index was up 11.4% YTD, and at that time Nvidia one of the top ten largest companies in the S&P 500 was up 171%, Amazon up 49%, Google up 41%. If instead you ignored the size of the companies in the S&P 500 Index and gave equal weight to each of the 500 companies that make up the stock index, the S&P 500 Index would have only been up 1.2% YTD as of June 2, 2023. So this has not been what we consider a broad rally where most of the companies are moving higher. (Data Source for this section: Reuters)
Why is this important? In a truly sustainable growth environment, we tend to see a broad market rally where a large number of companies within the index see a meaningful amount of appreciation and just doesn’t seem to be the case with the stock market rally this year.
2 Predictors of Coming Recessions
There are two economic indicators that have historically been very good at predicting recessions; the yield curve and the Leading Economic Indicators Index. Both started the year flashing red warning signals and despite the stock market rally so far this year, both indicators have moved even more negative within the first 6 months of 2023.
Inverted Yield Curve
The yield curve right now is inverted which historically is a very accurate predictor of a coming recession. Below is a chart of the yield curve going back to 1977, anytime the grey line moved below the red line in the chart, the yield curve is inverted. As you can see, each time the yield curve inverts it’s followed by a recession which are the grey shaded areas within the graph. On the far right side of the chart is where we are now, heavily inverted. If we don’t get a recession within the next 12 months, it would be the first time ever that the yield curve was this inverted and a recession did not occur.
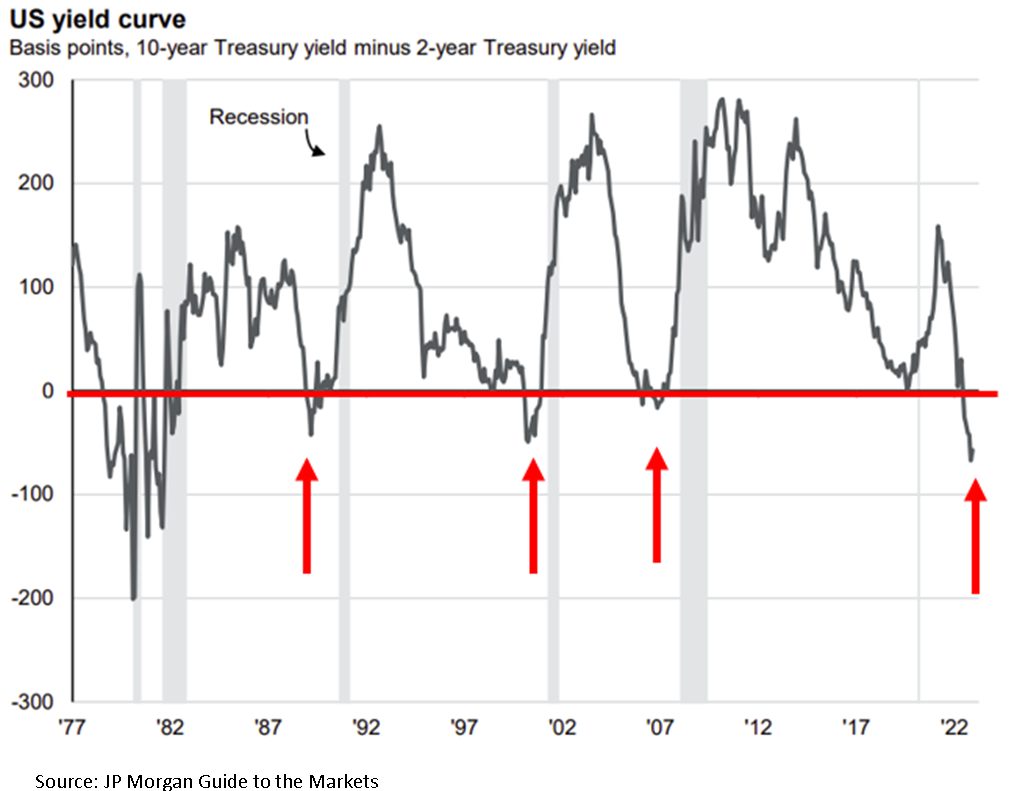
The duration of the inversion is also something to take note of. As of July 2, 2023 the yield curve has been inverted for 159 trading days, since 1962 the longest streak that the yield curve was inverted was 209 trading days ending May 2008 (the beginning of the Great Recession). If the current yield curve stays inverted until mid-September, which is likely, it will break that record.
Leading Economic Indicators Index (LEI Index)
The Leading Economic Indicators index is the second very accurate predictor of a coming recession because as the name suggests the index is comprised of forward-looking economic data including but not limited to manufacturing hours works, building permits, yield curve, consumer confidence, and weekly unemployment claims. The yield curve is a warning from the bond market and the LEI index is a warning from the U.S. economy.
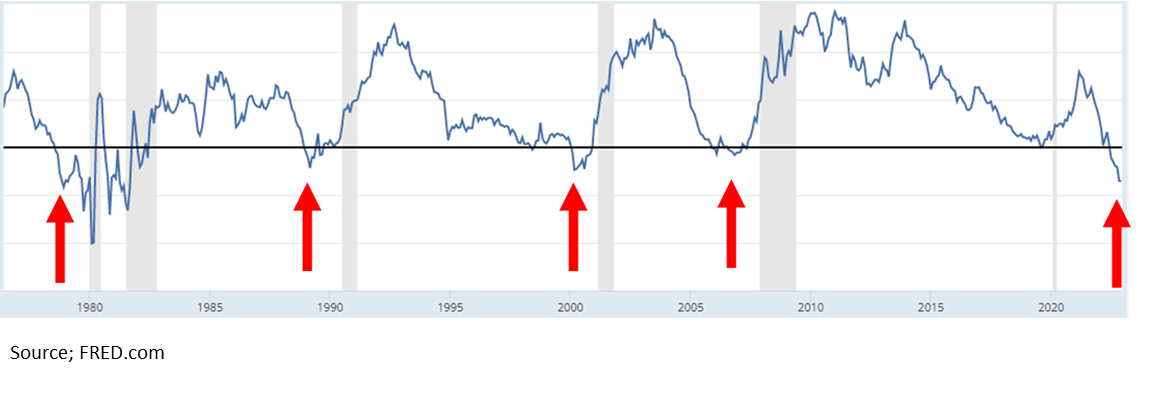
In the chart below, when the blue drops below the red line (where the red arrows are) the LEI index has turned negative, indicating that the forward-looking economic indicators in the U.S. economy are slowing down. The light grey areas are the recessions. As you can see in the chart, shortly after the LEI index goes negative, historically a recession appears shortly after. If you look at where are now on the righthand side of the chart, not only are we negative on the LEI, but we have never been this negative without already being in a recession. Again, if we don’t get a recession within the next 12 months, it would be the first time ever that this indicator did not accurately predict a recession at its current level.

“Well…..This Time It’s Different”
A common phrase that you will hear from the bulls right now is “well…..this time is different” followed by a list of all the reasons why the yield curve, LEI index, and other indicators that are flashing red are no longer a creditable predictor of a coming recession. After being in the investment industry for over 20 years and experiencing the tech bubble bust, housing crisis, Eurozone crisis, and Covid, from my experience, it’s rarely different which is why these predictors of recessions have been so accurate over time. Yes, the market environment is not exactly the same in each time period, sometimes there is a house crisis, other times an energy crisis, or maybe a pandemic, but the impact that monetary policy and fiscal policy have on the economy tend to remain constant over longer periods of time.
Market Timing
It’s very difficult to time the market. I would love to be able to know exactly when the market was peaking and bottoming in each market cycle but the stock market itself throws off so many false readings that become traps for investors. While we rely more heavily on the economic indicators because they have a better track record of predicting market outcomes over the long term, the timing is never spot on but what I have learned over time is that if you are able to sidestep the recessions, and avoid the big 25%+ downturns in an investment portfolio, it often leads to greater outperformance over the long term. Remember, mathematically, if your portfolio drops by 50%, you have to earn a 100% rate of return to get back to breakeven. But it takes discipline to watch these market rallies happen and not feel like you are missing out.
The Consumer’s Uphill Battle
Consumer spending is the number one driver of the U.S. economy and the consumer is going to face multiple headwinds in the second half of 2023. First, student loan payments are set to restart in October. Due to the Covid relief, many individuals with student loans have not been required to make a payment for the past three years and the $10,000 student loan debt cancellation that many people were banking on was recently struck down by the Supreme Court.
Second, while inflation has dropped, the interest rates on mortgages, car loans, and credit cards have not. The inflation rate dropped from 9% in June 2022 to 4% in May 2023 but the 30-year fixed mortgage rate peaked in November at around 7% and as of July 2023 still remains around 6.8%, virtually unchanged, so not a lot of relief for individuals that are trying to buy a house.
This is largely attributed to the third headwind for consumers which is that banks are tightening their lending practices. The banks see the same charts of the economy that we do and when the economy begins slowing down banks begin to tighten their lending standards making it more difficult for consumers and businesses to obtain loans. Even though the stock market has rallied in 2023, banks have continued to tighten their lending standards over the past 6 months and with more limited access to credit, that could put pressure on the economy in the second half of 2023.
Consumer spending has been stronger than expected in 2023 which has helped fuel the stock market rally this year but we can see in the data that a lot of this spending has been done using credit cards and default rates on credit cards and auto loans are rising quickly. So now many consumers have not only spent through their savings but by the end of the year they could have large credit card payments, car payments, higher mortgage/rent payments, and student loan payments.
Reasons for Recession Delay
With all of these clear headwinds for the market, why has the recession not begun yet as so many economists had forecasted at the beginning of 2023? In my opinion, the primary reason for the delay is that it typically takes 9 to 12 months for each Fed rate hike to impact the economy. When the Fed is raising rates, they are intentionally trying to slow down the economy to curb inflation. The Fed just paused for the first time in June 2023 but all of the rate hikes that were implemented in the first half of 2023 have yet to work their way into the economy. This is why you see yet another very consist historically pattern with the Fed Funds Rate. A pattern that I call the “Fed Table Top”. Here is a chart showing the last three Fed rate hike cycles going back to 2000:

You will see the same pattern over time, the Fed raises interest rates to fight inflation which are the moves higher in the chart, they pause at the top of their rate hike cycle which is the “Table Top”, and then a recession appears as a result of their tightening cycle, and they begin dropping interest rates. Once the Fed has reached its pause status or “table top”, some of those pauses last over a year, while other pauses only last a few months. The pause makes sense because again it takes time for all of those rate hikes to impact the economy so it’s never just a straight up and then a straight down in interest rates.
So then that raises the question, how long will this pause be? Honestly, I have no idea, and this is the tricky part again about timing but the pattern has repeated itself time and time again. However, as you can also see in the Fed chart above when you compare the current Fed rate hike cycle to those of the previous 3 cycles, the Fed just raised rates by more than the previous three cycles in a much shorter period of time, that would lead me to believe that this Fed Table Top could be shorter because the 9-month lag of the interest rate hikes on the economy will happen at a greater magnitude compared to the Fed rating rates at 0.25% - 0.50% per meeting as they did in the previous two Fed rate hike cycles.
Bulls or the Bears?
Only time will tell if the economic patterns of the past will remain true and a recession will emerge within the next 12 months or if this time it is truly different, and a recession will be avoided. For investors that have chosen the path of the bull, they will have to remain on their toes, because historically when the turn comes, it comes fast, and with very little warning.

About Michael……...
Hi, I’m Michael Ruger. I’m the managing partner of Greenbush Financial Group and the creator of the nationally recognized Money Smart Board blog . I created the blog because there are a lot of events in life that require important financial decisions. The goal is to help our readers avoid big financial missteps, discover financial solutions that they were not aware of, and to optimize their financial future.


2023 Market Outlook: A New Problem Emerges
While the markets are still very focused on the battle with inflation, a new problem is going to emerge in 2023 that is going to take it’s place. The markets have experienced a relief rally in November and December but we expect the rally to fade quickly going into 2023.
While the markets are still very focused on the battle with inflation, a new problem is going to emerge in 2023 that is going to take its place. The markets have experienced a relief rally in November and December, but we expect the rally to fade quickly going into 2023.
Inflation Trend and Fed Policy
I’m writing this article on December 15, 2022, and this week, we received the inflation reading for November and the Fed’s 0.50% interest rate hike. Headline CPI, the primary measure of inflation, dropped from 7.7% in October to 7.1% in November which is a meaningful decline, most likely signaling that peak inflation is behind us. So why such a grim outlook for 2023? One word……History. If you look at the historical trends of meaningful economic indicators and compare them to what the data is telling us now, the message to us is it will be nothing short of a Christmas miracle for the U.S. economy to avoid a recession in 2023.
The Inflation Battle Will Begin at 5%
While it's encouraging to see the inflation rate dropping, the true battle will begin once the year-over-year inflation rate measured by headline CPI reaches the 5% - 6% range. Inflation most likely peaked in June 2022 at 9% and dropped to 7.1% in November, but remember, the Fed’s target range for inflation is 2% - 3%, so we still have at least another 4% to go.
RECESSION RISK #1: If you look back through U.S. history, the Fed has never successfully reduced the inflation rate by more than 2% WITHOUT causing a recession. We have already dropped by 2%, and we still have another 4% to go.
I expect the next 3 months to show meaningful drops in the inflation rate and would not be surprised if we are in a 5% - 6% range by March or April, largely because supply chains have healed, the economy is slowing, the price of oil has come down substantially, and the job market is beginning to soften. But once we get down to the 5% - 6% range, we could see slow progress, which could end the party for investors that are stilling in the bull rally camp.
The Wage Growth Battle
We expect progress to be halted because of the shortage of supply of workers in the labor force, which will keep wages persistently higher, allowing the US consumer to keep paying higher prices for goods and services, which will leave us with higher interest rates for longer. Every time Powell has spoken over the past few months (the head of the Federal Reserve), he expresses his concerns that wages remain far too high. The solution is simple but ugly. The Fed needs to continue to apply pressure on the economy until the unemployment rate begins to rise which will bring wage growth level down to a level that will allow them to reach their 2% - 3% target inflation range.
Companies Are Reluctant To Let Go of Employees
Since one of the major issues plaguing US businesses is trying to find employees, companies will be more reluctant to let go of employee with the fear that they will need them once the economy begins to recover. This situation could create an abrupt spike and the unemployment rate when companies are finally forced to give in all at once to the reality that they will need to shed employees due to the slowing economy.
Rising Unemployment
Another lesson from history, if you look back at the past 9 recessions, how many times did the stock market bottom BEFORE the recession began? Answer: ZERO. So, if you think the bottom is already in the stock market but you also believe that there is a high probability that the U.S. economy will enter a recession in 2023, you are on the wrong side of history.
When we look back at the past 9 recessions, there is a common trend. As you would expect, when the economy begins to contract, people lose their jobs, which causes the unemployment rate to rise. In all of the past 9 recessions, the stock market did not bottom until AFTER the unemployment rate began to rise. If you think there is a high probability that the unemployment rate will rise in 2023, which is what the Fed is targeting to bring down wage growth, then we most likely have not seen the market bottom in this bear market cycle.
JP Morgan has a great chart summarizing this point across the past 9 recessions. While it looks like a lot is going on in this illustration, each chart shows one of the past 9 recessions.
The Purple Line = Unemployment Rate
The Black Straight Line = Where the stock market bottomed
The Gray Area = The recession
In each of the charts below, observe how the purple line begin to rise and then the solid black line follows in each chart. That would support the trend that the bottom in the stock market historically happens after the unemployment rate begin it’s climb which has not happened yet.

A New Problem Will Emerge
While the markets have been super focused on inflation in 2022, a new problem is going to surface in 2023. The economy is going to trade its inflation problem for the reality of a weakening U.S. consumer.
The Fed will be successful at slowing down the economy via their rate hikes, which will eventually lead to job losses, weakness in the housing market, a slowdown in consumer spending on goods and travel, and less capital spending. Those forces should be enough to deliver the two quarters of negative GDP growth in 2023, which would coincide with a recession.
The Fed Will Have Its Hands Tied
Normally, when the economy begins to contract, the Fed will step in and begin lowering interest rates to restart economic growth. However, if the inflation rate, while moving lower, is still between 4% and 5% when the economic slowdown hits, the Fed will not be able to come to the economy’s aid with fear that premature reductions in the fed funds rate could reignite inflation which is exactly what happened in the 1970s.
The recession itself will eventually bring inflation down to the Feds 2% inflation target, but while it’s happening, it’s going to feel like you are watching a train wreck in slow motion, but you can’t do anything about it. Not a great environment for the stock market.
Length of the recession
The next question I receive is, do we expect a mild recession or severe recession? I’ll be completely honest, it’s impossible to know. A lot will depend on the timing of when the economy begins to contract and where the rate of inflation is. The longer it takes inflation to get down to the 2% range while the economy contracts, the longer and more severe the recession will be. This absolutely could end up being a mild recession but there’s no way to know that sitting here in December 2022, looking at all of the challenges that lie ahead for the markets in 2023.
An Opportunity For Bonds
Due to the rising interest rates in 2022, the bond market has had one of the worst years in history. Below is a chart showing the annual returns of the aggregate bond index going back to 1970.

We have never seen a year where bonds are down 11% in a single year. It’s our expectation that this trend will reverse course in 2023. When interest rates stop rising, the Fed pauses and eventually begins lowering rates, that should be a positive environment for fixed-income returns. Where bonds failed to give investors any type of safety net in 2022, I think that safety net will return in 2023. We are already beginning to see evidence of interest rates moving lower, with the 10-year US Treasury yields moving from 4.2% down to the current rate of 3.5% over the past 45 days.
Warnings From The Inverted Yield Curve
While a number of the economic indicators that we watching are flashing red going into 2023, there are very few that tell the story better than the inverted yield curve. Without getting into all the technical details about what an inverted yield curve is, the simple version of this explanation is, it's basically the bond market telling the stock market that trouble is on the horizon. Historically, when the yield curve inverts, The US economy enters a recession within the next 6 to 18 months. See below, a chart of the yield curve going back to 1970.
Each of the red arrows is where the yield curve inverts. The gray areas on the chart are the recessions. You can see very quickly how consistent the yield curve inversion has been at predicting recessions over time. If you look on the far right-hand side of the chart, that red arrow is where we are now, heavily inverted. So if you believe that we are not going to get a recession within the next 6 to 18 months, you are sitting heavily on the wrong side of history and have adopted a “this time it's different” mentality which can be dangerous. History tends to repeat itself more times than people like to admit.
Proactive investment decisions
Going into 2023, I think it's very important to be realistic about your expectations for the equity markets, given the headwinds that we face. This market environment is going to require very proactive investment decisions and constant monitoring of the economic data as we receive it throughout the year. A mild recession is entirely possible. If we end up in a mild recession, inflation drops down into the Feds comfort range due to the contracting economy, and the Fed can begin lowering rates before the end of 2023, that could put a bottom in the stock market, and the next bull market rally could emerge. But it's just too early to know that sitting here in December 2022 with a lot of headwinds facing the market.
About Michael……...
Hi, I’m Michael Ruger. I’m the managing partner of Greenbush Financial Group and the creator of the nationally recognized Money Smart Board blog . I created the blog because there are a lot of events in life that require important financial decisions. The goal is to help our readers avoid big financial missteps, discover financial solutions that they were not aware of, and to optimize their financial future.

This Market Rally Could Be A Bear Trap!! Here’s why……
The recent stock market rally could end up being a bear market trap for investors. If it is, this would be the 4th bear market trap of 2022.

After a really tough first 6 months of the year, the stock market has been in rally mode, rising over 9% within the last 30 days. It’s left investors anxious to participate in the rally to recapture the losses that were incurred in the first half of the year. Our guidance to clients, while there are plenty of bobbing heads on TV talking about “buying the dip” and trying to call the “bottom” in the market, this could very well be what we call a “bear trap”. A bear trap is a short-term rally that baits investors into thinking the market has bottomed only to find out that they fell for the trap, and experience big losses when the market retreats to new lows.
The 4th Bear Trap In 2022
If the current rally ends up being a bear trap, it would actually be the 4th bear trap so far in 2022.

The green boxes in the chart show when the rallies occurred and the magnitude. Notice how the market moved to a new lower level after each rally, this is a common pattern when you are in a prolonged bear market environment.
So how do you know when the bear market is over and the new sustainable bull market rally has begun? It’s actually pretty simple. Ask yourself, what were the issues that drove the market lower in the first place? Next question, “Is the economy making MEANINGFUL progress to resolve those issues?” If the answer is yes, you may in fact be at the beginning of the rally off of the bottom; if the answer is no, you should resist the temptation to begin loading up on risk assets.
It's Not A Secret
It’s not a secret to anyone that inflation is the main issue plaguing not just the U.S. economy but economies around the world. Everyone is trying to call the “peak” but we did a whole video on why the peak doesn’t matter.
The market cheered the July inflation report showing that headline year over year inflation dropped from 9.1% in June to 8.5% in July. While progress is always a good thing, if the inflation rate keeps dropping by only 0.60% per month, we are going to be in a lot of trouble heading into 2023. Why? As long as the inflation rate (the amount prices are going up) is higher than the wage growth rate (how much more people are making), it will continue to eat away at consumer spending which is the bedrock of the U.S. economy. As of July, wages are growing at only 6.2% year over year. That’s still a big gap until we get to that safety zone.
Understand The Math Behind The CPI Data
While it’s great that the CPI (Consumer Price Index) is dropping, the main CPI number that hits the headlines is the year-over-year change, comparing where prices were 12 months ago to the prices on those same goods today. Let me explain why that is an issue as we look at the CPI data going forward. If I told you I will sell you my coffee mug today for $100, you would say “No way, that’s too expensive.” But a year from now I try and sell you that same coffee mug for $102 and I tell you that the cost of this mug has only risen by 2% over the past year, does that make you more likely to buy it? No, it doesn’t because the price was already too high to begin with.
In August 2021, inflation was already heating up. The CPI headline number for August 2021 was 5.4%, already running above the Fed’s comfort level of 3%. Similar to the example I just gave you above with the coffee mug, if the price of everything was ALREADY at elevated levels a year ago, and it went up another 8.5% on top of that elevated level, why is the market celebrating?
Probability of A 2023 Recession
Even though no single source of data is an accurate predicator as to whether or not we will end up in a recession in 2023, the chart that I am about to show you is being weighted heavily in the investment decisions that we are making for our clients.
Historically an “inverted” yield curve has been a fairly accurate predicator of a coming recession. Without going into all of the details of what causes a yield curve inversion, in its simplest form, it’s the bond market basically telling the stock market that a recession could be on the horizon. The chart below shows all of the yield curve inversions going back to 1970. The red arrows are where the inversion happened and the gray shaded areas are where recession occurred.

Look at where we are right now on the far right-hand side of the chart. There is no question that the yield curve is currently inverted and not just by a little bit. There are two main takeaways from this chart, first, there has been a yield curve inversion prior to every recession going back to 1970, an accurate data point. Second, there is typically a 6 – 18 month delay between the time the yield curve inverts and when the recession actually begins.
Playing The Gap
I want to build off of that last point about the yield curve. Investors will sometimes ask, “if there is historically a 6 – 18 month delay between the inversion and the recession, why would you not take advantage of the market rally and then go to cash before the recession hits?” My answer, if someone could accurately do that on a consistent basis, I would be out of a job, because they would manage all of the money in the world.
Recession Lessons
I have been in the investment industry since 2002. I experienced the end of the tech bubble bust, the Great Recession of 2008/2009, Eurozone Crisis, and 2020 COVID recession. I have learned a number of valuable lessons with regard to managing money prior to and during those recessions that I’m going to share with you now:
It’s very very difficult to time the market. By the time most investors realize we are on the verge of a recession, the market losses have already piled up.
Something typically breaks during the recession that no one expects. For example, in the 2008 Housing Crisis, on the surface it was just an issue with inflated housing prices, but it manifested into a leverage issue that almost took down our entire financial system. The questions becomes if we end up in a recession in 2023, will something break that is not on the surface?
Do not underestimate the power of monetary and fiscal policy.
The Power of Monetary & Fiscal Policy
I want to spend some time elaborating on that third lesson. The Fed is in control of monetary policy which allows them to use interest rates and bond activity to either speed up or slow down the growth rate of the economy. The Fed’s primary tool is the Fed Funds Rate, when they want to stimulate the economy, they lower rates, and when they want to slow the economy down (like they are now), they raise rates.
Fiscal policy uses tax policy to either stimulate or slow down the economy. Similar to what happened during COVID, the government authorized stimulus payments, enhanced tax credits, and created new programs like the PPP to help the economy begin growing again.
Many investors severely underestimate the power of monetary and fiscal stimulus. COVID was a perfect example. The whole world economy came to a standstill for the first time in history, but the Fed stepped in, lowered rates to zero, injected liquidity into the system via bond purchases, and Congress injected close to $7 Trillion dollars in the U.S. economy via all of the stimulus policies. Even though the stock market dropped by 34% within two months at the onset of the COVID crisis in 2020, the S&P 500 ended up posting a return of 16% in 2020.
Now those same powerful forces that allowed the market to rally against unsurmountable odds are now working against the economy. The Fed is raising rates and decreasing liquidity assistance. Since the Fed has control over short term interest rates but not long-term rates, that is what causes the yield curve inversion. Every time the Fed hikes interest rates, it takes time for the impact of those rate hikes to make their way through the economy. Some economists estimate that the delay between the rate hike and the full impact on the economy is 6 – 12 months.
The Fed Is Raising More Aggressively
The Fed right now is not just raising interest rates but raising them at a pace and magnitude that is greater than anything we have seen since the 1970’s. A chart below shows historical data of the Fed Fund Rate going back to 2000.

Look at 2004 and 2016, it looks like a staircase. Historically the Fed has raised rates in small steps of 0.25% - 0.50%. This gives the economy the time that it needs to digest the rate hikes. If you look at where we are now in 2022, the line shoots up like a rocket because they have been raising rates in 0.75% increments and another hike of 0.50% - 0.75% is expected at the next Fed meeting in September. When the Fed hikes rates bigger and faster than it ever has in recent history, it increases the chances that something could “break” unexpectedly 6 to 12 months from now.
Don’t Fight The Fed
You will frequently hear the phrase “Don’t Fight The Fed”. When you look back at history, when the Fed is lowering interest rates in an effort to jump start the economy, it usually works. Conversely, when the Fed is raising rates to slow down the economy to fight inflation, it usually works but it’s a double edged sword. While they may successfully slow down inflation, to do so, they have to slow down the economy, which is traditionally not great news for the stock market.
I have to credit Rob Mangold in our office with this next data point that was eye opening to me, when you look back in history, the Fed has NEVER been able to reduce the inflation rate by more than 2% without causing a recession. Reminder, the inflation rate is at 8.5% right now and they are trying to get the year over year inflation rate back down to the 2% - 3% range. That’s a reduction of a lot more than 2%.
Stimulus Packages Don’t Work
In the 1970’s, when we had hyperinflation, the government made the error of issuing stimulus payments and subsidies to taxpayers to help them pay the higher prices. They discovered very quickly that it was a grave mistake. If there is inflation and the people have more money to spend, it allows them to keep paying those higher prices which creates MORE inflation. That is why in the late 70’s and early 80’s, interest rates rose well above 10%, and it was a horrible decade for the stock market.
In the U.S. we have become accustomed to recessions that are painful but short. The COVID Recession and 2008/2009 Housing Crisis were both painful but short because the government stepped in, lowered interest rates, printed a bunch of money, and got the economy growing again. However, when inflation is the root cause of our pain, unless the government repeats their mistakes from the 1970’s, there is very little the government can do to help until the economy has contracted by enough to curb inflation.
Is This The Anomaly?
Investors have to be very careful over the next 12 months. If by some chance, the economy is able to escape a recession in 2023, based on the historical data, that would be an “anomaly” as opposed to the rule. Over my 20 year career in the industry, I have heard the phrase “well this time it’s different because of X, Y, and Z” but I have found that it rarely is. Invest wisely.
About Michael……...
Hi, I’m Michael Ruger. I’m the managing partner of Greenbush Financial Group and the creator of the nationally recognized Money Smart Board blog . I created the blog because there are a lot of events in life that require important financial decisions. The goal is to help our readers avoid big financial missteps, discover financial solutions that they were not aware of, and to optimize their financial future.

What Is An Inverted Yield Curve?
Today, August 14, 2019, the main part of the yield curveinverted. This is an important event because an inverted yield curve hashistorically been a very good predictor of a coming recession. In this articlewe will review

Today, August 14, 2019, the main part of the yield curveinverted. This is an important event because an inverted yield curve hashistorically been a very good predictor of a coming recession. In this articlewe will review
What the yield curve is
What it means when the yield curve inverts
Historical data showing why it’s been a goodpredictor of recessions
What it means for investors today
Understanding the Yield Curve
The yield curve is an economic indicator that originates from the bond market. It’s basically a chart that shows the yield of government bonds at different durations. For example, the yield on a two-year treasury note versus a 10 year government bond. In a healthy economic environment, the curve is positively sloped as is illustrated by the chart below.

In a positively sloped yield curve, longer-term bonds have higher yields. Here’s a hypothetical example using CDs. Let’s say you go into that bank and you are trying to decide between buying a 1 year CD or a 5 year CD. In most cases you would naturally expect the 5 year CD to give you a higher level of interest because the bank is locking up your money for 5 years instead of 1 year. If a 1 year CD gives you 1% interest, you might expect a five-year CD to give you 3% interest in a bond market that has a positively sloped yield curve, because the further you go out in duration, the higher the current yield.
However, sticking to our hypothetical example using CD's, there are periods of time when you go into the bank and the 1 year CD has a higher interest rate than a 5 year CD. That would make you ask the obvious question, “Why would anyone to buy a 5 year CD at a lower interest-rate than a 1 year CD? You get a higher investment return on your money for the next year and you get your money back faster?”.
The answer is as such, in the bond market, investors willsometimes buy bonds for a longer duration at a lower current yield because theyexpect a recession to come. When arecession hits, typically the Federal Reserve will start lowering interestrates to help stimulate the economy. When that happens, interest ratestypically drop. Anticipating this drop in interest rates, bond investors are willingto buy bonds today that lock up their money for a longer period of time with alower yield because they expect interest rates to drop in the near future.
So, let’s use the hypothetical CD example again. You go into the bank and the 1 year CD rate is 3% and the 5 year CD rate is 2.5%. In an inverted yield curve situation, investors are buying those 5 year CD’s even though they have a lower interest-rate, because when the recession hits and the Fed starts lowering interest rates when that 1 year CD matures a year from now, the new rate on CD’s may be a 1 year CD at 1% and 1.5% on a 5 year CD. So from an investment standpoint today, it’s a better move to lock in your 2.5% interest rate for 5 years even though the yield is lower than the 1 year CD today. You can see in this example why an inverted yield curve is such a bearish signal for the markets.
Below is an illustration of an inverted yield curve:

It’s a Very Good Predicator of Recessions
When you look at the historical data, it shows how frequently an inverted yield curve has preceded a coming recession. Below is a chart that shows the spread between a 2 year government bond and a 10 year government bond. The yield curve is positively sloped when the blue line is above the dark black line. When the blue line falls below the dark black line, that means that the yield curve is inverted. The grey areas in the chart indicate recessions.

Today, the main part of the yield curve which means the 2year vs the 10 year bonds inverted. However, it’s important to point out that earlier in 2019, the yield onthe 10 year treasury bond dropped below the yield on the 3 month treasury note,so technically this is the second time the yield curve is inverted in 2019.
What Does That Mean for Investors?
If we use history as our guide, the inverted yield curve is a caution light for investors. Historically, the main question people ask next is, “How long after the yield curve inverts does the recession usually begin?”. Here is the chart:

As you can see, the problem with using this data to build an estimates timeline until the next recession is the variance in the data. Even though, in the past 5 recessions, the “average” period of time between the inversion of the yield curve and the subsequent recession was about 12 months, in 2 out of the 5 recessions, the inversion happened within 2 months of the beginning of the next recession. Timing the markets is very difficult and as we get into the later innings of this long economic expansion, the risks begin to mount. For this reason, it very important for investors to revisit their exposure to risk asset to make sure they are properly diversified.
About Michael……...
Hi, I’m Michael Ruger. I’m the managing partner of Greenbush Financial Group and the creator of the nationally recognized Money Smart Board blog . I created the blog because there are a lot of events in life that require important financial decisions. The goal is to help our readers avoid big financial missteps, discover financial solutions that they were not aware of, and to optimize their financial future.


Will There Be A Santa Claus Rally This Year?
Going back 120 years, December has traditionally been a very good month for the stock market. Within the last 120 years the S&P 500 has been positive in December 73% of the time. The Russell 2000, which is the index for small cap stocks, has been up 87% of the time in December. This boost in the final month of the year is known to traders as the

Going back 120 years, December has traditionally been a very good month for the stock market. Within the last 120 years the S&P 500 has been positive in December 73% of the time. The Russell 2000, which is the index for small cap stocks, has been up 87% of the time in December. This boost in the final month of the year is known to traders as the “Santa Claus Rally”. Should investors expect a Santa Claus rally in 2018 given the recent sell off in the markets? The answer may hinge on the results of the Federal Reserve Meeting on December 19th.
The Fed Decision
The fate of the Santa Claus rally may very well be in the hands of the Federal Reserve Committee this year. The Committee’s decision regarding the Fed Fund Rate could either cause the market to rally if the Fed decides to keep rates unchanged or it could push the markets lower if they decide to move forward with the anticipated quarter point rate hike. The Fed has a really tough decision to make this year. The goal of the Fed is to keep interest rates at a level that promotes full employment and a target inflation rate of 2%. In periods of economic expansion, it’s the Fed’s job to make sure the economy does not overheat which in turn could lead to prices of goods and services in the U.S. spiraling out of control.
Over the past few years, the U.S. economy has continued to expand and the Fed has been raising rates in quarter point increments. A very slow pace by historic standards. The Fed has already raised the Fed Funds Rate three times in 2018. What are the chances that the Fed raises rates again in December?
Solid Employment & Inflation In Check
The good news is there is not a lot of pressure for the Fed to raise rates in December. As of October, the unemployment rate sits at 3.7% and the employment data that we have seen throughout November has been strong. Historically, a strong job market usually results in higher wages for employees which is the main driver of inflation. So in the current economic environment, the Fed’s main focus is keeping inflation within its 2% target range. The Fed’s measuring stick for the rate of inflation is the Personal Consumption Expenditures Index. Otherwise known as the “PCE”.
There is a “Headline PCE” and a “Core PCE”. The Core PCE excludes prices for food and energy which is the Fed’s main barometer. Why does the Fed use Core PCE? Food and Energy prices can fluctuate significantly over short periods of time which can distort the results of the PCE index.
Below is a chart of both the Headline PCE and the Core PCE:
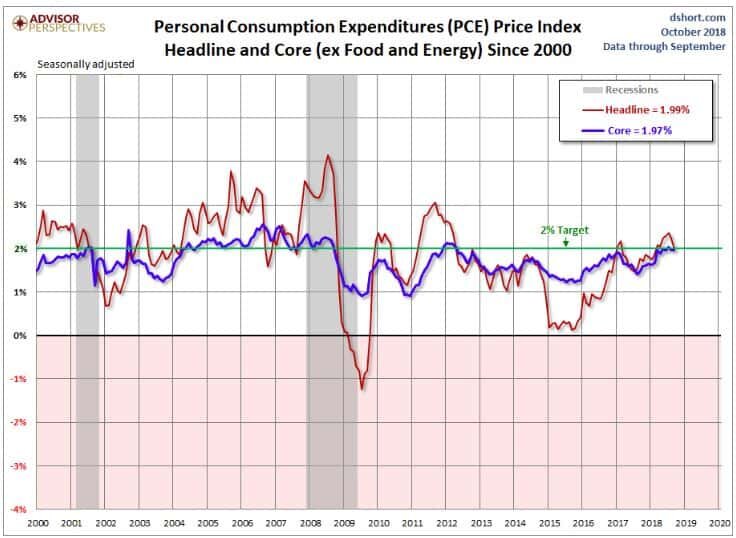
As you can see in the chart, the blue line that represents the Core PCE is right below the Fed’s 2% target. The PCE index is reported monthly and in October the PCE came in at a year-over-year change of 1.97%. Also you will see in the chart, due to the drop in the price of oil over the past two months, the Headline PCE is also dropping. While Headline PCE is not the Fed’s main measuring stick, there does seem to be a correlation between Headline PCE and Core PCE. It makes sense because regardless of the price of the product that you are taking a sample of, that product needs to be transported from the producer to the end user, and that transportation cost, which is largely influenced by the price of oil, will have an impact on the price of product within the Core PCE index.
This is good news for the stock market going into the December Fed meeting. With the Core PCE running just below the Fed’s target 2% rate and the Headline PCE declining, there is not a big push for the Fed to raise the Fed Funds Rate in December. I would even make the argument that raising the Fed Funds Rate in December would be a mistake.
The Fed & The Stock Market
The Fed is not a slave to the stock market. It’s not the Fed’s job to make sure the stock market continues to go up. Just because the stock market has experienced a large sell off over the past two months does not mean that the Fed will come to the market’s rescue and not raise rates. But remember, the Fed’s job is to keep the U.S. economy at full employment and keep inflation in check. Since inflation remains in check, it would seem that the prudent decision would be for the Fed to pause in December. If the Fed decides to raise rates in December, I have a difficult time understanding the catalyst for that decision.
Drivers Of The Recent Sell Off
It’s been a frustrating year for investors. Over the past 7 weeks, the U.S. large cap index, mid cap index, and small cap index have forfeited all of their gains for the year. International equity markets have been crushed this year. In a year like this, normally investors could turn to the bond portion of their portfolio for some support but that has not been the case this year either. The Barclays US Aggregate Bond index is down 2.38% year-to-date in 2018. It’s been a return drought this year with a double dose of volatility.
While the rapid rise in interest rates at the beginning of October may have triggered the market sell off, the downturn has been sustained by revisions to the forward guidance offered by corporations within their third quarter earnings report. While it has been another solid quarter of earnings for U.S. corporations, many of the companies that have been leading the bull market rally revised their forward earnings guidance down for the next few quarters. U.S. corporations seem to be embracing the uncertainty created by the trade wars and the tight labor market going into 2019.
It’s important to understand that as of today corporate earnings have not fallen short of expectations. As of November 14, 2018, 456 of the 500 companies in the S&P 500 had reported 3rd quarter earnings. 77.6% of those companies reported earnings above analyst expectations. This is above the long-term average of 64% and in line with the prior four quarter averaging of 77% exceeding expectations.
What really changed was the gross revenue numbers. Of those 456 companies that reported, 60.4% of those companies reported Q3 revenue above analyst expectations. That puts it in-line with the long-term average of 60% but below the average of the prior four quarters at 73%. While the U.S. economy continues to show strength, U.S. corporations have largely built an “earnings buffer” into their forecasts.
Economic Expansions Do Not Die Of Old Age
Everyone is on the lookout for the next recession. Each market sell off that we experience in this prolonged bull market rally makes investors question if they should run for hills. As one would expect, as you enter the later innings of an economic expansion the markets will begin to become more volatile. It’s easy for investors to hold their positions when the markets are going straight up with no volatility like 2017. It’s much more difficult to hold positions when it feels like you’re on a boat, in a storm, in the middle of an ocean. The temptation to try and jump in and out of the market in these volatile market conditions becomes much greater.
It’s very difficult to predict the future direction of the stock market using the recent fluctuations in the stock market as your barometer for future performance. If we look at many of the economic expansions in the past, we historically do not enter recession because the market calls it a day and just decides to go into a downward death spiral. In the past, there was typically a single event or a series of events that caused the economy to go from a period of expansion to a period of contraction. It’s for this reason that during these periods of heightened volatility that we rely heavily on the economic indicators that we track to determine how worried we should really be.
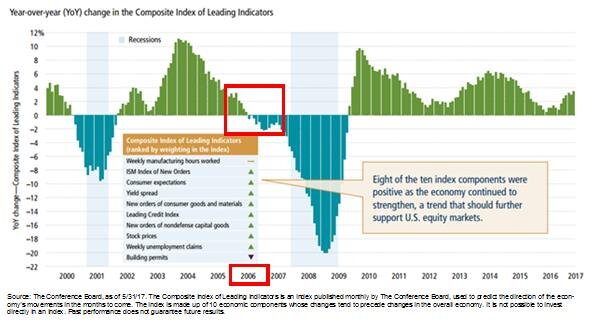
One of the main indicators that we track that I have shown you in previous updates is the Composite of Leading Indicators. It aggregates a number of forward looking economic and market indicators in an effort to provide a measurement of the health of the U.S. economy. See the chart below.
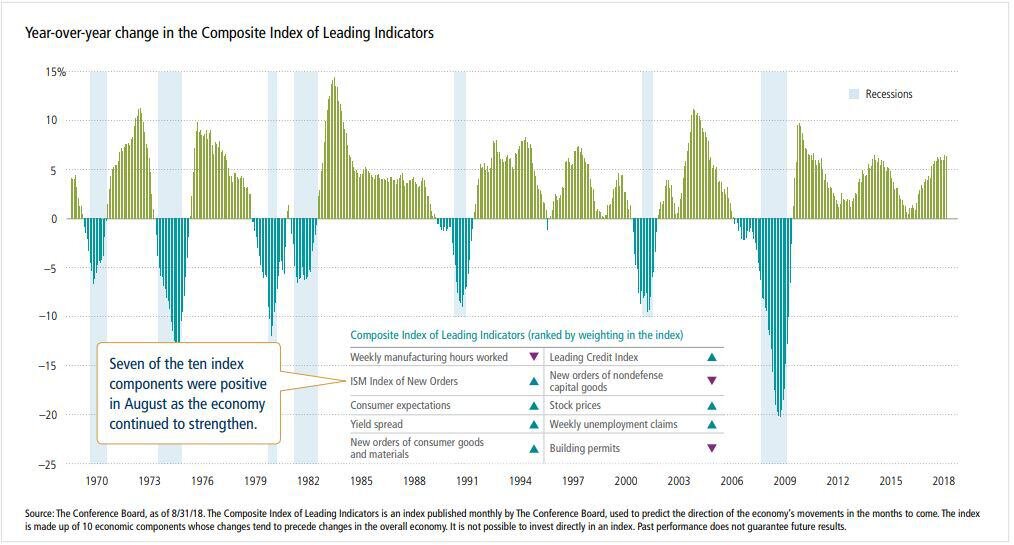
Each of the light blue areas shows when a recession took place going back to 1970. As you will see, in most cases this indicator turned negative before the economy entered a recession. If you look at what this indicator is telling us now, not only is the U.S. economy healthy, but over the past year it has strengthened. If you look at where we are now, there has never been a time since 1970 that this economic indicator has been at its current level, and a recession just shows up out of nowhere 12 months later.
Conclusion
We have no way of knowing what action the Fed will take on December 19th. However, given the tame level of inflation and the 3.7% unemployment rate, we would not be surprised if the Fed pauses at the December meeting which could lead to a health rally for the markets in December. Even if the Fed throws the market a curve ball and moves forward with the quarter point rate hike, while this move may seal the markets hopes of posting a positive return for the 2018 calendar year, the economy is still healthy, the probability of a recession within the next 12 months is still very low, and interest rates, although rising, are still at historically low levels. This economic environment may reward investors that have the discipline to make sound investment decision during these periods of heightened market volatility. The “easy years” are clearly behind us but that does not mean that the economic expansion is over. Have a safe and happy Thanksgiving everyone!!
About Michael……...
Hi, I’m Michael Ruger. I’m the managing partner of Greenbush Financial Group and the creator of the nationally recognized Money Smart Board blog . I created the blog because there are a lot of events in life that require important financial decisions. The goal is to help our readers avoid big financial missteps, discover financial solutions that they were not aware of, and to optimize their financial future.
Watch These Two Market Indicators
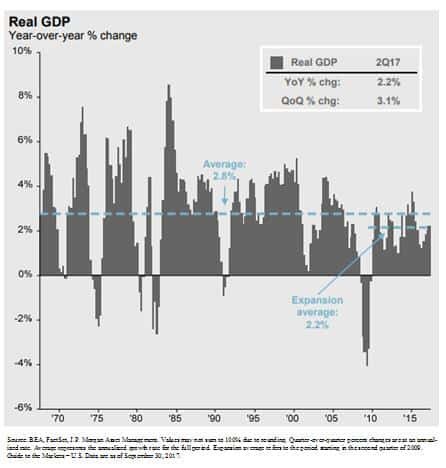
While a roaring economy typically rewards equity investors, the GDP growth rate in the U.S. has continued to grow at that same 2.2% pace that we have seen since the recovery began in March 2009. When you compare that to the GDP growth rates of past economic expansions, some may classify the current growth rate as “sub par”. As in the tale of the
While a roaring economy typically rewards equity investors, the GDP growth rate in the U.S. has continued to grow at that same 2.2% pace that we have seen since the recovery began in March 2009. When you compare that to the GDP growth rates of past economic expansions, some may classify the current growth rate as “sub par”. As in the tale of the tortoise and the hare, sometimes slow and steady wins the race.
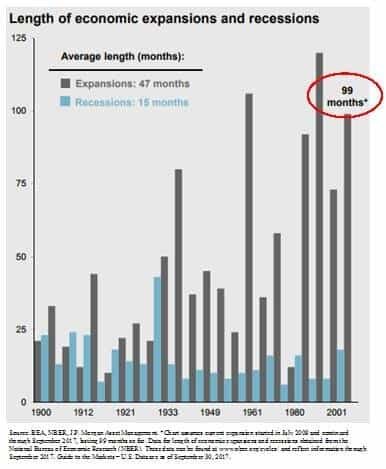
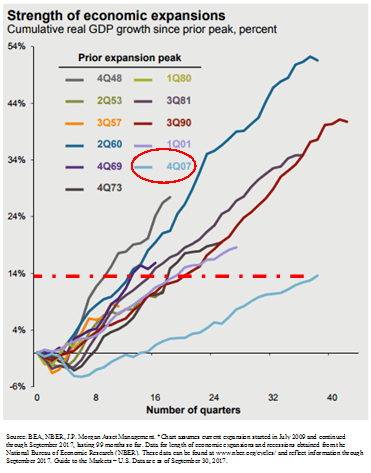
The number one questions on investor’s minds: “It’s been a great rally but are we close to the end?” Referencing the chart below, if you look at the length of the current economic expansion, going back to 1900 we are now witnessing the 3rd longest economic expansion on record which is making investors nervous because as we all know that markets work in cycles.
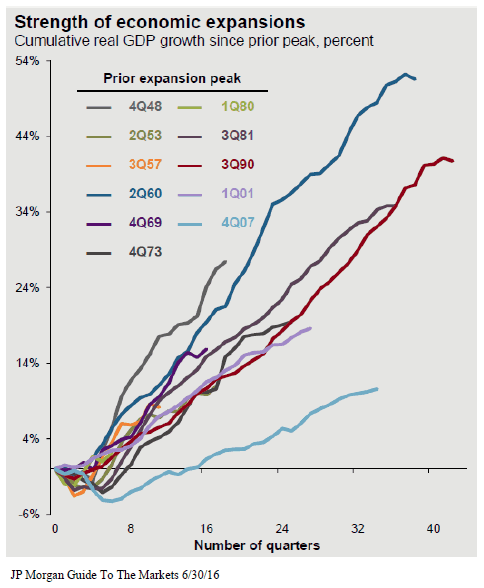
However, if you ignore the “length” of the rally for a moment and look at the “magnitude” of the rally it would seem that total GDP growth of the current economic expansion has been relatively tame compared to some of the economic recoveries in the past. See the chart below. The chart shows evidence that there have been economic rallies in the past that were shorter in duration but greater in magnitude. This may indicate that we still have further to go in the current economic expansion.
What causes big rallies to end?
Looking back at strong economic rallies in the past, the rallies did not die of old age but rather there was an event that triggered the next recession. So we have to be able identify trends within the economic data that would suggest that the economic expansion has ended and it will lead to the next recession.
Watch these two indicators
Two of the main indicators that we monitor to determine where we are in the current economic cycle are the Leading Indicators Index and the Yield Curve. History rarely repeats itself but it does rhyme. Look at the chart of the leading indicators index below. The leading indicators index is comprised of multiple economic indicators that are considered “forward looking”, like housing permits. If there are a lot of housing permits being issues, then demand for housing must be strong, and a strong housing market could lead to further economic growth. Look specifically at 2006. The leading indicators went negative in 2006, over a year before the stock market peaked in 2007. This indicator was telling us there was a problem before a majority of investors realized that we were on the doorstep of the recession.
Let’s look at the second key indicator, the yield curve. You will hear a lot about the “slope of the yield curve” in the media. In a healthy economy, long term interest rates are typically higher than short term rates which results in a “positively slopped” yield curve. In other words, when you go to the bank and you have the choice of buying a 2 year CD or a 10 year CD, you would expect to receive a higher interest rate on the 10 year CD because they are locking up your money for 10 years instead of 2.
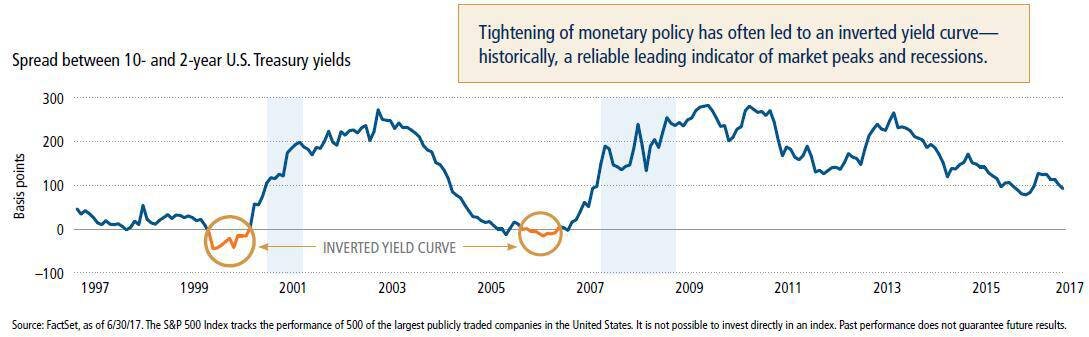
There are periods of time where the interest rate on a 10 year government bond will drop below the interest rate on a 2 year government bond which is considered an “inverted yield curve”. Why does this happen and why would investors by that 10 year bond that is yielding less than the 2 year bond? This happens because bond investors are predicting an economic slowdown in the foreseeable future. They want to lock in the current 10 year interest rate knowing that if the economy goes into a recession that the Fed may begin to lower the Fed Funds Rate which has a more rapid impact on short term rates. It’s a bet that the 2 year bond rate will drop below the 10 year bond rate within the next few years.
If you look at the historical chart of the yield curve above, the yield curve inverted prior to the recession in the early 2000’s and prior to the 2008 recession.
Looking at where we sit today, within the last 6 months the leading indicators index has not only been positive but it’s accelerating and the yield curve is still positively sloped. While we realize that there is not a single indicator that accurately predicts the end of a market cycle, these particular economic indicators have historically been helpful in predicting danger ahead.
There will always be uncertainty in the world. Currently it has taken the form of U.S, politics, tax reforms, geopolitical events, and global monetary policy but it would seem that based on the hard economic data here in the U.S. that our economic expansion that began in March 2009 may still have further to go.
About Michael.........
Hi, I’m Michael Ruger. I’m the managing partner of Greenbush Financial Group and the creator of the nationally recognized Money Smart Board blog . I created the blog because there are a lot of events in life that require important financial decisions. The goal is to help our readers avoid big financial missteps, discover financial solutions that they were not aware of, and to optimize their financial future.
Where Are We In The Market Cycle?
Before you can determine where you are going, you first have to know where you are now. Seems like a simple concept. A similar approach is taken when we are developing the investment strategy for our client portfolios. The question more specifically that we are trying to answer is “where are we at in the market cycle?” Is there more upside
Before you can determine where you are going, you first have to know where you are now. Seems like a simple concept. A similar approach is taken when we are developing the investment strategy for our client portfolios. The question more specifically that we are trying to answer is “where are we at in the market cycle?” Is there more upside to the market? Is there a downturn coming? No one knows for sure and there is no single market indicator that has proven to be an accurate predicator of future market trends. Instead, we have to collect data on multiple macroeconomic indicators and attempt to plot where we are in the current market cycle. Here is a snapshot of where we are at now:
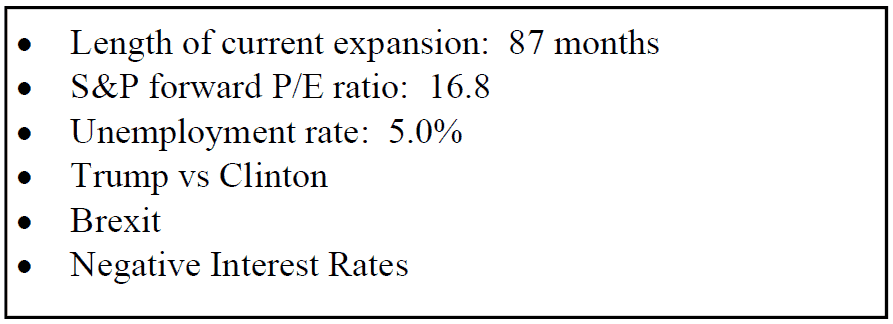
The length of the current bull market is starting to worry some investors. Living through the tech bubble and the 2008 recession, those were healthy reminders that markets do not always go up. We are currently in the 87th month of the expansion which is the 4th longest on record. Since 1900, the average economic expansion has lasted 46 months. This leaves many investors questioning, “is the bull market rally about to end?” We are actually less concerned about the “duration” of the expansion. We prefer to look at the “magnitude” of the expansion. This recovery has been different. In most economic recoveries the market grows rapidly following a recession. If you look at the magnitude of this expansion that started in the 4th quarter of 2007 versus previous expansions, it has been lackluster at best. See the chart on the next page. This may lead investors to conclude that there is more to the current economic expansion.
Next up, employment. Over the past 50 years, the unemployment rate has averaged 6.2%. We are currently sitting at an unemployment rate of 5.0%. Based on that number it may be reasonable to conclude that we are close to full employment. Once you get close to full employment you begin to lose that surge in growth that the economy receives from adding 250,000+ jobs per month. It may also imply that we are getting closer to the end of this market cycle.
Now let’s look at the valuation levels in the stock market. In other words, in general are the stocks in the S&P 500 Index cheap to buy, fairly valued, or expensive to buy at this point? We measure this by the forward price to earning ratio (P/E) of the S&P 500 index. The average P/E of the S&P 500 over the last 25 years is 15.9. Back in 2008, the P/E of the S&P 500 was around 9.0. From a valuation standpoint, back in 2008, stocks were very cheap to buy. When stocks are cheap, investors tend to hold them regardless of what’s happening in the global economy with the hopes that they will at least become “fairly valued” at some point in the future. Right now the P/E Ratio of the S&P 500 Index is about 16.8 which is above the 15.9 historic average. This may indicate that stock are starting to become “expensive” from a valuation standpoint and investors may be tempted to sell positions during periods of volatility.
Even though stocks may be perceived as “overvalued” that does not necessarily mean they are not going to become more overvalued from here. In fact, often times after long bull rallies “the plane will overshoot the runway”. However, it does typically mean that big gains are harder to come by since a large amount of the future earnings expectations of the S&P 500 companies are already baked into the stock price. It leaves the door open for more quarterly earning disappointments which could rise to higher levels of volatility in the markets.

The most popular question of the year goes to: “Trump or Hillary? And how will the outcome impact the stock market?” I try not to get too deep in the weeds of politics mainly because history has shown us that there is no clear evidence whether the economy fares better under a Republican president or a Democratic president. However, here is the key point. Markets do not like uncertainty and one of the candidates that is running (I will let you guess which one) represents a tremendous amount of uncertainty regarding the actions that they may take if elected president of the United States. Still, under these circumstances, it is very difficult to develop a sound investment strategy centered around political outcomes that may or may not happen. We really have to “wait and see” in this case.
Let’s travel over the Atlantic. Brexit was a shock to the stock market over the summer but the long term ramifications of the United Kingdom’s exit from the European Union is yet to be known. The exit process will most likely take a number of years as the EU and the UK negotiate terms. In our view, this does not pose an immediate threat to the global economy but it will represent an ongoing element of uncertainty as the EU continues to restart sustainable economic growth in the region.
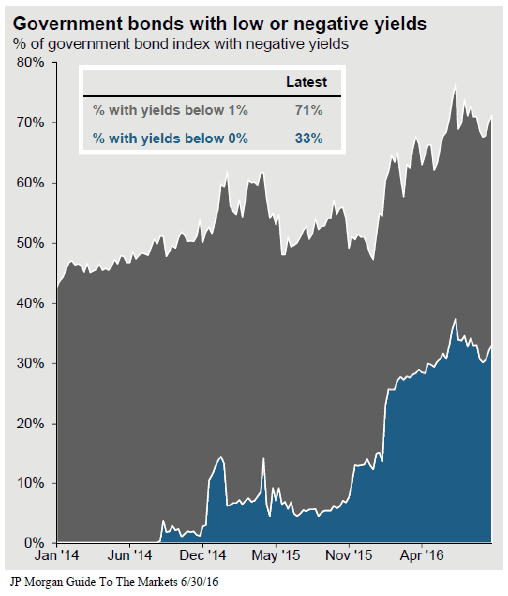
The chart below is one of the most important illustrations that allows us to gauge the overall level of risk that exists in the global economy. When a country wants to jump start its economy it will often lower the reserve rate (similar to our Fed Funds Rate) in an effort to encourage lending. An increase in borrowing hopefully leads to an increase in consumer spending and economic growth. Unfortunately, countries around the globed have taken this concept to an extreme level and have implemented “negative rates”. If you buy a 10 year government bond in Germany or Japan, you are guaranteed to lose money over that 10 year period. If you have a checking account at a bank in Japan, instead of receiving interest from the bank, the bank may charge you a fee to hold onto your own money. Crazy right? It’s happening. In fact, 33% of the countries around the world have a negative yield on their 10 year government bond. See the chart below. When you look around the globe 71% of the countries have a 10 year government bond yield below 1%. The U.S. 10 Year Treasury sits just above that at 1.7%.
So, what does that mean for the global economy? Basically, countries around the world are starving for economic growth and everyone is trying to jump start their economy at the same time. Possible outcomes? On the positive side, the stage is set for growth. There is “cheap money” and favorable interest rates at levels that we have never seen before in history. Meaning a little growth could go a long ways.
On the negative side, these central banks around the global are pretty much out of ammunition. They have fired every arrow that they have at this point to prevent their economy from contracting. If they cannot get their economy to grow and begin to normalize rates in the near future, when they get hit by the next recession they will have nothing to combat it with. It’s like the fire department showing up to a house fire with no water in the truck. The U.S. is not immune to this situation. Everyone wants the Fed to either not raise rates or raise rates slowly for the fear of the negative impact that it may have on the stock market or the value of the dollar. But would you rather take a little pain now or wait for the next recession to hit and have no way to stop the economy from contracting? It seems like a risky game.
When we look at all of these economic factors as a whole it suggests to us that the U.S. economy is continuing to grow but at a slower pace than a year ago. The data leads us to believe that we may be entering the later stages of the recent bull market rally and that now is a prudent time to revisit the level of exposure to risk assets in our client portfolios. At this point we are more concerned about entering a period of long term stagnation as opposed to a recession. With the rate of economic growth slowing here in the U.S. and the rich valuations already baked into the stock market, we could be entering a period of muted returns from both the stock and bond market. It is important that investors establish a realistic view of where we are in the economic cycle and adjust their return expectations accordingly.
As always, please feel free to contact me if you’d like to discuss your portfolio or our outlook for the economy.
About Michael……...
Hi, I’m Michael Ruger. I’m the managing partner of Greenbush Financial Group and the creator of the nationally recognized Money Smart Board blog . I created the blog because there are a lot of events in life that require important financial decisions. The goal is to help our readers avoid big financial missteps, discover financial solutions that they were not aware of, and to optimize their financial future.
