Manufacturing Is Contracting: Another Economic Indicator Flashes Red
Yet another important economic indicator rolled over this week which has triggered a sell-off in the U.S. equity markets. Each month the Institute of Supply Management (“ISM”) issues two reports:
Manufacturing ISM Report
Non-Manufacturing ISM Report
A reading above 50 indicates an expansion and a reading below 50 indicates a contraction. The Manufacturing ISM Report was released on Tuesday and it showed a reading of 47.8 for September indicating that manufacturing in the U.S. is beginning to contract. Not only was it the first contraction of the index within the last few years but the index reached a level not seen since 2009. In this article we will cover:
Why the ISM Index is important
Historically what happens to the stock market after the reading goes below 50?
What caused the unexpected drop in the ISM index?
Manufacturing trends around the globe and how they could impact the U.S. stock market
Why The ISM Index Is Important
The ISM Manufacturing Index tells us how healthy the manufacturing sector of the U.S. economy is. This index is also referred to as the Purchasing Managers Index (PMI) and I will explain why. The ISM issues a monthly survey to more than 300 manufacturing companies. The purchasing managers at these big manufactures are on the front line when it comes to getting a read on the pulse of business conditions. The survey includes questions on the trends in new orders, production, inventories, employment, supply chain, and backlog orders. The ISM assigns weightings to each metric, aggregates all of the responses together, and it results in the data point that signals either an expansion or a contraction.
If most of the manufactures in the U.S. have a ton of new orders, inventories are low, and they are looking to hire more people, that would most likely produce a reading above 50, implying that the outlook is positive for the U.S. economy as these big manufactures ramp up production to meet the increase in demand for their products.
On the other hand, if these surveys show a drop off in new orders, inventories are rising, or hiring has dropped off, that would most likely produce a reading below 50, implying that manufacturing and in turn the U.S. economy is slowing down. Analysts will use the ISM index to get a read on what corporate earnings might look like at the end of the quarter. If the index is dropping during the quarter, this could be foreshadowing a shortfall in corporate earnings for the quarter which the stock market will not find out about until after the quarter end.
Here is a historic snapshot of the ISM’s Manufactures Index:
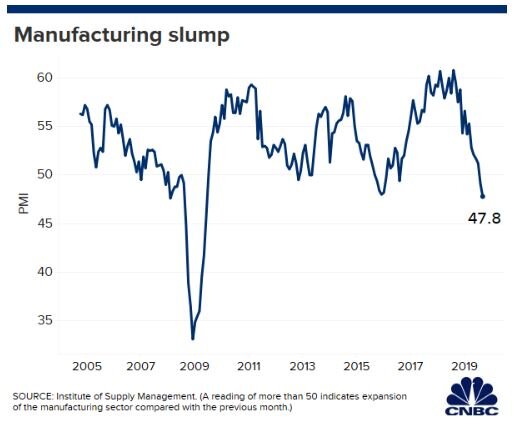
As you will see in the chart, manufacturing has been slowing over the course of the past year but up until September, it was still expanding at a moderate pace. For September, economists had broadly expected a reading of 50.4 but the ISM report produced a result of 47.8 signaling a contraction for the first time since 2016.
What Does This Mean For The Stock Market?
So in the past, when the ISM Index has gone below 50, what happened to the stock market? To answer that question, let’s start by looking at a chart that shows the correlation between the ISM Index and the S&P 500 Index:
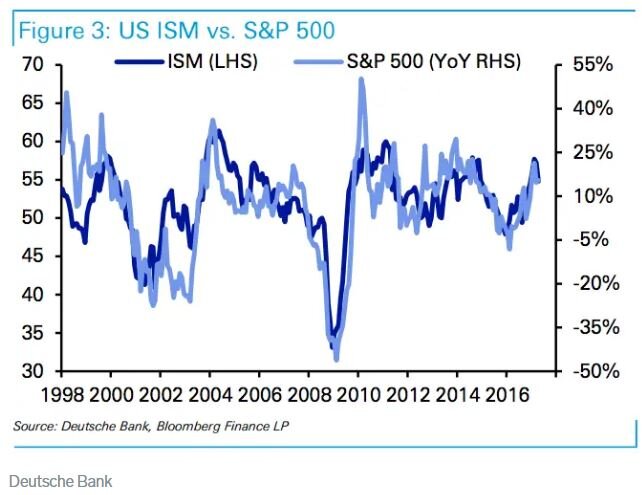
The dark blue line is the ISM index and the light blue line is the S&P 500 Index. Looking at this data, I would highlight the following points:
The ISM Index and the S&P 500 Index seem to move in lockstep. While the ISM might give you a preview of what quarterly earnings might look like, it does not give you a big forward looking preview of bad things to come. By the time the ISM index starts dropping, the stock market is already dropping with it.
We need more data. There have been a few times that the index has gone below 50 within the last 20 years and it has not been followed by a recession. Look at 2016 for example. The ISM index dropped below 50, but if you trimmed your equity positions at that point, you missed the big rally from January 2017 through September 2019. We need more data because historically multiple back to back months of readings below have signaled a recession.
If the index hits 45 or lower within the next few months, watch out below!!
What Caused The Most Recent Drop In The ISM Manufactures Index?
When it comes to unexpected market events, there is usually a wide mote of differing opinions. But it seems like the most recent drop could be attributed to a continued weakening of spending by U.S. businesses. While the U.S. consumer seems to still be strong and spending money, spending by businesses on big ticket items has tapered off over the past few months.
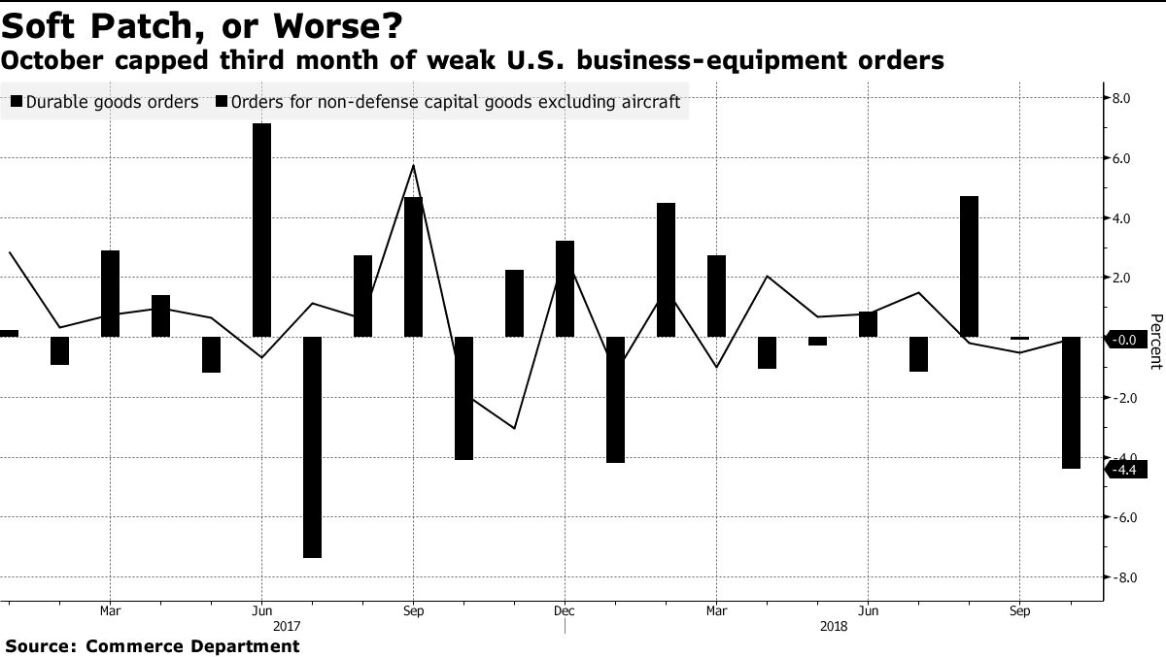
As you will see in the chart above, durable goods orders have dropped over the past two months which is the main barometer for business spending. When businesses are uncertain about the future, they tend to not spend money and business owners have no lack of things to be worried about going into 2020. The growth rate of the U.S. economy has been slowing, uncertainty surrounding global trade continues, and 2020 is an election year. One or more of these uncertainties may need to resolve themselves before businesses are willing to resume spending.
Global Manufacturing Trends
While manufacturing in the U.S. just started contracting in September, the picture is a little darker when we look at the manufacturing trends in other parts of the world. Below is a heat map that shows the PMI Index for countries all around the world. Here is how you read it:
Green is good. Manufacturing is expanding
Yellow is neutral: Manufacturing is flat
Red is bad: Manufacturing is contracting
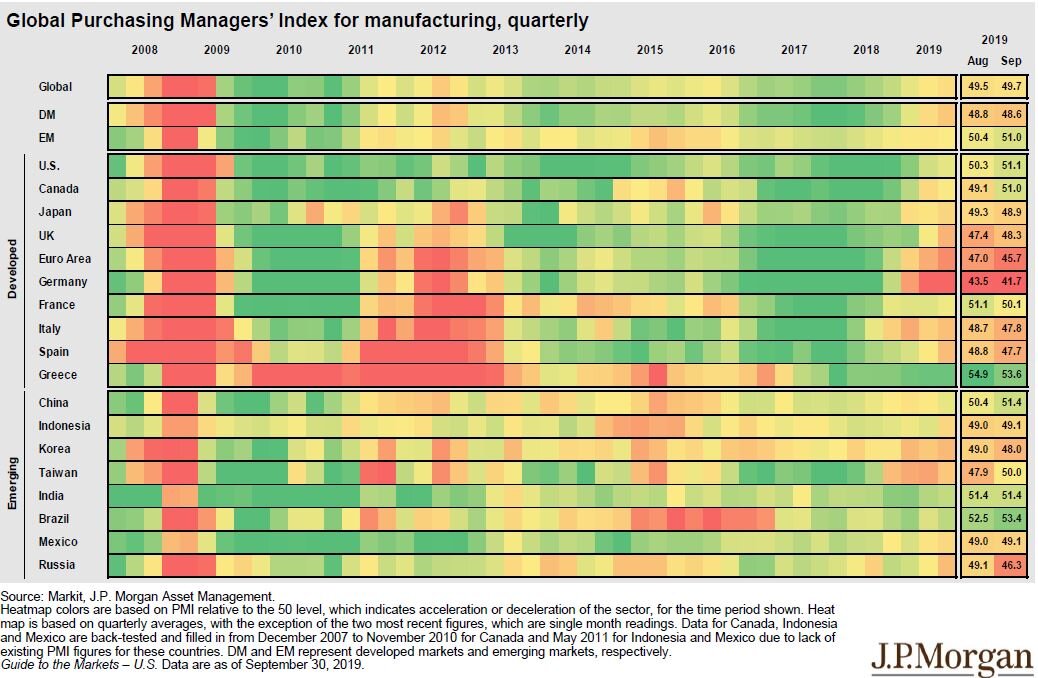
If you look at 2017 and 2018, there was a lot of green all around the world indicating that manufacturing was expanding around the globe. As we have progressed further into 2019, you are beginning to see more yellow and in some areas of the world there is red indicating contraction. Look at Germany in particular. There has been big change in the economic conditions in Europe and the global economy is very interconnected. The weakness that started in Europe seems to be spreading to other places throughout the globe.
ISM Non-Manufacturing Index
Now, you could make the argument that the U.S. is a services economy and it does not rely heavily on manufacturing, so how much does this contraction in manufacturing really matter? Well, if we switch gears to the ISM Non-Manufacturing Index which surveys the services sector of the US economy, the September report just came out with a reading of 52.6 compared to the 55.3 that the market was expecting. This is also down sharply from the 56.4 reported for August.
While the services sector of the U.S. economy is not contracting yet, it seems like the numbers may be headed in that direction.
What Investors Should Expect
There are pluses and minuses to this new ISM data. The contraction of the ISM Manufactures Index and the deceleration of the growth rate of the ISM Non-Manufactures Index in September is just another set of key economic indicators that are now flashing red. Implying that we may be yet another step closer to the arrival of the next recession in the U.S. economy.
The only small positive that can be taken away from this data is that the Fed now has the weak economic data that it needs to begin aggressively reducing interest rates in the U.S. which could boost stock prices in the short term. But investors have to be ready for the rollercoaster ride that the stock market may be headed towards as these two forces collide in the upcoming months.

About Michael……...
Hi, I’m Michael Ruger. I’m the managing partner of Greenbush Financial Group and the creator of the nationally recognized Money Smart Board blog . I created the blog because there are a lot of events in life that require important financial decisions. The goal is to help our readers avoid big financial missteps, discover financial solutions that they were not aware of, and to optimize their financial future.


