

The Coronavirus Battle Will Be Won Or Lost By April 30th
These are unprecedented times. Over the past few weeks we have spent countless hours researching past epidemics, listening to medical experts, economists, market analysts, hedge fund managers, and local business owners. Of all the
These are unprecedented times. Over the past few weeks we have spent countless hours researching past epidemics, listening to medical experts, economists, market analysts, hedge fund managers, and local business owners. Of all the things we’ve learned up to this point, one thing seems very clear to us, we should know by April 30th whether the U.S. economy is setting itself up for a quick recovery or a prolonged recession.
Why April 30th? Confirmed cases of the Coronavirus are going to spike in the upcoming weeks as test results come back. As we charge toward the peak of the infection rate, we will begin to see whether the inflection rate is accelerating or leveling out. All of this is driven by the effectiveness of the containment efforts that are being put in place now. But will it be enough and when will investors know which path the economy is on?
In addition, we are beginning to see some abnormal behavior from certain asset classes within the financial markets as stimulus packages and rate cuts are put to work by countries around the globe. In this article, we will present those trends and help investors prepare for what could be next for the financial markets.
A Race Against Time
The US economy is in a race against time. While every day the headlines are filled with breaking news about bailout packages, interest rate cuts, infection rates, and the stock market dropping by over 1000 points a day, at the risk of over oversimplifying it, there are really only 3 things that matter:
Containing the virus as soon as possible
Keeping businesses solvent during the shutdown
Providing individuals with financial assistance to pay their bills
These items are listed in the order of priority and I'm going to explain why.
#1: Containment
If the US government is not able to slow the infection rate by the end of April, it’s going to be difficult for many businesses to sustain operations without layoffs. While layoffs have already begun in industries directly impacted by the Coronavirus containment efforts such as restaurants, airlines, and hotels, this trend would most likely spread into the broader economy and make a quick recovery less likely.
The ideal scenario is the containment efforts prove effective and by the end of April the rate of infection decreases or levels out, fear subsides in the market knowing that progress is being made, and people resume travelling, restaurants reopen, and global spending and trade return to “pre-Corona” levels. In this scenario, the losses that we have seen in the U.S. stock market could rebound quickly in the second half of the year.
In addition, if there is swift recovery, the U.S. consumer and businesses now have access to lower interest rates, oil prices not seen since 2002, and an economy that would most likely resume it’s steady growth trend.
Error On The Side Of More
As we have seen in prior economic crises, problems become much larger when the government does not act fast enough or with enough firepower to manage the threat; that is especially true of the current situation. Understanding that time is everything in this situation, the government should be erroring on the side of more swift and restrictive measures to contain the virus. Rolling out containment efforts in pieces as we have seen over the past two weeks, in my opinion, creates more risk to achieving a positive outcome and from speaking with business owners over the past few days, it creates more disruption. If you are a business that is still allowed to operate in this environment but every day new restrictions are passed down in pieces, valuable time has to be taken to digest those rules, determine how it impacts the business, and then communicate the new restrictions to the employees. I have heard some business owners say “it would actually be better for us if they just shut everything down for two weeks”.
Erroring on the side of “more” will hurt the stock market and the economy in the short term but I think it will give us a better chance of avoiding a prolonged recession. But we will just have to wait to see how effective the current containment efforts are over the course of the next few weeks.
#2: Keeping Businesses Solvent
The second priority is keeping businesses solvent during the economic slowdown. Most businesses can survive disruptions that last 30 to 60 days if they are given access to cheap capital. It's for this reason that the Fed has rapidly dropped interest rates to almost zero and has pumped billions of dollars of liquidity into the system to encourage banks to lend. The U.S. government is also working on stimulus packages that would provide direct capital injection for industries most adversely effected by the containment efforts. What we are experiencing now is the first “all stop” global economic shutdown that we have ever seen. The government is trying to minimize the number of companies that go insolvent between now in the containment of the virus. At this point, it seems like the U.S. is doing an adequate job of opening up the cash floodgates for the companies here in the U.S.
#3: Financial Assistance For Individuals
The third priority is providing financial assistance for individuals that have been laid off so they can continue meet their basic needs while this containment process runs its course. There are discussions happening right now about the U.S. government sending everyone a check for $1,000, programs for deferring student loan payments, and encouraging financial institutions to create special programs for individuals that have been negatively impacted by the economic slowdown. But I placed this lower on the priority list than business solvency because most people can survive being laid off for a month or two with some financial assistance from the government, but if the current environment turns into a prolonged recession, they lose their job, and are unable to find work over the next 6 to 12 months, that it a much dire situation. It’s vitally important for the U.S. to preserve jobs during this containment period.
Abnormal Activity
When there are unprecedented events that occur in the markets, they bring with them abnormal behaviors within financial markets that tend to surprise investors. During the recent market selloff there are two unexpected events that have occurred:
The pace of the market selloff
Recent losses in the bond market
During the recent selloff, the U.S. stock market set a record when it lost over 20% if its value in just 16 days. By comparison, below is a chart of the other 20% declines in the stock market and the number of days it took for the 20% drop to happen.
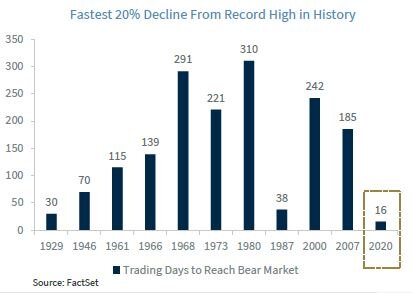
To us, this speaks to the fear and uncertainty surrounding the events that are currently unfolding in the markets. In addition, the average daily price movement of the S&P 500 Index over the past 2 weeks has been 5% per day. That’s a crazy amount of volatility.
Turning to the bond market, a surprising trend has unfolded over the past week. Typically, when the stock market is selling off, interest rates go down, and bond prices go up. This allows bonds to appreciate in value and offset some of the losses from the stock side of the portfolio. While this was the trend for the first two weeks of the sell off, that trend recently reversed. The stock market was selling off and interest rates where rising. This created an environment where both stocks and bonds were losing value at the same time. Not an ideal market environment for a diversified portfolio. On March 17th, the yield on the 10 year treasury bond went from 0.72% to 1.08% which is a big move for a bond yield in a single day, especially considering that the stock market was down that day.
Why did that happen? We can point to a few reasons. First, the bond market is anticipating a $1 trillion dollar stimulus package to be released by Congress. When the government wants to spend $1 trillion dollars, it does so by issuing bonds which is debt. The demand for bonds, especially of this magnitude, are not in high demand because governments around the world are also spending money to stimulate their own economy. To entice people to buy our bonds, they have to offer them at a higher interest rate.
Along those same lines, countries that hold our bonds have been selling them to raise cash to fund their own stimulus packages. As demand for U.S. bonds decreases, the interest rate goes up and the price of the bonds goes down. Will this trend continue? Interest rates could move slightly higher in the short-term but the Fed has the ability to step in and start buying U.S. bonds if it wants to lower interest rates. In addition, the flight to safety trade will most likely continue in upcoming weeks as the uncertainty surrounding the containment efforts persists which will also create additional demand for U.S. Treasuries.
What To Expect
As we sit here on March 19th, it’s tough to handicap which outcome is more likely: a quick bounce back or a prolonged recession. However, the upcoming few weeks are going to be key at providing us with evidence on the success or failure of the containment efforts. Investors need to be ready to make changes to their investment portfolios over the upcoming months as the likely outcome begins to surface. The current market environment has the makings to either be one of the greatest investment opportunities of all time or just the beginning of a prolonged slowdown in the U.S. economy. Emotions will temp investors to make irrational investment decisions but it’s important to keep the relevant economic and financial market data in focus. Stay safe, stay healthy, and we welcome any questions that you have regarding the current market environment.

Michael Ruger
About Michael……...
Hi, I’m Michael Ruger. I’m the managing partner of Greenbush Financial Group and the creator of the nationally recognized Money Smart Board blog . I created the blog because there are a lot of events in life that require important financial decisions. The goal is to help our readers avoid big financial missteps, discover financial solutions that they were not aware of, and to optimize their financial future.


Coronavirus vs. SARS: Buying Opportunity?
As fears of the Coronavirus continue to spread, this week was the largest drop in the stock market since the 2008 / 2009 financial crisis. On Thursday, February 27, 2020, the Dow Jones Index dropped by 1,191 points, making it the
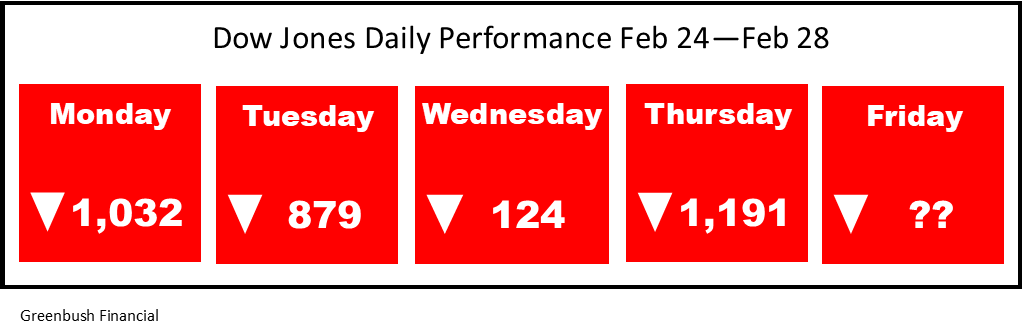
As fears of the Coronavirus continue to spread, this week was the largest drop in the stock market since the 2008 / 2009 financial crisis. On Thursday, February 27, 2020, the Dow Jones Index dropped by 1,191 points, making it the largest single day point drop in the history of the index. As the selling has intensified into the week, clients are asking us what we expect in the upcoming weeks. Should they be buying the dip? Do we expect a further selloff from here?
Like most major market events, we have to look back in history to find similar events that allow us to model how the markets might behave from here. This week, we have conducted extensive research into virus outbreaks that have happened in the past such as SARS, MERS, Zika, and Swine Flu, in an effort to better understand possible outcomes to the Coronavirus epidemic. In this article, I’m going to share with you:
Coronavirus vs SARS / Zika / other epidemics
What makes the Coronavirus different than other epidemics in the past
Why has this selloff been so fast & fierce
Disruptions to the global supply chain
Performance of the stock market following the end of epidemics in the past
Will the Fed lower rates to help the market
When does this become a buying opportunity for investors
Coronavirus vs SARS
We spent an extensive amount of time comparing Coronvavirus to SARS, and other epidemics in the past. Without a doubt, the Coronavirus is very different than many of the epidemics that we have seen in the past which is making financial modeling very difficult. When we compare the Coronavirus to SARS and other outbreaks, the rate at which the Coronavirus has spread in the first 30 days is unprecedented. Here are a few time lapse charts that compares the infection rate of the Coronavirus to SARS, Ebola, MERS, and Swine Flu.
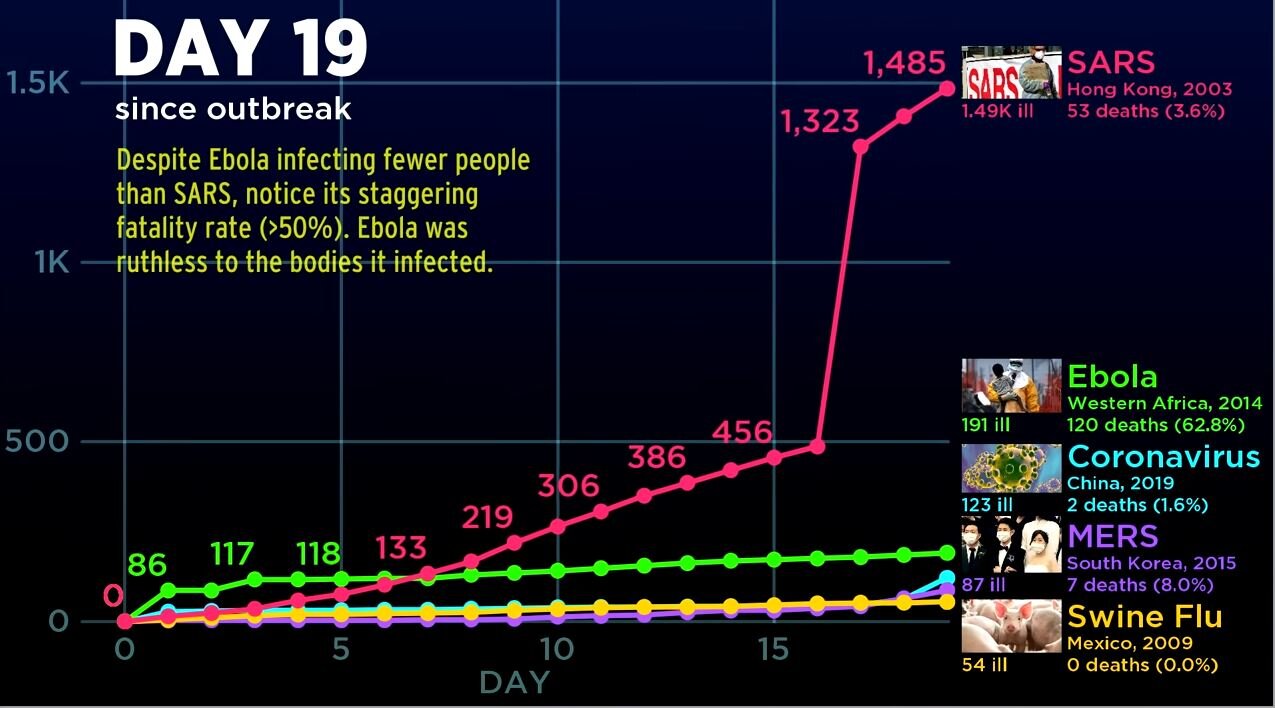
When you compare SARS to the Coronavirus at Day 19, SARS was much worse out of the gates. By Day 19, SARS had infected 1,490 people and 53 people had died, making the death rate 3.6%. By comparison, at Day 19, Coronavirus had only infected 123 people in China, and resulted in 2 deaths. Making the death rate 1.6%.
However, only 7 days later, at Day 26, the story completely changed:
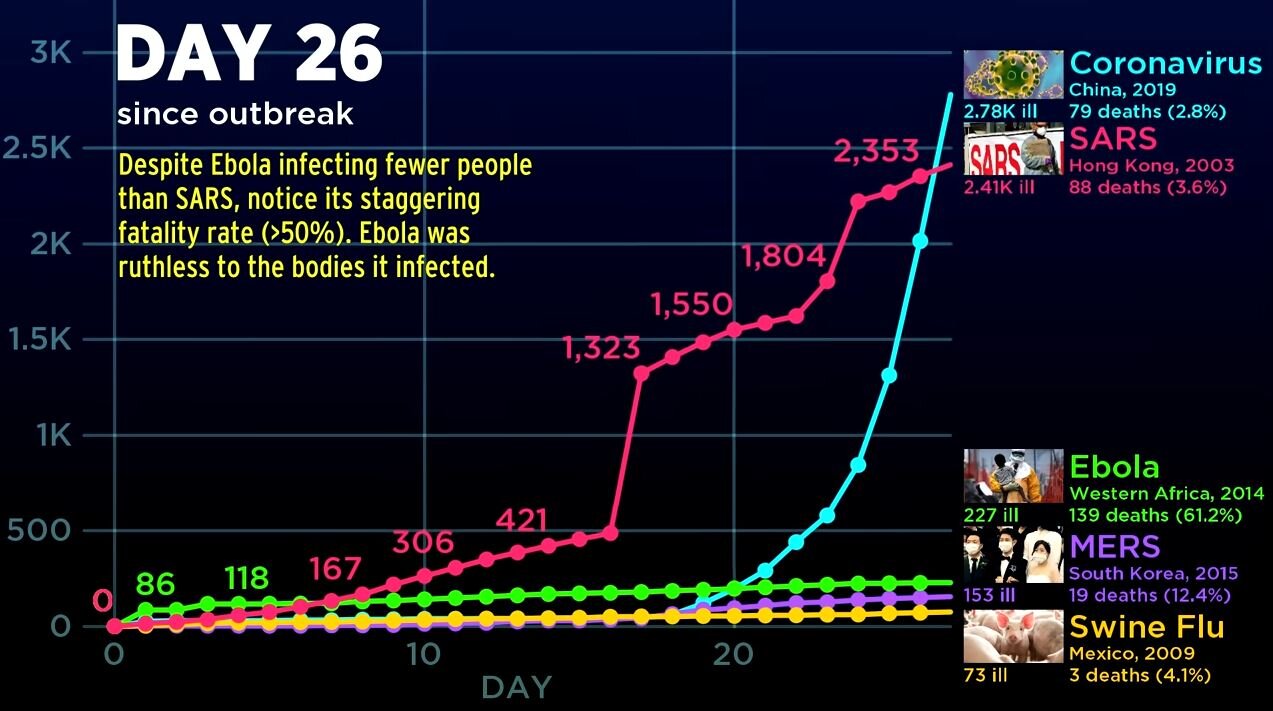
By Day 26, the number of confirmed cases of Coronavirus rocketed higher, outpacing that of SARS in the early 2000’s. In addition, the death toll for the Coronavirus jumped to 79 people.
But then it continued to get worse. By Day 43, the chart says it all:
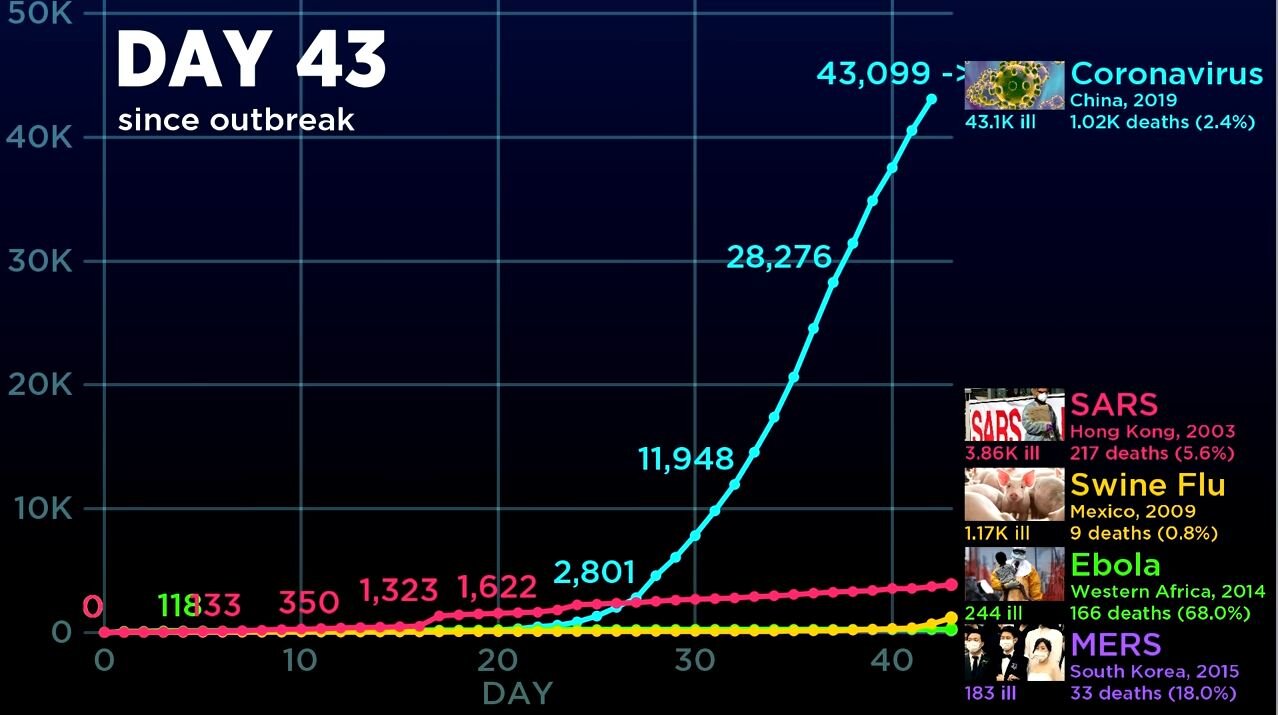
By day 43, the number of confirmed cases of the Coronavirus jumped to 43,099 compared to just 3,860 confirmed cases of the SARS virus during that same time period. The death toll for the Coronavirus had risen to over 1,000 people compared to 217 from SARS during that same time period. This chart highlights the main issue with the Coronavirus. It’s spreading faster than government’s are able to control compared to most epidemics in the past.
Now, I say “most” because when we started gathering the data, there is a chart that looks similar to the Coronravirus outbreak. If I move these charts forward to Day 122, this is what happened with the Swine Flu in Mexico in 2009.
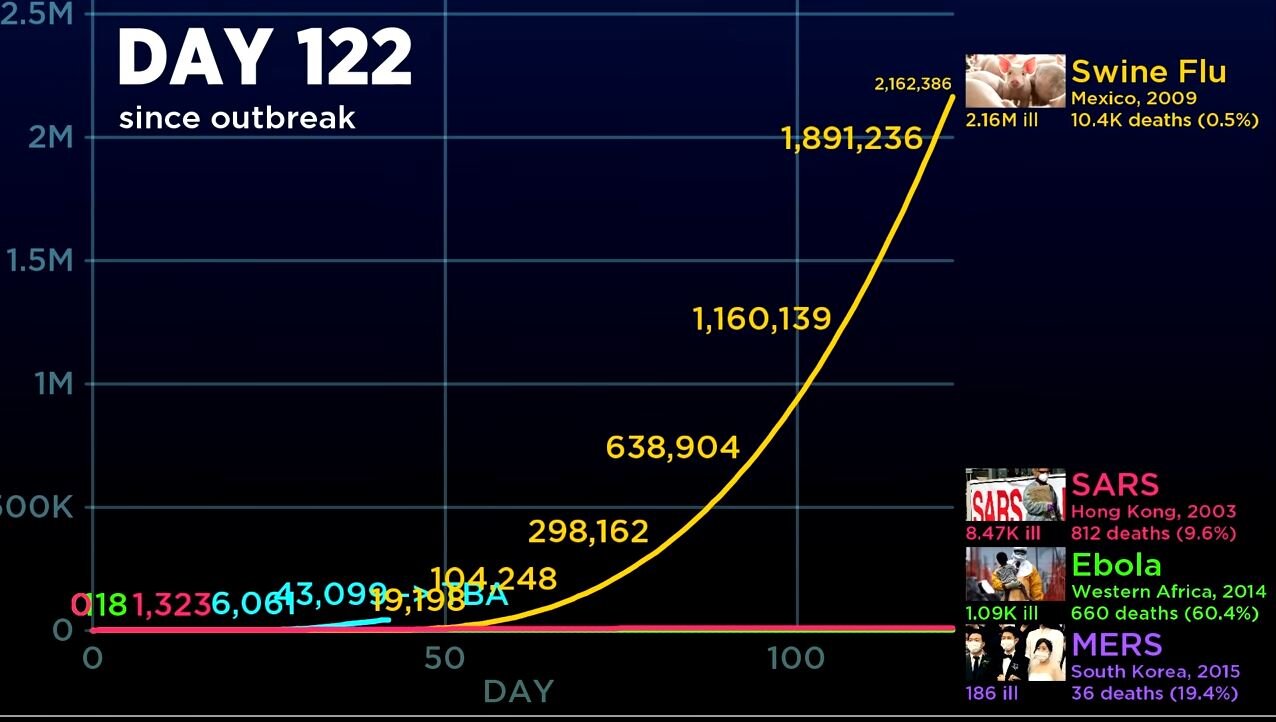
The Swine Flu was relatively mute for the first 50 days, but after day 50, the chart looks very similar to the fast spread of the Coronavirus. By Day 122, 2.1M people had been infected with the Swine Flu and over 10,000 people had died.
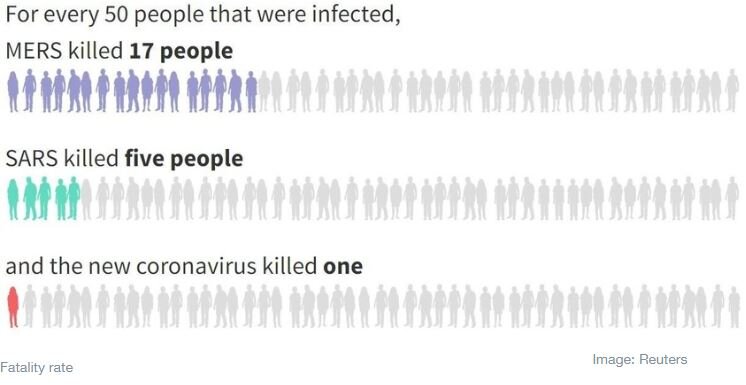
So why didn’t you hear more about the Swine flu when it was happening? The death rate of the Swing Flu was only 0.5%. Compare this to the current 2.1% estimated death rate of the Coronavirus, which is not as high as the SARS death rate of 4.9%, but it is significantly higher than the Swine Flu. Here is a chart comparing the death rate of SARS, Coronavirus, and MERS:
Another important note, the Swine Flu was fairly wide spread as well. See the chart below from the World Health Organization on the Swine Flu:
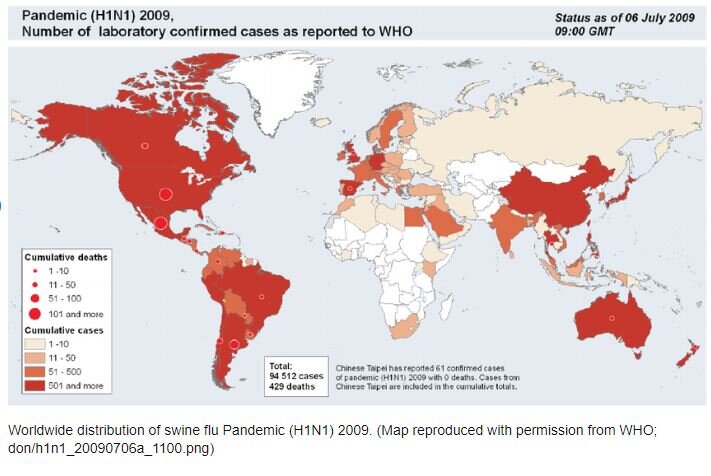
However, given how fast the Coronavirus is spreading in it’s early stage, it could end up having a larger global footprint than the Swine Flu if they are unable to contain it soon.
Key Takeaway From The Comparison
Our key takeaway from this comparison is that Coronavirus has spread more quickly in the early stages compared to past epidemics which represents a larger risk to the markets than in the past. Due to the pace of the spread, it’s difficult to put an estimated timeline together for containment. When we look at the comparison of Coronavirus to the Swine Flu, it shows that there could be further downside risks to the markets if the spread of the virus follows a similar glide path.
Coronavirus Disruption To The Market
We issued an article earlier this week explaining the business impact of the Coronavirus.
Article: Coronavirus & The Market Selloff
I just want to quickly summarize again what’s causing the market selloff from a business standpoint. As the Coronavirus continues to spread to other regions, it forces governments to restrict the movements of its people in an effort to contain the spread of the virus. This means transportation is shut down, events are canceled where there would have been large gatherings of people, and employees are not going to work. Also, when people are afraid, they don’t go out to eat, and they don’t go shopping. All of these things have a direct impact on the revenue of the companies that make up the stock market. When these companies entered 2020, there was no expectation that their manufacturing operations could be completely shut down due to a global health epidemic. The stock market right now is trying to determine how much it needs to discount the prices of these companies based on the revenue that’s being lost.
The longer the epidemic continues, the longer it takes people to get back to work, the longer it takes people to resume their normal spending habits, and the more damage it does to the markets.
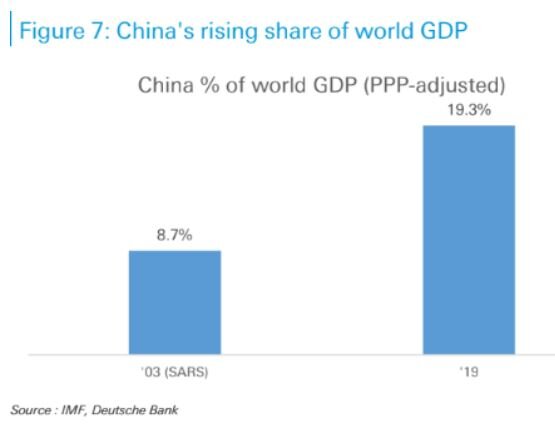
The China Impact
When comparing SARS to the Coronavirus it’s also important to acknowledge the growth in the size of China’s economy between 2003 and 2020. When the SARS outbreak happened in 2003, China’s economy only represented 8.7% of global GDP. As of 2019, China’s economy now equals 19% of total global GDP. Since the Coronavirus has been the most wide spread in China, It will have a much larger impact on the markets around the globe compared to the SARS outbreak when China was a much smaller player in the global economy.
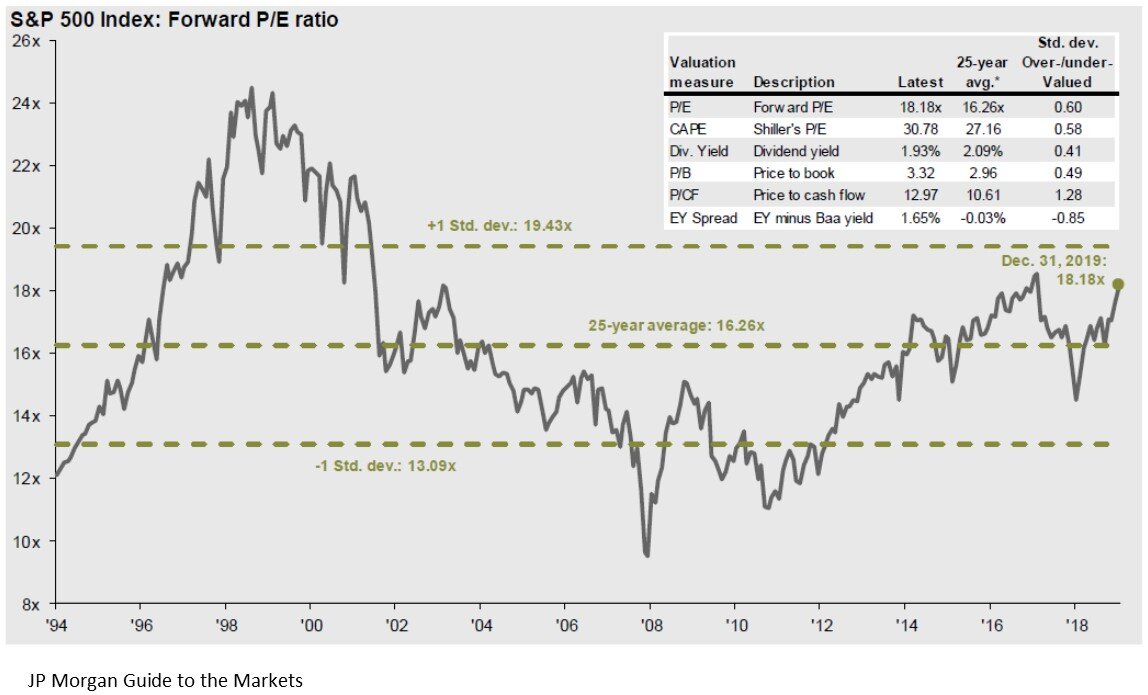
Valuations in the U.S. Stock Market
In our opinion, one of the other big factors that has fueled the magnitude of the selloff here in the U.S., is the simple fact that going into 2020, the stock market was overvalued already by historic terms. As of December 31, 2019, the P/E ratio of the S&P 500 was 18. The 25 year historical average P/E for the S&P 500 Index is 16. This essentially means that stocks were expensive going into the beginning of the year. When stocks are already arguably overvalued, and a negative event happens, the prices have to drop by more realizing that those companies are not going to produce the earnings growth for the upcoming year that was already baked into the stock price.
Fed Lowering Rates
There is talk now of the Fed coming to the markets aid and lowering interest rates throughout the year. Going into 2020, it was the market’s expectation that the Fed was going to remain on hold for 2020. In my opinion, the rate cuts are probably warranted at this point, given the unexpected slowdown to the global economy as a result of the Coronavirus. But I would also warn that the Fed lowering interest rates is not in itself going to heal the markets. Giving companies access to cheaper capital is not going to make people feel safer about traveling around the globe and it’s not going to help manufacturers resume operations if their employees can’t get to the factory due to travel restrictions.
However, giving companies access to cheaper capital will allow them to better weather the storm while the governments around the world work on a containment plan. Without that access to cheap capital, you could see companies going under because it took revenue too long to ramp back up.
Global Supply Chain
Investors should not underestimate the damage that has been done to the global supply change and how long it takes to get the supply chain back up and running again. A good example are car manufacturers. They do not typically keep large inventories of parts, and if those parts are not being made, they’re not being shipped, meaning they can’t build the cars, so they can’t sell the cars, and revenue drops.
Within the electronics industry, a lot of the products are made up of hundreds if not thousands of components, and the product does not work without all of those components. If there is one computer chip that is made in Korea, and the manufacturing of those chips has been halted, then the end product cannot be built and shipped. The examples go on and on but when you think of manufacturing around the globe being brought offline, it’s not like a light switch where you can go and simply turn it back on. It takes a while for it to get back up and running again. So while investors might think the Coronavirus could just impact Q1 revenue, it’s more likely that it will impact revenue beyond just the first quarter.
When Do You Buy The Dip?
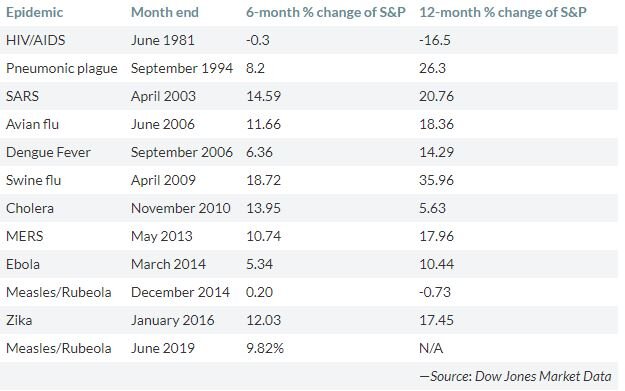
I have received a lot of calls from clients asking if they should begin buying stocks at these lower levels with the anticipation of a bounce back. When we look at other epidemics in the past, there has been a sizable rally in the stock market 6 to 12 months after the epidemic has ended. The chart below shows each epidemic and the subsequent 6 month and 12 month return of the S&P 500 after the epidemic ended. On average, the stock market rose 20% a year following the end of the epidemic which is why investors are eager to buy into the selloff.
In my personal opinion, at some point, the Coronavirus will be contained and it will create an opportunity for investors. There is pent up demand being accumulated now that will need to be filled after the virus is contained. Individuals will most likely reschedule vacations and travel plans once they feel it’s safe to travel around the globe, and the Fed, via lower rates, will have given companies access to even cheaper capital to grow. But as I write this article on February 28th, I caution investors. When you look at the data that we’ve collected, there could definitely be more downside to the selloff if they are unable to contain the spread of the Coronavirus within the next few weeks. The market right now is just trying to guess how much damage has been done with no real solid guidance as to whether it’s guessing right or wrong.
It may be prudent to wait for evidence that progress is being made on the containment efforts of the virus before buying back into the market. For long term investors, it’s important to understand that while the Coronavirus will undoubtedly have an impact on the revenue of companies in 2020, in the past, epidemics have rarely changed the fate of solid companies over the long term.
Michael Ruger
About Michael……...
Hi, I’m Michael Ruger. I’m the managing partner of Greenbush Financial Group and the creator of the nationally recognized Money Smart Board blog . I created the blog because there are a lot of events in life that require important financial decisions. The goal is to help our readers avoid big financial missteps, discover financial solutions that they were not aware of, and to optimize their financial future.


Coronavirus & The Market Selloff
Today was a wild ride for the stock market. The Dow Jones posted a loss of 1,031 points on February 24, 2020 as fears of the continued spread of the Coronavirus sparked a selloff in the stock market. Over the past 24 hours, we've
Today was a wild ride for the stock market. The Dow Jones posted a loss of 1,031 points on February 24, 2020 as fears of the continued spread of the Coronavirus sparked a selloff in the stock market. Over the past 24 hours, we've received the following questions from clients that I want to address in this article:
Why is the market selling off on this news?
Do you think the selloff will continue?
Should you be moving money out of stocks into bonds?
Why Is Market Selling Off On This News?
You have to remember that the stock market is made up of individual companies. Each company’s stock price is just an educated guess by investors as to how much those companies are going to make in profits over the next 3 months, 1 year, 5 years, and beyond. Unexpected events like the Coronavirus create large deviations between those educated guesses and actual results.
In the case of the Coronavirus, it’s disrupting the revenue stream of many companies that produce and sell goods across the globe. For example, Nike receives 17% of its revenue from China, and the company has temporarily closed more than half of its stores in China. The stores that remain open are operating on abbreviated hours. If the stores are not open, then they can’t sell Nike shoes and apparel, which will most likely cause Nike’s Q1 revenue to be lower than expected. That in turn could cause the stock price to drop once the Q1 earnings report is released later this year.
But it’s not just Nike. The S&P 500 Index is made up of a lot of companies that sell goods in China and other locations around the world: Apple, Yum Brands, McDonalds, Proctor & Gamble, and the list goes on. Beyond just retail, you have airlines, hotels, and casinos that are being negatively impacted as people cancel travel plans and vacations. The point I’m trying to make is there are real business reasons why the stock market is reacting the way it is, it’s not just displaced fear.
All of these companies are trying to figure out right now what the impact will be to their revenue. The next question then becomes, how much are these companies going to miss by?
Do You Think the Selloff Will Continue?
That leads us into the next questions which is “do you think the selloff will continue?” Historically, contagious disease outbreaks have been quickly contained, such as the SARS outbreak in the early 2000’s. The amount of damage to the markets seems to be highly correlated to the amount of time it takes to contain the outbreak. The longer it takes to contain the outbreak, the longer it takes people to return to work and to return to their normal spending habits. The news broke this morning that there are new confirmed cases of the Coronavirus in Italy and South Korea which makes investors question whether or not the threat has been contained.
Unfortunately, there is no solid answer as to how long the current selloff might last. It could end tomorrow or it could continue off and on over the next few weeks. But it’s important to remember that even though market events like the Coronavirus do impact the short-term profitability of companies, it’s less common that these types of events impact the long-term performance. When you have a selloff sparked by a single market event versus a full blown recession, it’s not uncommon for long term investors to start stepping into the market and buying stocks at these lower levels.
Should You Be Moving Money Out Of Stocks Into Bonds?
This bring us to the final question, should you be making changes to your investment portfolio based on today’s market events? In my opinion, the answer to that is “no” but I think there is a lesson to be learned for investors that are still overweight stocks in their portfolio. Over the past year, the stock market has appreciated rapidly in value but the growth rate of corporate earnings has lagged behind. When this happens, stocks start to become overvalued, and the market becomes more vulnerable to selloffs.
This week the selloff was sparked by the Coronavirus, a few months from now it could be fears surrounding the elections in the U.S., trade, or some other geopolitical event. When you enter the later stages of an economic expansion, volatility, which has been largely absent from the U.S. stock market over the past few years, becomes a common place. Investors that have elected to stay overweight riskier asset classes in the later stages of this economic cycle, need to make sure they have the risk tolerance and discipline to weather these market selloffs.
Michael Ruger
About Michael……...
Hi, I’m Michael Ruger. I’m the managing partner of Greenbush Financial Group and the creator of the nationally recognized Money Smart Board blog . I created the blog because there are a lot of events in life that require important financial decisions. The goal is to help our readers avoid big financial missteps, discover financial solutions that they were not aware of, and to optimize their financial future.


Manufacturing Is Contracting: Another Economic Indicator Flashes Red
Yet another important economic indicator rolled over this week which has triggered a sell-off in the U.S. equity markets. Each month the Institute of Supply Management (“ISM”) issues two reports: Manufacturing ISM ReportNon-
Yet another important economic indicator rolled over this week which has triggered a sell-off in the U.S. equity markets. Each month the Institute of Supply Management (“ISM”) issues two reports:
Manufacturing ISM Report
Non-Manufacturing ISM Report
A reading above 50 indicates an expansion and a reading below 50 indicates a contraction. The Manufacturing ISM Report was released on Tuesday and it showed a reading of 47.8 for September indicating that manufacturing in the U.S. is beginning to contract. Not only was it the first contraction of the index within the last few years but the index reached a level not seen since 2009. In this article we will cover:
Why the ISM Index is important
Historically what happens to the stock market after the reading goes below 50?
What caused the unexpected drop in the ISM index?
Manufacturing trends around the globe and how they could impact the U.S. stock market
Why The ISM Index Is Important
The ISM Manufacturing Index tells us how healthy the manufacturing sector of the U.S. economy is. This index is also referred to as the Purchasing Managers Index (PMI) and I will explain why. The ISM issues a monthly survey to more than 300 manufacturing companies. The purchasing managers at these big manufactures are on the front line when it comes to getting a read on the pulse of business conditions. The survey includes questions on the trends in new orders, production, inventories, employment, supply chain, and backlog orders. The ISM assigns weightings to each metric, aggregates all of the responses together, and it results in the data point that signals either an expansion or a contraction.
If most of the manufactures in the U.S. have a ton of new orders, inventories are low, and they are looking to hire more people, that would most likely produce a reading above 50, implying that the outlook is positive for the U.S. economy as these big manufactures ramp up production to meet the increase in demand for their products.
On the other hand, if these surveys show a drop off in new orders, inventories are rising, or hiring has dropped off, that would most likely produce a reading below 50, implying that manufacturing and in turn the U.S. economy is slowing down. Analysts will use the ISM index to get a read on what corporate earnings might look like at the end of the quarter. If the index is dropping during the quarter, this could be foreshadowing a shortfall in corporate earnings for the quarter which the stock market will not find out about until after the quarter end.
Here is a historic snapshot of the ISM’s Manufactures Index:
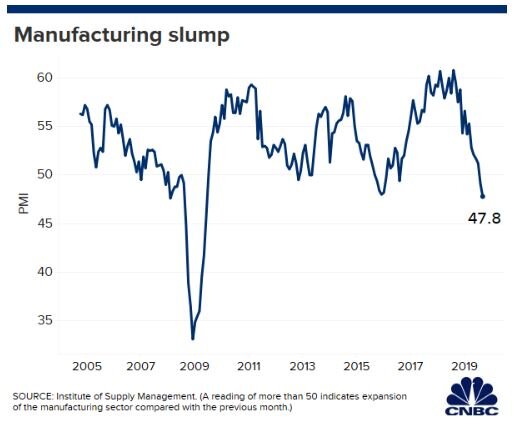
As you will see in the chart, manufacturing has been slowing over the course of the past year but up until September, it was still expanding at a moderate pace. For September, economists had broadly expected a reading of 50.4 but the ISM report produced a result of 47.8 signaling a contraction for the first time since 2016.
What Does This Mean For The Stock Market?
So in the past, when the ISM Index has gone below 50, what happened to the stock market? To answer that question, let’s start by looking at a chart that shows the correlation between the ISM Index and the S&P 500 Index:
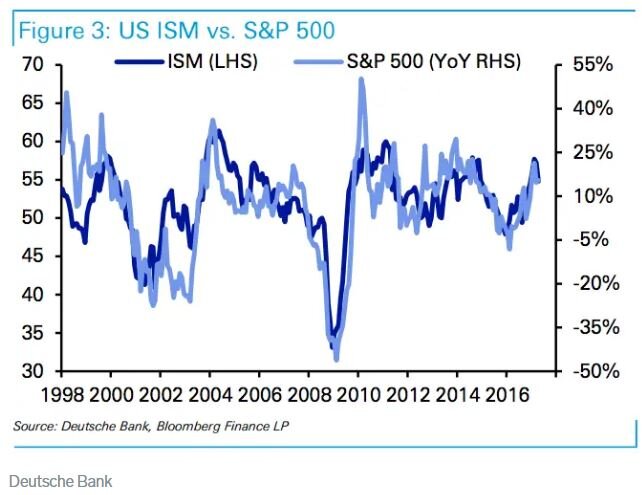
The dark blue line is the ISM index and the light blue line is the S&P 500 Index. Looking at this data, I would highlight the following points:
The ISM Index and the S&P 500 Index seem to move in lockstep. While the ISM might give you a preview of what quarterly earnings might look like, it does not give you a big forward looking preview of bad things to come. By the time the ISM index starts dropping, the stock market is already dropping with it.
We need more data. There have been a few times that the index has gone below 50 within the last 20 years and it has not been followed by a recession. Look at 2016 for example. The ISM index dropped below 50, but if you trimmed your equity positions at that point, you missed the big rally from January 2017 through September 2019. We need more data because historically multiple back to back months of readings below have signaled a recession.
If the index hits 45 or lower within the next few months, watch out below!!
What Caused The Most Recent Drop In The ISM Manufactures Index?
When it comes to unexpected market events, there is usually a wide mote of differing opinions. But it seems like the most recent drop could be attributed to a continued weakening of spending by U.S. businesses. While the U.S. consumer seems to still be strong and spending money, spending by businesses on big ticket items has tapered off over the past few months.
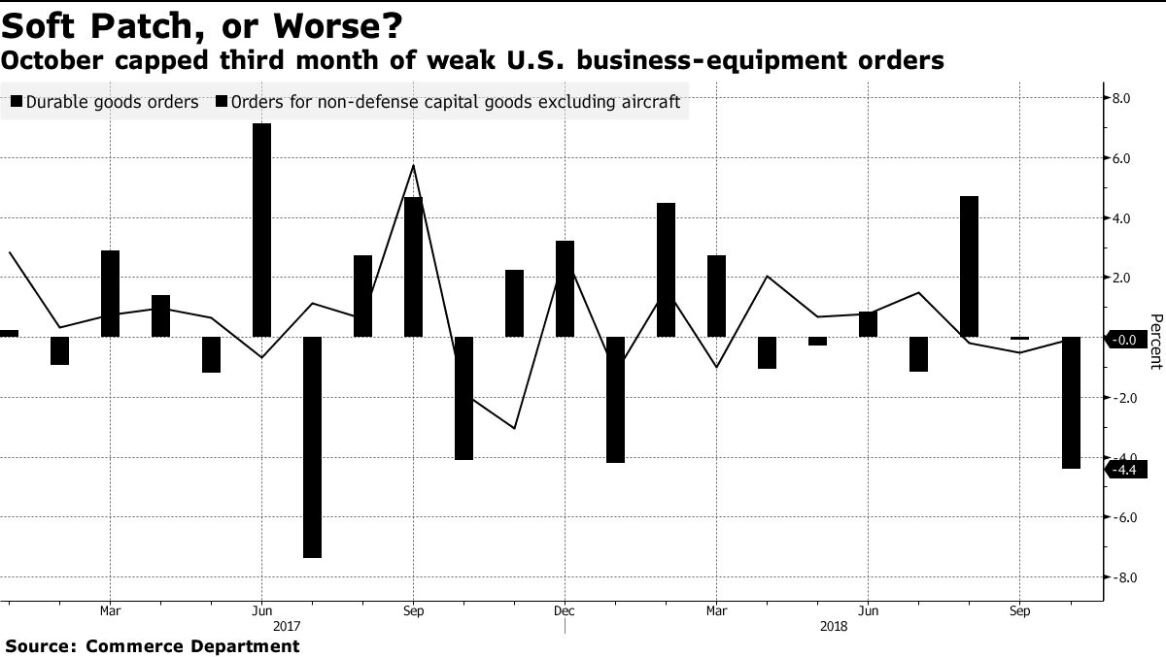
As you will see in the chart above, durable goods orders have dropped over the past two months which is the main barometer for business spending. When businesses are uncertain about the future, they tend to not spend money and business owners have no lack of things to be worried about going into 2020. The growth rate of the U.S. economy has been slowing, uncertainty surrounding global trade continues, and 2020 is an election year. One or more of these uncertainties may need to resolve themselves before businesses are willing to resume spending.
Global Manufacturing Trends
While manufacturing in the U.S. just started contracting in September, the picture is a little darker when we look at the manufacturing trends in other parts of the world. Below is a heat map that shows the PMI Index for countries all around the world. Here is how you read it:
Green is good. Manufacturing is expanding
Yellow is neutral: Manufacturing is flat
Red is bad: Manufacturing is contracting
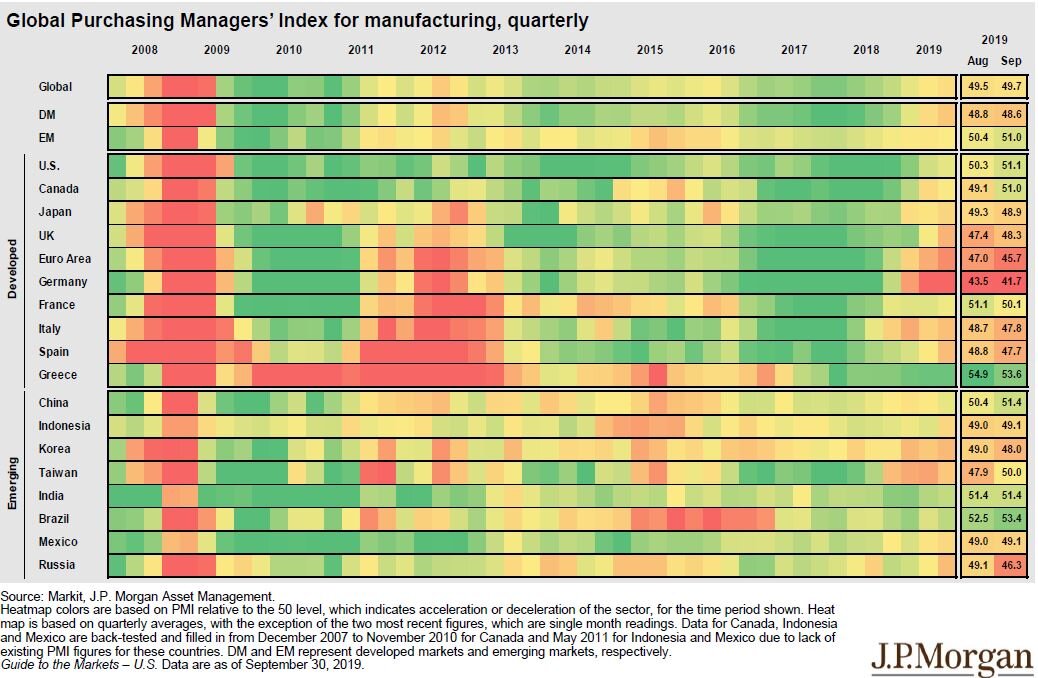
If you look at 2017 and 2018, there was a lot of green all around the world indicating that manufacturing was expanding around the globe. As we have progressed further into 2019, you are beginning to see more yellow and in some areas of the world there is red indicating contraction. Look at Germany in particular. There has been big change in the economic conditions in Europe and the global economy is very interconnected. The weakness that started in Europe seems to be spreading to other places throughout the globe.
ISM Non-Manufacturing Index
Now, you could make the argument that the U.S. is a services economy and it does not rely heavily on manufacturing, so how much does this contraction in manufacturing really matter? Well, if we switch gears to the ISM Non-Manufacturing Index which surveys the services sector of the US economy, the September report just came out with a reading of 52.6 compared to the 55.3 that the market was expecting. This is also down sharply from the 56.4 reported for August.
While the services sector of the U.S. economy is not contracting yet, it seems like the numbers may be headed in that direction.
What Investors Should Expect
There are pluses and minuses to this new ISM data. The contraction of the ISM Manufactures Index and the deceleration of the growth rate of the ISM Non-Manufactures Index in September is just another set of key economic indicators that are now flashing red. Implying that we may be yet another step closer to the arrival of the next recession in the U.S. economy.
The only small positive that can be taken away from this data is that the Fed now has the weak economic data that it needs to begin aggressively reducing interest rates in the U.S. which could boost stock prices in the short term. But investors have to be ready for the rollercoaster ride that the stock market may be headed towards as these two forces collide in the upcoming months.

About Michael……...
Hi, I’m Michael Ruger. I’m the managing partner of Greenbush Financial Group and the creator of the nationally recognized Money Smart Board blog . I created the blog because there are a lot of events in life that require important financial decisions. The goal is to help our readers avoid big financial missteps, discover financial solutions that they were not aware of, and to optimize their financial future.
The Top 4 Things That You Need To Know About The Trade War With China
The trade negotiations between the U.S. and China have been the center of the stock market’s attention for the past 6 months. One day it seems like they are close to a deal and then the next day both countries are launching new tariffs against each other. While many investors in the U.S. understand the trade wars from the vantage point of the United
The trade negotiations between the U.S. and China have been the center of the stock market’s attention for the past 6 months. One day it seems like they are close to a deal and then the next day both countries are launching new tariffs against each other. While many investors in the U.S. understand the trade wars from the vantage point of the United States, very few people understand China’s side of the equation. The more we learn about China’s motivation and viewpoint, the more we realize that this could be a very long, ugly, and drawn out battle. The main risk is if this battle is not resolved soon it could lead to a recession in the U.S. sooner than expected.
1: China Is Tired Of Being On The Losing End Of Trade Deals
When you look back through history, going as far back as the mid 1800’s, China has been on the losing end of many of it’s trade deals. To summarize that history, when you are a very poor country, and your economy is based primarily on exporting goods to other countries, those countries that are buying your goods have a lot of power over you. If you don’t agree to their terms, they stop buying from you, and your economy collapses. China’s history is filled with trade deals where terms were dictated to them so they feel like they have been taken advantage of.
Now that China has the fastest growing middle class in the world, they are less reliant on trade to fuel their economy. Also, the size of China’s economy is growing extremely fast. The size of a country’s economy is measured by their GDP (Gross Domestic Product). A country’s annual GDP is the dollar value of all the goods and services that are produced in that country in a single year. It’s fascinating to see how quickly China has grown over the past 20 years compared to the U.S.
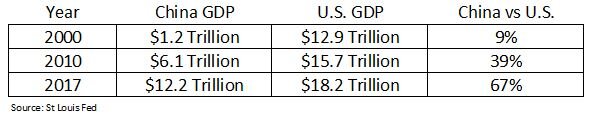
The numbers speak for themselves. In 2000, the size of China’s economy was only 9% of the U.S. economy. In only a 17-year period, China’s economy is now 67% the size of the U.S. economy and based on current GDP data from both countries, they are still growing at a pace that is about three times faster than the U.S. economy.
China seems to be making a statement to the world in these negotiations that terms will no longer be dictated to them. China now has the economic firepower to negotiate terms as an equal which could drag out the trade negotiations longer than investors expect.
2: Tariff Impact On China vs U.S.
In May, the U.S. raised the tariffs on select goods imported from China from 10% to 25%. China then retaliated by raising their tariffs on US imports from 10% to 25%. We have heard in the news that these tariffs hurt China more than they hurt the U.S. In the short term this would seem to be true. The U.S. imports about $500 Billion in goods from China compared to the $100 Billion in goods that China imports from the U.S.
But the next question is, “if it hurts China more, does it hurt them a lot or a little from the standpoint of their overall economy?” The answer; not as much as you would think. The chart below shows China’s total exports as a percentage of their GDP.
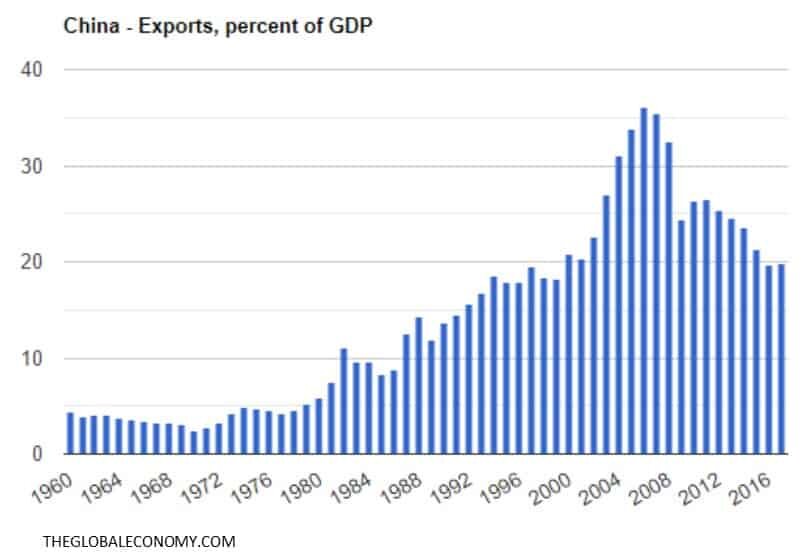
Back in 2007, exports contributed to over 35% of China’s total GDP. As of 2018, exports represent less than 20% of China’s annual GDP. Of their total exports about 18% go to the U.S. So if you do the math, exports to the U.S. equal about 3.6% of China’s total annual GDP. Personally, I was surprised how low that number was. Based on what we have been hearing about the negotiations and how the U.S. is in such a strong position to negotiate, I would have expected the export number to be much larger, but it’s less than 4% of their total GDP. This again may lead investors to conclude that the volatility we are seeing in the markets surrounding the trade negotiations may be an unwelcomed guest that is here to stay for longer than expected.
3: The Impact of Tariffs On The US Economy
While the U.S. is using tariffs as a negotiating tool, it may be the U.S. consumer that ends up paying the price. That washing machine that was $500 in April may end up costing $625 in June. Companies that are importing goods from China and selling them to the U.S. consumer will have to decide whether to absorb the cost of the tariffs which would decrease their net profits or pass those costs onto the consumer in the form of higher prices.
The other problem that you can see in this example is tariffs are inflationary. Meaning they push prices higher. The Fed announced at their last meeting that they were content with keeping interest rates where they are for the remainder of 2019 given the slowing economic growth rate and tame inflation. But if tariffs spark inflation, they may have to reverse course and raise rates unexpectedly to keep the inflation rate under control which would be bad news for the stock market.
4: Global uncertainty
Companies typically do not invest or make plans for growth if the global economy is filled with uncertainty, they pause and wait for the smoke to clear. The longer the trade uncertainty between the U.S. and China persists, the more downward pressure there will be on global economic growth around the world.
Summary
It’s unclear how this situation between the U.S. and China will play out and how long it will be before there is a resolution. In times of uncertainty, investors need to be very aware of how these trends could potentially impact their investment portfolio and it may be the appropriate time to begin building some defensive positions if you have not done so already.
About Michael……...
Hi, I’m Michael Ruger. I’m the managing partner of Greenbush Financial Group and the creator of the nationally recognized Money Smart Board blog . I created the blog because there are a lot of events in life that require important financial decisions. The goal is to help our readers avoid big financial missteps, discover financial solutions that they were not aware of, and to optimize their financial future.

How Much Emergency Fund Should You Have And How To Get There
If you watched the nightly news during the latest government shutdown you would have seen stories about how people struggle when they aren’t getting a paycheck. Most Americans are not immune to having a set back at a job and it is a scary feeling to not know when the next paycheck will come. The emergency fund is what will help you bridge the

How Much Emergency Fund Should You Have And How To Get There
If you watched the nightly news during the latest government shutdown you would have seen stories about how people struggle when they aren’t getting a paycheck. Most Americans are not immune to having a set back at a job and it is a scary feeling to not know when the next paycheck will come. The emergency fund is what will help you bridge the gap in these hard times. This article should help determine how much emergency fund you should have and strategies on how you can get there.
We make a point of this in every financial plan we put together because of its importance. A lot of people will say their job is secure so they don’t need to worry about having an emergency fund. This may be true, nevertheless the emergency fund is not only for the most extreme circumstances but any unexpected expense. Anyone can have an unforeseen cost of $1,000 to $5,000 and most people would have to pay for this expense on a credit card that will accrue interest and take time to payoff.
Another common thought is, “I have disability insurance, so I don’t need an emergency fund”. Most disability insurance will not start until a 90-day elimination period has been met. This means you will be out of a check for that period but still have all the expenses you normally would.
Current Savings In The United States
“Smartasset” came out with a study in November 2018 that stated; of those Americans with savings accounts, the average savings account balance was $33,766.49. This seems like an amount that would be enough for most people to have in a “rainy day fund”. But that is the average. Super Savers with very large balances will skew this calculation so we use the median which more accurately reflects the state of most Americans. The median balance is only approximately $5,200 per “Smartasset”.
With a median balance of only $5,200, it doesn’t take much misfortune for that to be spent down to $0. At $5,200, it is safe to assume that most Americans are living paycheck to paycheck.
If your income only meets your normal expenses, you need to ask yourself the question “where am I coming up with the money for an unexpected cost?”. For a lot of people, it is a credit card, another type of loan, or dipping into their retirement assets. By taking care of the immediate need, you shift the burden to another part of your financial wellbeing.
Emergency Fund Calculator
There is no exact dollar amount but a consensus in the planning industry is between 4-6 months of living expenses. This is usually enough to cover expenses while you are searching for the next paycheck or to have other assistance kick in.
It is important for everyone to put together a budget. How do you know what 4-6 months of living expenses is if you don’t know what you spend? Putting together a budget takes time but you need to know where your money is going in order to make the adjustments necessary to save. If you are in a position that you don’t see your savings account increasing, or at least remaining the same, you are likely just meeting expenses with your current income.
Resource: EXPENSE PLANNER to help you focus on your spending.
I Know My Number, How Do I get There?
Determining the amount is the easy part, now it is getting there. The less likely option would be going to your boss asking, “I need to replenish my emergency fund, can you increase my pay?”. Winning the lottery would also be nice but not something you can count on.Changing spending habits is an extremely difficult thing to do. Especially if you don’t know what you’re spending money on. Once you have an accurate budget, you should take a hard look at it and make cuts to some of the discretionary items on the list. It will likely take a combination of savings strategies that will get you to an appropriate emergency fund level. Below is a list of some ideas;
Skip a vacation one year
Put any potential tax refund in savings
Put a bonus check into savings
Increase the amount of your paycheck that goes to savings when you get a raise
Side work
Don’t upgrade a phone every time your due
Downgrade a vehicle or use the vehicle longer once paid off
Reward Yourself
There is no doubt some pain will be felt if you are trying to save more and it also takes time. Set a goal and stick to it but work in some rewards to yourself. If you are making good progress after say 3 months, splurge on something to keep your sanity but won’t impact the main objective.
Where To Keep Your Emergency Fund?
This account is meant to be liquid and accessible. So locking it up in some sort of long term investment that may have penalties for early withdrawal would not be ideal. We typically suggest using an institution you are familiar with and putting it in a savings account that can earn some interest.
About Rob……...
Hi, I’m Rob Mangold. I’m the Chief Operating Officer at Greenbush Financial Group and a contributor to the Money Smart Board blog. We created the blog to provide strategies that will help our readers personally, professionally, and financially. Our blog is meant to be a resource. If there are questions that you need answered, please feel free to join in on the discussion or contact me directly.


Will There Be A Santa Claus Rally This Year?
Going back 120 years, December has traditionally been a very good month for the stock market. Within the last 120 years the S&P 500 has been positive in December 73% of the time. The Russell 2000, which is the index for small cap stocks, has been up 87% of the time in December. This boost in the final month of the year is known to traders as the

Going back 120 years, December has traditionally been a very good month for the stock market. Within the last 120 years the S&P 500 has been positive in December 73% of the time. The Russell 2000, which is the index for small cap stocks, has been up 87% of the time in December. This boost in the final month of the year is known to traders as the “Santa Claus Rally”. Should investors expect a Santa Claus rally in 2018 given the recent sell off in the markets? The answer may hinge on the results of the Federal Reserve Meeting on December 19th.
The Fed Decision
The fate of the Santa Claus rally may very well be in the hands of the Federal Reserve Committee this year. The Committee’s decision regarding the Fed Fund Rate could either cause the market to rally if the Fed decides to keep rates unchanged or it could push the markets lower if they decide to move forward with the anticipated quarter point rate hike. The Fed has a really tough decision to make this year. The goal of the Fed is to keep interest rates at a level that promotes full employment and a target inflation rate of 2%. In periods of economic expansion, it’s the Fed’s job to make sure the economy does not overheat which in turn could lead to prices of goods and services in the U.S. spiraling out of control.
Over the past few years, the U.S. economy has continued to expand and the Fed has been raising rates in quarter point increments. A very slow pace by historic standards. The Fed has already raised the Fed Funds Rate three times in 2018. What are the chances that the Fed raises rates again in December?
Solid Employment & Inflation In Check
The good news is there is not a lot of pressure for the Fed to raise rates in December. As of October, the unemployment rate sits at 3.7% and the employment data that we have seen throughout November has been strong. Historically, a strong job market usually results in higher wages for employees which is the main driver of inflation. So in the current economic environment, the Fed’s main focus is keeping inflation within its 2% target range. The Fed’s measuring stick for the rate of inflation is the Personal Consumption Expenditures Index. Otherwise known as the “PCE”.
There is a “Headline PCE” and a “Core PCE”. The Core PCE excludes prices for food and energy which is the Fed’s main barometer. Why does the Fed use Core PCE? Food and Energy prices can fluctuate significantly over short periods of time which can distort the results of the PCE index.
Below is a chart of both the Headline PCE and the Core PCE:
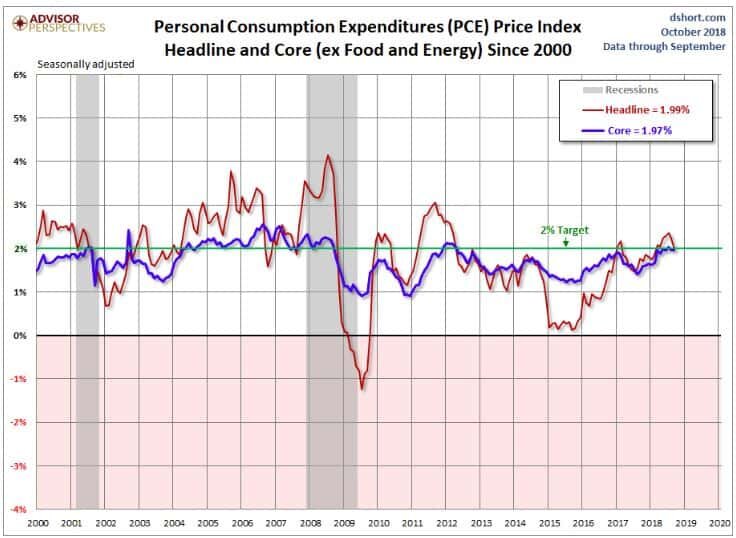
As you can see in the chart, the blue line that represents the Core PCE is right below the Fed’s 2% target. The PCE index is reported monthly and in October the PCE came in at a year-over-year change of 1.97%. Also you will see in the chart, due to the drop in the price of oil over the past two months, the Headline PCE is also dropping. While Headline PCE is not the Fed’s main measuring stick, there does seem to be a correlation between Headline PCE and Core PCE. It makes sense because regardless of the price of the product that you are taking a sample of, that product needs to be transported from the producer to the end user, and that transportation cost, which is largely influenced by the price of oil, will have an impact on the price of product within the Core PCE index.
This is good news for the stock market going into the December Fed meeting. With the Core PCE running just below the Fed’s target 2% rate and the Headline PCE declining, there is not a big push for the Fed to raise the Fed Funds Rate in December. I would even make the argument that raising the Fed Funds Rate in December would be a mistake.
The Fed & The Stock Market
The Fed is not a slave to the stock market. It’s not the Fed’s job to make sure the stock market continues to go up. Just because the stock market has experienced a large sell off over the past two months does not mean that the Fed will come to the market’s rescue and not raise rates. But remember, the Fed’s job is to keep the U.S. economy at full employment and keep inflation in check. Since inflation remains in check, it would seem that the prudent decision would be for the Fed to pause in December. If the Fed decides to raise rates in December, I have a difficult time understanding the catalyst for that decision.
Drivers Of The Recent Sell Off
It’s been a frustrating year for investors. Over the past 7 weeks, the U.S. large cap index, mid cap index, and small cap index have forfeited all of their gains for the year. International equity markets have been crushed this year. In a year like this, normally investors could turn to the bond portion of their portfolio for some support but that has not been the case this year either. The Barclays US Aggregate Bond index is down 2.38% year-to-date in 2018. It’s been a return drought this year with a double dose of volatility.
While the rapid rise in interest rates at the beginning of October may have triggered the market sell off, the downturn has been sustained by revisions to the forward guidance offered by corporations within their third quarter earnings report. While it has been another solid quarter of earnings for U.S. corporations, many of the companies that have been leading the bull market rally revised their forward earnings guidance down for the next few quarters. U.S. corporations seem to be embracing the uncertainty created by the trade wars and the tight labor market going into 2019.
It’s important to understand that as of today corporate earnings have not fallen short of expectations. As of November 14, 2018, 456 of the 500 companies in the S&P 500 had reported 3rd quarter earnings. 77.6% of those companies reported earnings above analyst expectations. This is above the long-term average of 64% and in line with the prior four quarter averaging of 77% exceeding expectations.
What really changed was the gross revenue numbers. Of those 456 companies that reported, 60.4% of those companies reported Q3 revenue above analyst expectations. That puts it in-line with the long-term average of 60% but below the average of the prior four quarters at 73%. While the U.S. economy continues to show strength, U.S. corporations have largely built an “earnings buffer” into their forecasts.
Economic Expansions Do Not Die Of Old Age
Everyone is on the lookout for the next recession. Each market sell off that we experience in this prolonged bull market rally makes investors question if they should run for hills. As one would expect, as you enter the later innings of an economic expansion the markets will begin to become more volatile. It’s easy for investors to hold their positions when the markets are going straight up with no volatility like 2017. It’s much more difficult to hold positions when it feels like you’re on a boat, in a storm, in the middle of an ocean. The temptation to try and jump in and out of the market in these volatile market conditions becomes much greater.
It’s very difficult to predict the future direction of the stock market using the recent fluctuations in the stock market as your barometer for future performance. If we look at many of the economic expansions in the past, we historically do not enter recession because the market calls it a day and just decides to go into a downward death spiral. In the past, there was typically a single event or a series of events that caused the economy to go from a period of expansion to a period of contraction. It’s for this reason that during these periods of heightened volatility that we rely heavily on the economic indicators that we track to determine how worried we should really be.
One of the main indicators that we track that I have shown you in previous updates is the Composite of Leading Indicators. It aggregates a number of forward looking economic and market indicators in an effort to provide a measurement of the health of the U.S. economy. See the chart below.
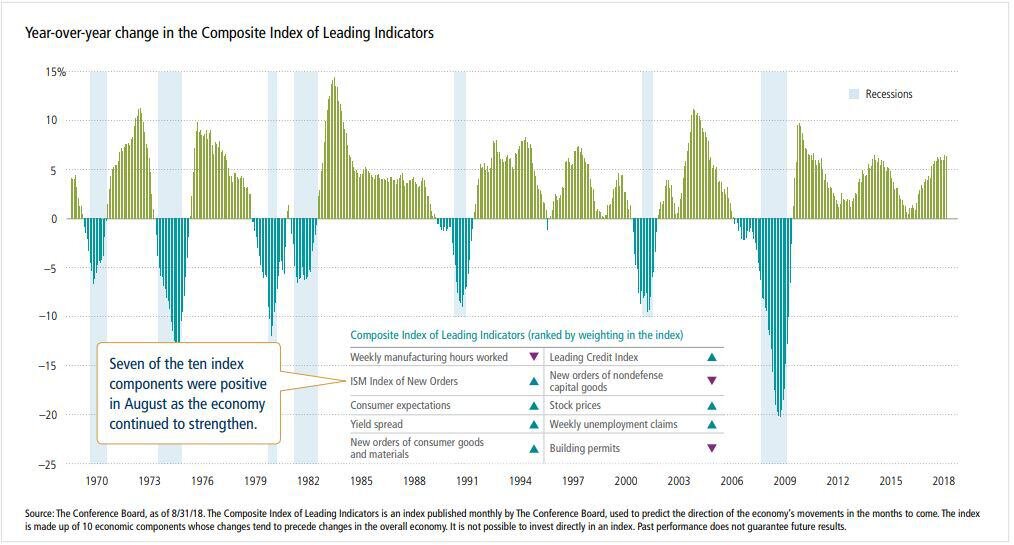
Each of the light blue areas shows when a recession took place going back to 1970. As you will see, in most cases this indicator turned negative before the economy entered a recession. If you look at what this indicator is telling us now, not only is the U.S. economy healthy, but over the past year it has strengthened. If you look at where we are now, there has never been a time since 1970 that this economic indicator has been at its current level, and a recession just shows up out of nowhere 12 months later.
Conclusion
We have no way of knowing what action the Fed will take on December 19th. However, given the tame level of inflation and the 3.7% unemployment rate, we would not be surprised if the Fed pauses at the December meeting which could lead to a health rally for the markets in December. Even if the Fed throws the market a curve ball and moves forward with the quarter point rate hike, while this move may seal the markets hopes of posting a positive return for the 2018 calendar year, the economy is still healthy, the probability of a recession within the next 12 months is still very low, and interest rates, although rising, are still at historically low levels. This economic environment may reward investors that have the discipline to make sound investment decision during these periods of heightened market volatility. The “easy years” are clearly behind us but that does not mean that the economic expansion is over. Have a safe and happy Thanksgiving everyone!!
About Michael……...
Hi, I’m Michael Ruger. I’m the managing partner of Greenbush Financial Group and the creator of the nationally recognized Money Smart Board blog . I created the blog because there are a lot of events in life that require important financial decisions. The goal is to help our readers avoid big financial missteps, discover financial solutions that they were not aware of, and to optimize their financial future.
Volatility, Market Timing, and Long-Term Investing
For many savers, the objective of a retirement account is to accumulate assets while you are working and use those assets to pay for your expenses during retirement. While you are in the accumulation phase, assets are usually invested and hopefully earn a sufficient rate of return to meet your retirement goal. For the majority,
Volatility, Market Timing, and Long-Term Investing
For many savers, the objective of a retirement account is to accumulate assets while you are working and use those assets to pay for your expenses during retirement. While you are in the accumulation phase, assets are usually invested and hopefully earn a sufficient rate of return to meet your retirement goal. For the majority, these accounts are long-term investments and there are certain investing ideas that should be taken into consideration when managing portfolios. This article will discuss volatility, market timing and their role in long-term retirement accounts.
“Market timing is the act of moving in and out of the market or switching between asset classes based on using predictive methods such as technical indicators or economic data” (Investopedia). In other words, trying to sell investments when they are near their highest and buy investments when they are near their lowest. It is difficult, some argue impossible, to time the market successfully enough to generate higher returns. Especially over longer periods. That being said, by reallocating portfolios and not experiencing the full loss during market downturns, investors could see higher returns. When managing portfolios over longer periods, this should be done without the emotion of day to day volatility but by analyzing greater economic trends.
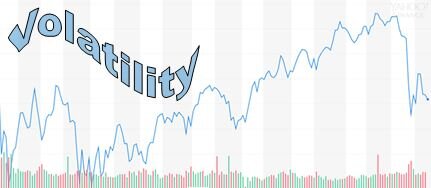
So far, the stock market in 2018 has been volatile; particularly when compared to 2017. Below are charts of the S&P 500 from 1/1/2018 – 10/21/2018 and the same period for 2017.
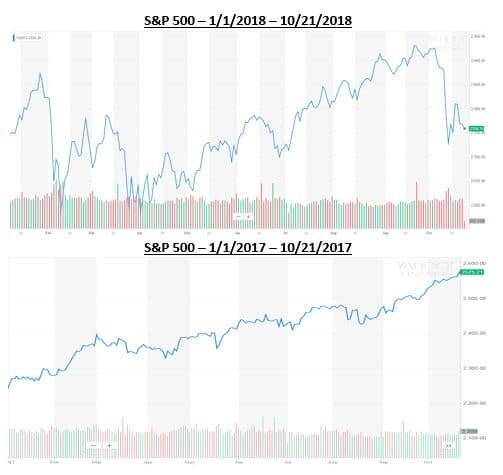
Source: Yahoo Finance. Information has been obtained from sources believed to be reliable and are subject to change without notification.
Based on the two charts above, one could conclude the majority of investors would prefer 2017 100% of the time. In reality, the market averages a correction of over 10% each year and there are years the market goes up and there are years the market goes down. Currently, the volatility in the market has a lot of investors on edge, but when comparing 2018 to the market historically, one could argue this year is more typical than a year like 2017 where the market had very little to no volatility.
Another note from the charts above are the red and green bars on the bottom of each year. The red represent down days in the market and the green represent up days. You can see that even though there is more volatility in 2018 compared to 2017 when the market just kept climbing, both years have a mixture of down days and up days.
A lot of investors become emotional when the market is volatile but even in the midst of volatility and downturns, there are days the market is up. The chart below shows what happens to long-term portfolio performance if investors miss the best days in the market during that period.
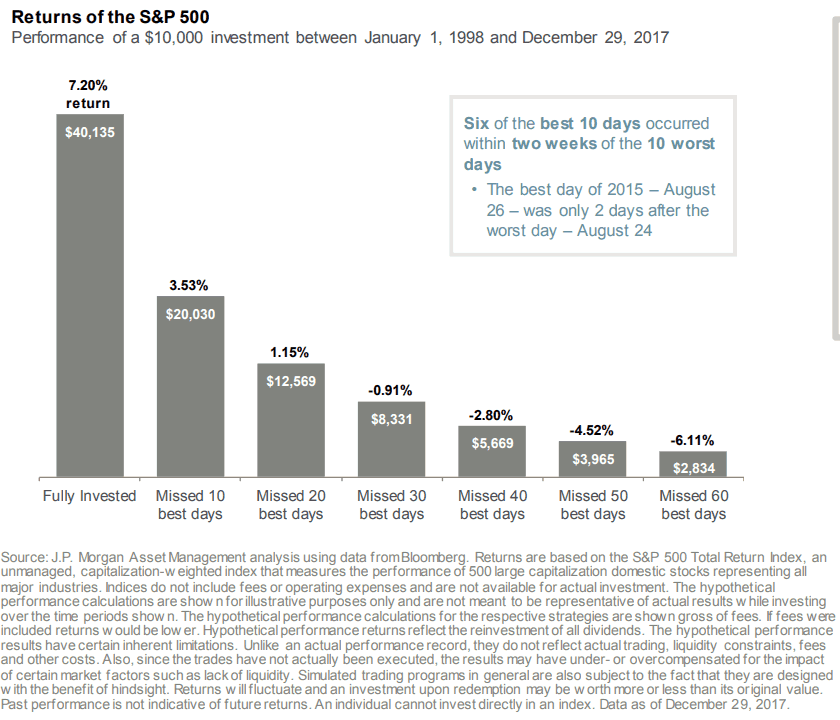
Source: JP Morgan. Information has been obtained from sources believed to be reliable and are subject to change without notification.
Two main takeaways from the illustration above are; 1) missing the best days over a period in the market could have a significant impact on a portfolios performance, and 2) some of the best days in the market over the period analyzed came shortly after the worst days. This means that if people reacted on the worst days and took their money from the market then they likely missed some of the best days.
Market timing is difficult over long periods of time and making drastic moves in asset allocation because of emotional reactions to volatility isn’t always the best strategy for long-term investing. Investors should align their portfolios taking both risk tolerance and time horizon into consideration and make sure the portfolio is updated as each of these change multiple times over longer periods.
When risk tolerance or time horizon do not change, most investors should focus on macro-economic trends rather than daily/weekly/monthly volatility of the market. Not experiencing the full weight of stock market declines could generate higher returns and if data shows the economy may be slowing, it could be a good time to take some “chips off the table”. That being said, looking at past down markets, some of the best days occur shortly after the worst days and staying invested enough to keep in line with your risk tolerance and time horizon could be the best strategy.
It is difficult to take the emotion out of investing when the money is meant to fund your future needs so speaking with your financial consultant to review your situation may be beneficial.
About Rob……...
Hi, I’m Rob Mangold. I’m the Chief Operating Officer at Greenbush Financial Group and a contributor to the Money Smart Board blog. We created the blog to provide strategies that will help our readers personally, professionally, and financially. Our blog is meant to be a resource. If there are questions that you need answered, please feel free to join in on the discussion or contact me directly.


Target Date Funds: A Public Service Announcement
Before getting into the main objective of this article, let me briefly explain a Target Date Fund. Investopedia defines a target date fund as “a fund offered by an investment company that seeks to grow assets over a specified period of time for a targeted goal”. The specified period of time is typically the period until the date you “target” for retirement

Target Date Funds: A Public Service Announcement
Before getting into the main objective of this article, let me briefly explain a Target Date Fund. Investopedia defines a target date fund as “a fund offered by an investment company that seeks to grow assets over a specified period of time for a targeted goal”. The specified period of time is typically the period until the date you “target” for retirement or to start withdrawing assets. For this article, I will refer to the target date as the “retirement date” because that is how Target Date Funds are typically used.
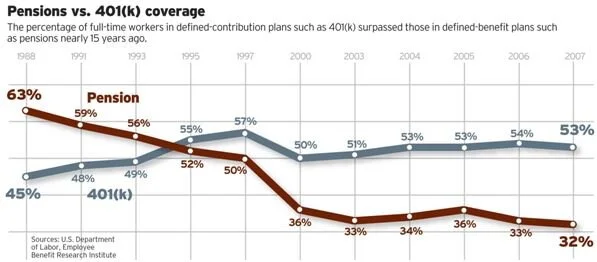
Target Date Funds are continuing to grow in popularity as Defined Contribution Plans (i.e. 401(k)’s) become the primary savings vehicle for retirement. Per the Investment Company Institute, as of March 31, 2018, there was $1.1 trillion invested in Target Date Mutual Funds. Defined Contribution Plans made up 67 percent of that total.
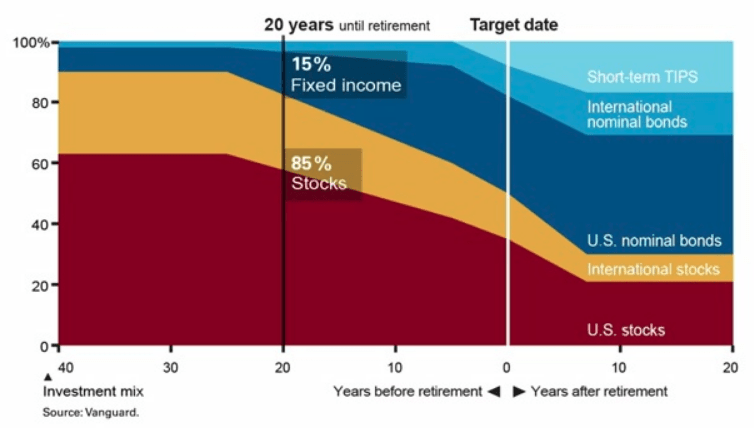
Target Date Funds are often coined as the “set it and forget it” of investments for participants in retirement plans. Target Date Funds that are farther from the retirement date will be invested more aggressively than target date funds closer to the retirement date. Below is a chart showing the “Glide Path” of the Vanguard Target Date Funds. The horizontal access shows how far someone is from retirement and the vertical access shows the percentage of stocks in the investment. In general, more stock means more aggressive. The “40” in the bottom left indicates someone that is 40 years from their retirement date. A common investment strategy in retirement accounts is to be more aggressive when you’re younger and become more conservative as you approach your retirement age. Following this strategy, someone with 40 years until retirement is more aggressive which is why at this point the Glide Path shows an allocation of approximately 90% stocks and 10% fixed income. When the fund is at “0”, this is the retirement date and the fund is more conservative with an allocation of approximately 50% stocks and 50% fixed income. Using a Target Date Fund, a person can become more conservative over time without manually making any changes.
Note: Not every fund family (i.e. Vanguard, American Funds, T. Rowe Price, etc.) has the same strategy on how they manage the investments inside the Target Date Funds, but each of them follows a Glide Path like the one shown below.
The Public Service Announcement
The public service announcement is to remind investors they should take both time horizon and risk tolerance into consideration when creating a portfolio for themselves. The Target Date Fund solution focuses on time horizon but how does it factor in risk tolerance?Target Date Funds combine time horizon and risk tolerance as if they are the same for each investor with the same amount of time before retirement. In other words, each person 30 years from retirement that is using the Target Date strategy as it was intended will have the same stock to bond allocation.This is one of the ways the Target Date Fund solution can fall short as it is likely not possible to truly know somebody’s risk tolerance without knowing them. In my experience, not every investor 30 years from retirement is comfortable with their biggest retirement asset being allocated to 90% stock. For various reasons, some people are more conservative, and the Target Date Fund solution may not be appropriate for their risk tolerance.The “set it and forget it” phrase is often used because Target Date Funds automatically become more conservative for investors as they approach their Target Date. This is a strategy that does work and is appropriate for a lot of investors which is why the strategy is continuing to increase in popularity. The takeaway from this article is to think about your risk tolerance and to be educated on the way Target Date Funds work as it is important to make sure both are in line with each other.For a more information on Target Date Funds please visit https://www.greenbushfinancial.com/target-date-funds-and-their-role-in-the-401k-space/
About Rob……...
Hi, I’m Rob Mangold. I’m the Chief Operating Officer at Greenbush Financial Group and a contributor to the Money Smart Board blog. We created the blog to provide strategies that will help our readers personally, professionally, and financially. Our blog is meant to be a resource. If there are questions that you need answered, please feel free to join in on the discussion or contact me directly.
Patience Should Reward Investors In 2018
Bottom line, the first half of 2018 was a tough pill to swallow for investors. They had to fight a constant rollercoaster. Volatility was high, returns were low, and the news was dominated with fears of trade wars. This environment has left investors questioning if we are on the eve of the next recession. Well I have good news. While trade wars have driven
Bottom line, the first half of 2018 was a tough pill to swallow for investors. They had to fight a constant rollercoaster. Volatility was high, returns were low, and the news was dominated with fears of trade wars. This environment has left investors questioning if we are on the eve of the next recession. Well I have good news. While trade wars have driven fear into the hearts of investors, during that same time period corporate earnings have been soaring and the U.S. economy has continued its growth path. For these reasons, disciplined investors may have good things waiting for them in the second half of 2018.
Coming Off A Big Year
As of the end of the second quarter, the S&P 500 Index was up 2.6% year to date. So why does 2018 seem like such a disappointment? You have to remember that 2017 was a huge year with the added benefit of very little volatility. It was a straight march up the entire year.
First, let’s compare the performance of the various asset classes in the first half of 2017 versus to first half of 2018. Below are the returns for the various assets classes in the first half of 2017:
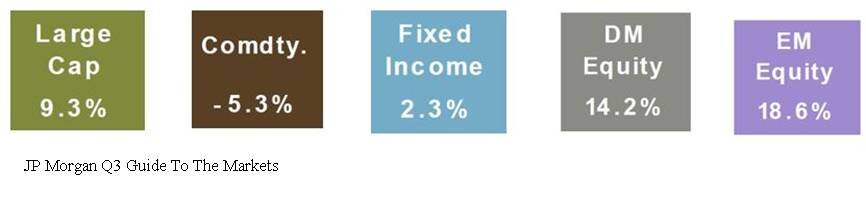
Here are those same asset classes in the first half of 2018.
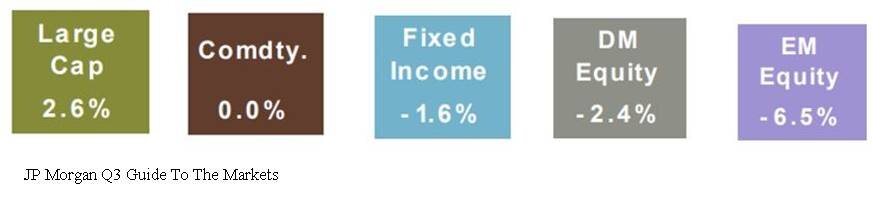
Obviously a huge difference. At this time last year, the S&P 500 Index was already up 9.3% for the year compared to 2.6% in 2018. International and emerging market equities were up over 14% in the first half of 2017. In 2018, those same international stocks were down over 2%. One might guess that bonds would preform better in a year with muted stock returns. Well, one would be wrong because the Barclay’s US Aggregate Bond Index was down 1.6% in the first 6 months of 2018.
Volatility Is Back
Not only has the first half of 2018 been a return drought but the level of volatility in the stock market has also spiked. In the first 6 months of 2017, the S&P 500 Index only had 2 trading days where the stock market moved plus or minus by more than 1% in a day. Guess how many trading days there were in the first half of 2018 where the S&P 500 Index moved up or down by more than 1% in a day.
The answer: 25 Days
That’s a 1,250% increase over 2017. No wonder everyone’s nerves are rattled. So the up 2% YTD in the stock market feels more like a down 10% because a lot has happened in a short period of time. Plus, the only big positive month for the stock market was in January which feels like forever ago.
Recency Bias
Investors are largely suffering for what we call in the investment industry as “recency bias”. In other words, what happened recently has now become the rule in the minds of investors. Investors are largely using 2017 as their measuring stick for 2018 performance and volatility. While it would seem that the dramatic increase in the level of volatility this year would classify 2018 as an abnormally volatile year, it’s actually 2017 that was the anomaly. Below is a chart that shows the annual return of the S&P 500 Index since 1980. The dots below each annual return are the market corrections that took place as some point during each calendar year.
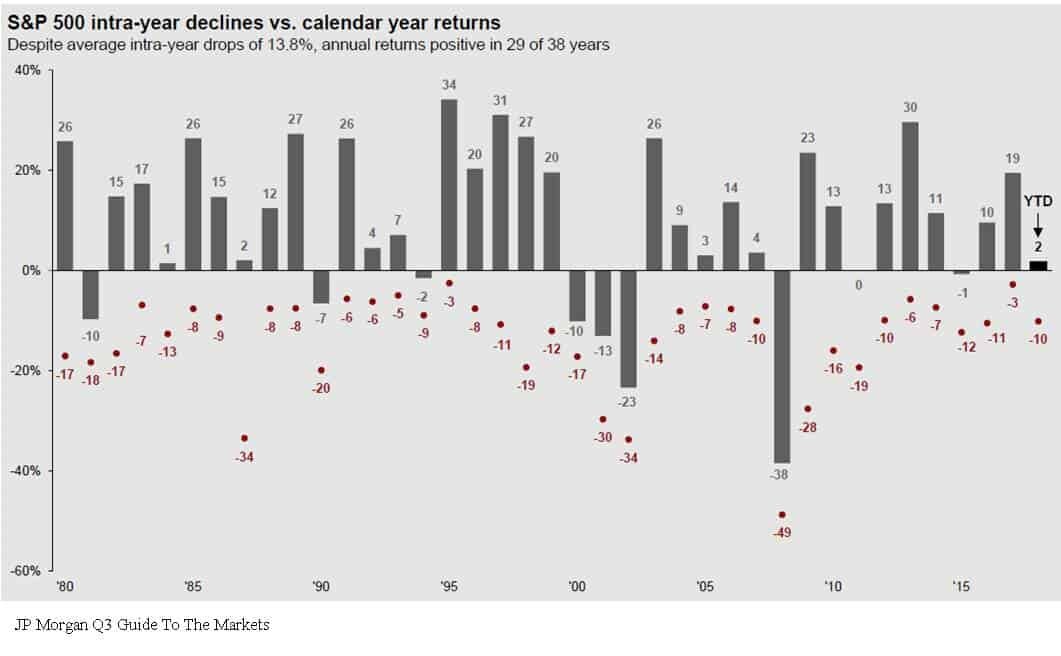
Based on historical data, it’s “normal” for the market to experience on average a 10% correction at some point during the year. Now look at 2017, the stock market was up 19% for the year but the largest correction during the year was 3%. That’s abnormal. By comparison, even though we are only half way through 2018, we have already experienced a 10% correction and as of June 30th, the S&P 500 Index is up 2% for the year.
Earnings Are King
Behind the dark clouds of the media headlines and the increased level of volatility this year is the dramatic increase in corporate earnings. Corporate earnings have not only increased but they have leaped forward. Take a look at the chart below:
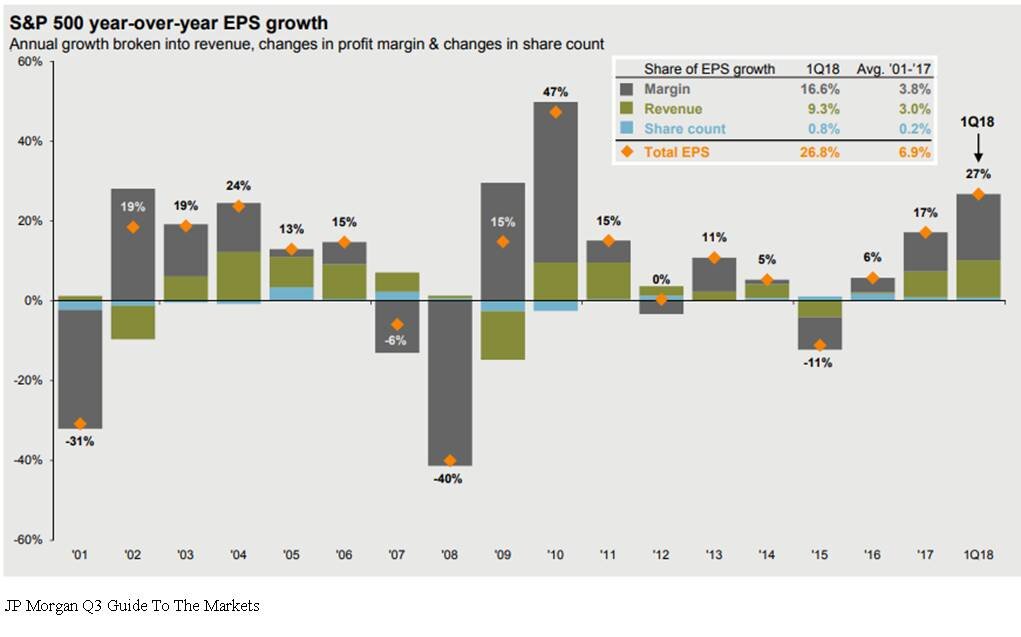
The market traditionally follows earnings. The earnings per share for the S&P 500 Index in 2017 was 17% which is a strong number historically. In the first quarterly of 2018, the year-over-year earnings per share growth was up 27%. That is a surge in corporate earnings. But you would have no idea looking at the meager 2% YTD return from the stock market this year. Pair that with the fact that the P/E of the S&P 500 is around 16 which is in line with its 20 year historic average. See the chart below:
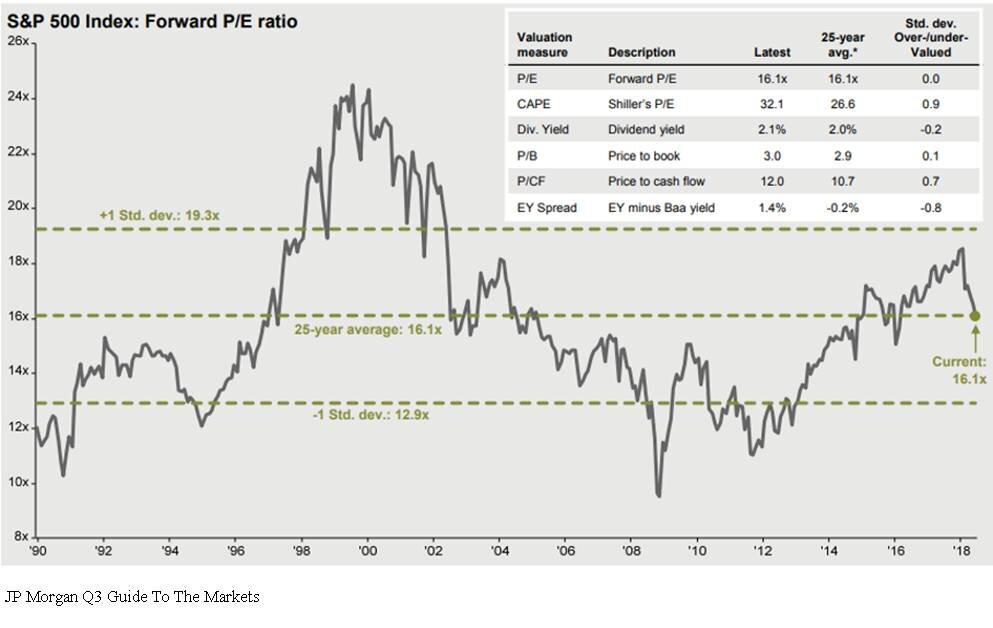
Even though it has been a long expansion, the market is not “over priced” by historic terms. If the stock market is fairly valued and corporate earnings are accelerating, one could make the case that the stock market has some catching up to do in the second half of the year.
The Chances Of A Recession Are Low
With the yield curve still positively sloped and the Composite Index of Leading Indicator, not only positive, but accelerating, a recession within the next 6 to 12 months seems unlikely. It’s like wandering through a jungle. When you are on the ground, the jungle is intimidating, there are plenty of things to be afraid of, and it’s tough to know which direction you should be walking. As investment advisors it’s our job to climb the tallest tree to get above the jungle to determine which way we should be walking.
In summary, 2018 has been an emotional roller coaster for investors. But making sound investment decision is about putting your emotions and gut feelings aside and looking at the hard economic data when making investment decisions. That data is telling us that we may very well be witnessing the soon to be longest economic expansion since 1900. The U.S. economy is strong, tax reform is boosting corporate earnings, interest rates are rising but are still at benign levels, and consumer sentiment is booming. In the later stages of an economic cycle, higher levels of volatility will be here to stay which will test the patience of investors. But overall the second half of the year could prove to be beneficial for investors that choose to climb the trees.
About Michael.........
Hi, I’m Michael Ruger. I’m the managing partner of Greenbush Financial Group and the creator of the nationally recognized Money Smart Board blog . I created the blog because there are a lot of events in life that require important financial decisions. The goal is to help our readers avoid big financial missteps, discover financial solutions that they were not aware of, and to optimize their financial future.
