

2023 Market Outlook: A New Problem Emerges
While the markets are still very focused on the battle with inflation, a new problem is going to emerge in 2023 that is going to take it’s place. The markets have experienced a relief rally in November and December but we expect the rally to fade quickly going into 2023.
While the markets are still very focused on the battle with inflation, a new problem is going to emerge in 2023 that is going to take its place. The markets have experienced a relief rally in November and December, but we expect the rally to fade quickly going into 2023.
Inflation Trend and Fed Policy
I’m writing this article on December 15, 2022, and this week, we received the inflation reading for November and the Fed’s 0.50% interest rate hike. Headline CPI, the primary measure of inflation, dropped from 7.7% in October to 7.1% in November which is a meaningful decline, most likely signaling that peak inflation is behind us. So why such a grim outlook for 2023? One word……History. If you look at the historical trends of meaningful economic indicators and compare them to what the data is telling us now, the message to us is it will be nothing short of a Christmas miracle for the U.S. economy to avoid a recession in 2023.
The Inflation Battle Will Begin at 5%
While it's encouraging to see the inflation rate dropping, the true battle will begin once the year-over-year inflation rate measured by headline CPI reaches the 5% - 6% range. Inflation most likely peaked in June 2022 at 9% and dropped to 7.1% in November, but remember, the Fed’s target range for inflation is 2% - 3%, so we still have at least another 4% to go.
RECESSION RISK #1: If you look back through U.S. history, the Fed has never successfully reduced the inflation rate by more than 2% WITHOUT causing a recession. We have already dropped by 2%, and we still have another 4% to go.
I expect the next 3 months to show meaningful drops in the inflation rate and would not be surprised if we are in a 5% - 6% range by March or April, largely because supply chains have healed, the economy is slowing, the price of oil has come down substantially, and the job market is beginning to soften. But once we get down to the 5% - 6% range, we could see slow progress, which could end the party for investors that are stilling in the bull rally camp.
The Wage Growth Battle
We expect progress to be halted because of the shortage of supply of workers in the labor force, which will keep wages persistently higher, allowing the US consumer to keep paying higher prices for goods and services, which will leave us with higher interest rates for longer. Every time Powell has spoken over the past few months (the head of the Federal Reserve), he expresses his concerns that wages remain far too high. The solution is simple but ugly. The Fed needs to continue to apply pressure on the economy until the unemployment rate begins to rise which will bring wage growth level down to a level that will allow them to reach their 2% - 3% target inflation range.
Companies Are Reluctant To Let Go of Employees
Since one of the major issues plaguing US businesses is trying to find employees, companies will be more reluctant to let go of employee with the fear that they will need them once the economy begins to recover. This situation could create an abrupt spike and the unemployment rate when companies are finally forced to give in all at once to the reality that they will need to shed employees due to the slowing economy.
Rising Unemployment
Another lesson from history, if you look back at the past 9 recessions, how many times did the stock market bottom BEFORE the recession began? Answer: ZERO. So, if you think the bottom is already in the stock market but you also believe that there is a high probability that the U.S. economy will enter a recession in 2023, you are on the wrong side of history.
When we look back at the past 9 recessions, there is a common trend. As you would expect, when the economy begins to contract, people lose their jobs, which causes the unemployment rate to rise. In all of the past 9 recessions, the stock market did not bottom until AFTER the unemployment rate began to rise. If you think there is a high probability that the unemployment rate will rise in 2023, which is what the Fed is targeting to bring down wage growth, then we most likely have not seen the market bottom in this bear market cycle.
JP Morgan has a great chart summarizing this point across the past 9 recessions. While it looks like a lot is going on in this illustration, each chart shows one of the past 9 recessions.
The Purple Line = Unemployment Rate
The Black Straight Line = Where the stock market bottomed
The Gray Area = The recession
In each of the charts below, observe how the purple line begin to rise and then the solid black line follows in each chart. That would support the trend that the bottom in the stock market historically happens after the unemployment rate begin it’s climb which has not happened yet.

A New Problem Will Emerge
While the markets have been super focused on inflation in 2022, a new problem is going to surface in 2023. The economy is going to trade its inflation problem for the reality of a weakening U.S. consumer.
The Fed will be successful at slowing down the economy via their rate hikes, which will eventually lead to job losses, weakness in the housing market, a slowdown in consumer spending on goods and travel, and less capital spending. Those forces should be enough to deliver the two quarters of negative GDP growth in 2023, which would coincide with a recession.
The Fed Will Have Its Hands Tied
Normally, when the economy begins to contract, the Fed will step in and begin lowering interest rates to restart economic growth. However, if the inflation rate, while moving lower, is still between 4% and 5% when the economic slowdown hits, the Fed will not be able to come to the economy’s aid with fear that premature reductions in the fed funds rate could reignite inflation which is exactly what happened in the 1970s.
The recession itself will eventually bring inflation down to the Feds 2% inflation target, but while it’s happening, it’s going to feel like you are watching a train wreck in slow motion, but you can’t do anything about it. Not a great environment for the stock market.
Length of the recession
The next question I receive is, do we expect a mild recession or severe recession? I’ll be completely honest, it’s impossible to know. A lot will depend on the timing of when the economy begins to contract and where the rate of inflation is. The longer it takes inflation to get down to the 2% range while the economy contracts, the longer and more severe the recession will be. This absolutely could end up being a mild recession but there’s no way to know that sitting here in December 2022, looking at all of the challenges that lie ahead for the markets in 2023.
An Opportunity For Bonds
Due to the rising interest rates in 2022, the bond market has had one of the worst years in history. Below is a chart showing the annual returns of the aggregate bond index going back to 1970.

We have never seen a year where bonds are down 11% in a single year. It’s our expectation that this trend will reverse course in 2023. When interest rates stop rising, the Fed pauses and eventually begins lowering rates, that should be a positive environment for fixed-income returns. Where bonds failed to give investors any type of safety net in 2022, I think that safety net will return in 2023. We are already beginning to see evidence of interest rates moving lower, with the 10-year US Treasury yields moving from 4.2% down to the current rate of 3.5% over the past 45 days.
Warnings From The Inverted Yield Curve
While a number of the economic indicators that we watching are flashing red going into 2023, there are very few that tell the story better than the inverted yield curve. Without getting into all the technical details about what an inverted yield curve is, the simple version of this explanation is, it's basically the bond market telling the stock market that trouble is on the horizon. Historically, when the yield curve inverts, The US economy enters a recession within the next 6 to 18 months. See below, a chart of the yield curve going back to 1970.
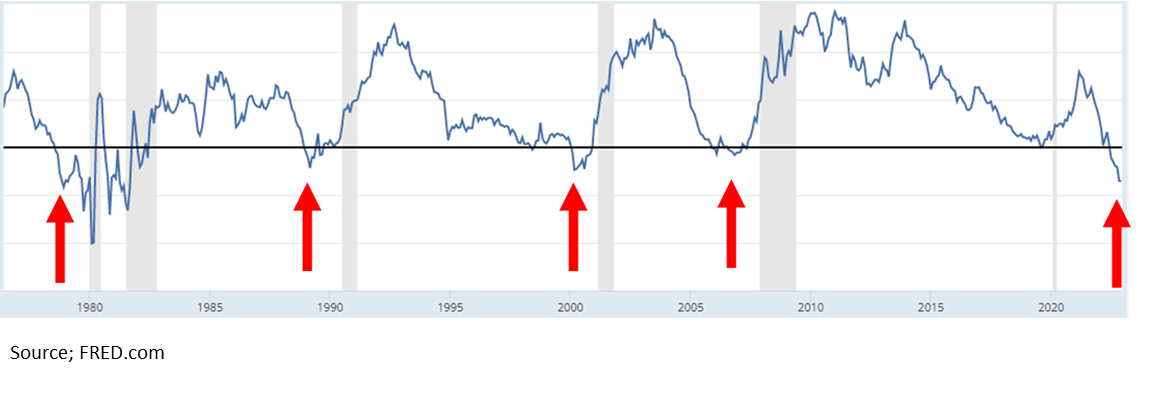
Each of the red arrows is where the yield curve inverts. The gray areas on the chart are the recessions. You can see very quickly how consistent the yield curve inversion has been at predicting recessions over time. If you look on the far right-hand side of the chart, that red arrow is where we are now, heavily inverted. So if you believe that we are not going to get a recession within the next 6 to 18 months, you are sitting heavily on the wrong side of history and have adopted a “this time it's different” mentality which can be dangerous. History tends to repeat itself more times than people like to admit.
Proactive investment decisions
Going into 2023, I think it's very important to be realistic about your expectations for the equity markets, given the headwinds that we face. This market environment is going to require very proactive investment decisions and constant monitoring of the economic data as we receive it throughout the year. A mild recession is entirely possible. If we end up in a mild recession, inflation drops down into the Feds comfort range due to the contracting economy, and the Fed can begin lowering rates before the end of 2023, that could put a bottom in the stock market, and the next bull market rally could emerge. But it's just too early to know that sitting here in December 2022 with a lot of headwinds facing the market.

About Michael……...
Hi, I’m Michael Ruger. I’m the managing partner of Greenbush Financial Group and the creator of the nationally recognized Money Smart Board blog . I created the blog because there are a lot of events in life that require important financial decisions. The goal is to help our readers avoid big financial missteps, discover financial solutions that they were not aware of, and to optimize their financial future.


This Market Rally Could Be A Bear Trap!! Here’s why……
The recent stock market rally could end up being a bear market trap for investors. If it is, this would be the 4th bear market trap of 2022.

After a really tough first 6 months of the year, the stock market has been in rally mode, rising over 9% within the last 30 days. It’s left investors anxious to participate in the rally to recapture the losses that were incurred in the first half of the year. Our guidance to clients, while there are plenty of bobbing heads on TV talking about “buying the dip” and trying to call the “bottom” in the market, this could very well be what we call a “bear trap”. A bear trap is a short-term rally that baits investors into thinking the market has bottomed only to find out that they fell for the trap, and experience big losses when the market retreats to new lows.
The 4th Bear Trap In 2022
If the current rally ends up being a bear trap, it would actually be the 4th bear trap so far in 2022.

The green boxes in the chart show when the rallies occurred and the magnitude. Notice how the market moved to a new lower level after each rally, this is a common pattern when you are in a prolonged bear market environment.
So how do you know when the bear market is over and the new sustainable bull market rally has begun? It’s actually pretty simple. Ask yourself, what were the issues that drove the market lower in the first place? Next question, “Is the economy making MEANINGFUL progress to resolve those issues?” If the answer is yes, you may in fact be at the beginning of the rally off of the bottom; if the answer is no, you should resist the temptation to begin loading up on risk assets.
It's Not A Secret
It’s not a secret to anyone that inflation is the main issue plaguing not just the U.S. economy but economies around the world. Everyone is trying to call the “peak” but we did a whole video on why the peak doesn’t matter.
The market cheered the July inflation report showing that headline year over year inflation dropped from 9.1% in June to 8.5% in July. While progress is always a good thing, if the inflation rate keeps dropping by only 0.60% per month, we are going to be in a lot of trouble heading into 2023. Why? As long as the inflation rate (the amount prices are going up) is higher than the wage growth rate (how much more people are making), it will continue to eat away at consumer spending which is the bedrock of the U.S. economy. As of July, wages are growing at only 6.2% year over year. That’s still a big gap until we get to that safety zone.
Understand The Math Behind The CPI Data
While it’s great that the CPI (Consumer Price Index) is dropping, the main CPI number that hits the headlines is the year-over-year change, comparing where prices were 12 months ago to the prices on those same goods today. Let me explain why that is an issue as we look at the CPI data going forward. If I told you I will sell you my coffee mug today for $100, you would say “No way, that’s too expensive.” But a year from now I try and sell you that same coffee mug for $102 and I tell you that the cost of this mug has only risen by 2% over the past year, does that make you more likely to buy it? No, it doesn’t because the price was already too high to begin with.
In August 2021, inflation was already heating up. The CPI headline number for August 2021 was 5.4%, already running above the Fed’s comfort level of 3%. Similar to the example I just gave you above with the coffee mug, if the price of everything was ALREADY at elevated levels a year ago, and it went up another 8.5% on top of that elevated level, why is the market celebrating?
Probability of A 2023 Recession
Even though no single source of data is an accurate predicator as to whether or not we will end up in a recession in 2023, the chart that I am about to show you is being weighted heavily in the investment decisions that we are making for our clients.
Historically an “inverted” yield curve has been a fairly accurate predicator of a coming recession. Without going into all of the details of what causes a yield curve inversion, in its simplest form, it’s the bond market basically telling the stock market that a recession could be on the horizon. The chart below shows all of the yield curve inversions going back to 1970. The red arrows are where the inversion happened and the gray shaded areas are where recession occurred.

Look at where we are right now on the far right-hand side of the chart. There is no question that the yield curve is currently inverted and not just by a little bit. There are two main takeaways from this chart, first, there has been a yield curve inversion prior to every recession going back to 1970, an accurate data point. Second, there is typically a 6 – 18 month delay between the time the yield curve inverts and when the recession actually begins.
Playing The Gap
I want to build off of that last point about the yield curve. Investors will sometimes ask, “if there is historically a 6 – 18 month delay between the inversion and the recession, why would you not take advantage of the market rally and then go to cash before the recession hits?” My answer, if someone could accurately do that on a consistent basis, I would be out of a job, because they would manage all of the money in the world.
Recession Lessons
I have been in the investment industry since 2002. I experienced the end of the tech bubble bust, the Great Recession of 2008/2009, Eurozone Crisis, and 2020 COVID recession. I have learned a number of valuable lessons with regard to managing money prior to and during those recessions that I’m going to share with you now:
It’s very very difficult to time the market. By the time most investors realize we are on the verge of a recession, the market losses have already piled up.
Something typically breaks during the recession that no one expects. For example, in the 2008 Housing Crisis, on the surface it was just an issue with inflated housing prices, but it manifested into a leverage issue that almost took down our entire financial system. The questions becomes if we end up in a recession in 2023, will something break that is not on the surface?
Do not underestimate the power of monetary and fiscal policy.
The Power of Monetary & Fiscal Policy
I want to spend some time elaborating on that third lesson. The Fed is in control of monetary policy which allows them to use interest rates and bond activity to either speed up or slow down the growth rate of the economy. The Fed’s primary tool is the Fed Funds Rate, when they want to stimulate the economy, they lower rates, and when they want to slow the economy down (like they are now), they raise rates.
Fiscal policy uses tax policy to either stimulate or slow down the economy. Similar to what happened during COVID, the government authorized stimulus payments, enhanced tax credits, and created new programs like the PPP to help the economy begin growing again.
Many investors severely underestimate the power of monetary and fiscal stimulus. COVID was a perfect example. The whole world economy came to a standstill for the first time in history, but the Fed stepped in, lowered rates to zero, injected liquidity into the system via bond purchases, and Congress injected close to $7 Trillion dollars in the U.S. economy via all of the stimulus policies. Even though the stock market dropped by 34% within two months at the onset of the COVID crisis in 2020, the S&P 500 ended up posting a return of 16% in 2020.
Now those same powerful forces that allowed the market to rally against unsurmountable odds are now working against the economy. The Fed is raising rates and decreasing liquidity assistance. Since the Fed has control over short term interest rates but not long-term rates, that is what causes the yield curve inversion. Every time the Fed hikes interest rates, it takes time for the impact of those rate hikes to make their way through the economy. Some economists estimate that the delay between the rate hike and the full impact on the economy is 6 – 12 months.
The Fed Is Raising More Aggressively
The Fed right now is not just raising interest rates but raising them at a pace and magnitude that is greater than anything we have seen since the 1970’s. A chart below shows historical data of the Fed Fund Rate going back to 2000.

Look at 2004 and 2016, it looks like a staircase. Historically the Fed has raised rates in small steps of 0.25% - 0.50%. This gives the economy the time that it needs to digest the rate hikes. If you look at where we are now in 2022, the line shoots up like a rocket because they have been raising rates in 0.75% increments and another hike of 0.50% - 0.75% is expected at the next Fed meeting in September. When the Fed hikes rates bigger and faster than it ever has in recent history, it increases the chances that something could “break” unexpectedly 6 to 12 months from now.
Don’t Fight The Fed
You will frequently hear the phrase “Don’t Fight The Fed”. When you look back at history, when the Fed is lowering interest rates in an effort to jump start the economy, it usually works. Conversely, when the Fed is raising rates to slow down the economy to fight inflation, it usually works but it’s a double edged sword. While they may successfully slow down inflation, to do so, they have to slow down the economy, which is traditionally not great news for the stock market.
I have to credit Rob Mangold in our office with this next data point that was eye opening to me, when you look back in history, the Fed has NEVER been able to reduce the inflation rate by more than 2% without causing a recession. Reminder, the inflation rate is at 8.5% right now and they are trying to get the year over year inflation rate back down to the 2% - 3% range. That’s a reduction of a lot more than 2%.
Stimulus Packages Don’t Work
In the 1970’s, when we had hyperinflation, the government made the error of issuing stimulus payments and subsidies to taxpayers to help them pay the higher prices. They discovered very quickly that it was a grave mistake. If there is inflation and the people have more money to spend, it allows them to keep paying those higher prices which creates MORE inflation. That is why in the late 70’s and early 80’s, interest rates rose well above 10%, and it was a horrible decade for the stock market.
In the U.S. we have become accustomed to recessions that are painful but short. The COVID Recession and 2008/2009 Housing Crisis were both painful but short because the government stepped in, lowered interest rates, printed a bunch of money, and got the economy growing again. However, when inflation is the root cause of our pain, unless the government repeats their mistakes from the 1970’s, there is very little the government can do to help until the economy has contracted by enough to curb inflation.
Is This The Anomaly?
Investors have to be very careful over the next 12 months. If by some chance, the economy is able to escape a recession in 2023, based on the historical data, that would be an “anomaly” as opposed to the rule. Over my 20 year career in the industry, I have heard the phrase “well this time it’s different because of X, Y, and Z” but I have found that it rarely is. Invest wisely.
About Michael……...
Hi, I’m Michael Ruger. I’m the managing partner of Greenbush Financial Group and the creator of the nationally recognized Money Smart Board blog . I created the blog because there are a lot of events in life that require important financial decisions. The goal is to help our readers avoid big financial missteps, discover financial solutions that they were not aware of, and to optimize their financial future.

Is Inflation Peaking? That’s The Wrong Question…….
While a lot of investors are asking if inflation has peaked, there is a more importnat question they should be asking which will have a bigger impact on our path forward…….

As I write this article on May 11, 2022, the inflation number was just released for April indicating an 8.3% increase in the Consumer Price Index (CPI) which is the primary measure of the inflation rate. The news and market analysts seem to be consumed with the question “has inflation peaked?” Since the April CPI reading was below the March CPI of 8.5%, the answer may very well be “yes”, but I think there is a more important question that analysts and investors should be paying attention to and I would argue that the answer to this question will be more meaningful to the markets. Here it is, looking at all of the drivers of inflation right now, how does the inflation rate get back down to a level that will help the U.S. economy to avoid a recession?
Claiming victory that inflation has peaked could be a very short celebration if the level of inflation REMAINS at an elevated level for longer than the market and the Fed expects.
The Inflation Problem Has Become More Complex
At the end of 2021, it seemed to be the consensus that the primary driver of higher inflation was due to supply chain constraints in a post COVID world. The solution to that problem seemed fairly simple, as the global supply chain heals, there will be more goods to buy, and prices will gradually come down throughout 2022; but that has changed now. It’s not just supply chain issues that are driving inflation any longer, we now have:
Global supply chain issues
Russian / Ukraine conflict
Oil still over $100 per barrel
Tight labor markets
Wage growth
Strong corporate earnings but weaker forecasts
Fed policy
I would also argue that some of the inflation catalysts listed above will have a more significant impact on the rate of inflation than just the COVID supply constraints. In this article I’m going to walk you through the trends that we are seeing in each of these inflation catalysts and how they could impact inflation going forward. We do not believe that the market is doomed to enter a recession at this point but with so many more forces driving inflation higher, monitoring what really matters to the longer term inflation trend should be foremost in the mind of investors as the war against inflation enters the second half of the 2022.
Russia / Ukraine Conflict
Russia’s continued assault on Ukraine has caused a number of supply chain disruptions in itself but none more impactful to the U.S. than the price of oil. The price of oil has been over $100 per barrel for months which is huge driver of inflation since goods need to be transported on planes, ships, trucks, and trains. Oil companies are not in a rush to produce more because they are enjoying lofty profits and they realize that the price of oil could come down quickly if the violence ends in Ukraine. This is why they are hesitant to spend a lot of money to bring more production online because the price of oil could drop down to $80 or below within the next few months. Could oil go higher from here? It could. The Chinese economy has recently been hampered by COVID outbreaks so demand for oil has eased within the last month, but if this changes you could see the price of oil hit new highs on increased demand from China and we are about to enter the summer travel season in the U.S. If oil prices stay above $100 per barrel throughout the summer, it may keep inflation at elevated levels for longer than anticipated.
The Price of Oil
We just went through what’s driving the price of oil higher but if the price of oil drops within the next few months it’s not an automatic victory. If the price of oil is dropping because there is more supply coming online or because there is peace in Ukraine that is excellent, that should reduce inflationary pressures. However, if the price of oil is decreasing because demand is beginning to soften because the consumer is beginning to buy less, that’s not a positive indicator.
More Jobs Than Workers
Currently there are 5.9 million unemployed people in the U.S., and as of March there are 11.5M job openings which puts us at 2 job openings for every 1 person looking for work. If you look at the chart below of the total job openings, it’s easy to see that we are in uncharted territory here:
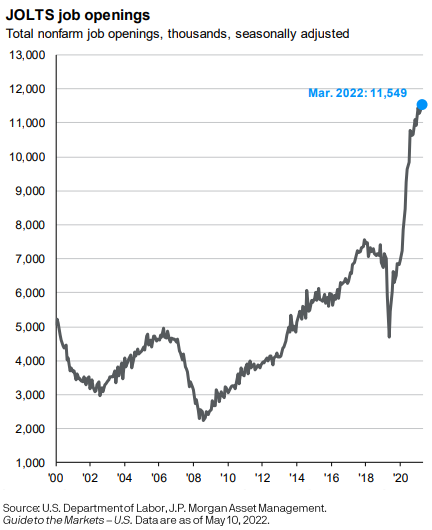
So, when you have more jobs than people looking for work, what do you think is going to happen to wages? They are going to go up. When you look back in history, one of the largest drivers of big inflationary periods is wage growth. Think about it this way, if the government hands you a stimulus check, you will be able to buy more stuff or pay higher prices for goods and services than you normally would, but this is temporary. Once you have spent that government stimulus money, you can no longer afford to pay higher prices.
If you change jobs, and you receive a $30,000 raise, now you can pay higher prices, not just this year but next year, and the year after that. Wage growth creates “sticky inflation”. It doesn’t just go away when the supply chain recovers or when oil prices retreat. As of April, wage growth has risen 6.4% over the past year, and the last time we saw wage growth over 6% was the 1970’s which not so coincidentally was a period of prolonged hyperinflation.
The only way I can foresee wage growth decreasing is a slow down in the economy which raises the risk of a recession. It’s simple supply and demand. If you have more jobs than people to fill them, companies will have to pay hire wages to attract and keep employees, the companies will most likely pass those higher costs onto the consumer in the form of higher prices, eventually the consumer can no longer afford those higher prices, the economy slows down, and then those excess jobs are eliminated. Not a fun storyline.
Subtle Warning Signs In Corporate Earnings
The tone from the Fed at the beginning of 2022 was that they will be raising rates to slow down inflation, but the economy is strong enough to withstand the rate hikes and we should be able to avoid a recession. The U.S. economy is driven primarily by consumer spending, and the consumer definitely showed up to spend in the first quarter of 2022. However, while many of the companies in the S&P 500 Index exceeded earning expectations, a number of them softened their outlook for the remainder of 2022 due to rising input costs and the impact of higher prices on consumer spending. Knowing that the stock market and bond market are forward looking animals, even though inflation has not taken a huge toll on corporate earnings yet, clouds are beginning to form which investors should pay close attention to.
Tech Stocks Getting Hit
As of May 9th, the S&P 500 Index is down 16% but the Nasdaq is down 26%. When inflation shows up, valuations begin to matter over a company’s growth story because cash becomes king. Here is how I explain it, if inflation is going up at 8% per year, if I ask you if you want me to give you $1 today or $1 a year from now, you would choose $1 today because a year from now, that dollar would have less purchasing power, because inflation is causing the price of everything to go up. It works the same way with stock prices.
The market uses P/E Ratios to determine how expensive stock is which is simply a company’s stock price divided by its earnings per share. If a company’s stock price is $100 and they are expected to earn $100 in profit for each share of stock, the P/E ratio would be 1. But it’s common for stocks to trade at 10, 15, or even 30 times one year of forward earnings. The higher the PE ratio, the more assumed future growth is built into the price of that stock. Some growth companies have very little in terms of net profit because they are spending a lot of money to make their big growth dreams come to life. These growth stocks can sometimes trade at a PE of 50, 100, or higher!!
When inflation hits and investors realize a dollar today is more valuable than a dollar tomorrow, they have to begin to discount those future returns that are built into stock prices. A stock that is trading at 50 times their one year earnings will typically have to drop in price a lot more than a stock that is only trading at 10 times it’s future one year earnings because you have to discount 50 years of earnings instead of 10.
Fed Policy
The last variable in the inflation equation is Fed policy. The Fed has a really tough job right now, reduce inflation without pushing the economy into a recession. When it was just supply chain issues, I think the market had it right by describing it as “the Fed is trying to engineer a soft landing”. With new inflationary forces now entering the equation, I would describe the Feds task as “threading a needle while the needle is moving”.
At the May meeting, the Fed announced, as expected, a 0.50% increase to the Fed funds rate, but during that meeting they also dismissed that a future 0.75% rate hike was on the table. The markets cheered and rose significantly that day hearing that a 0.75% hike was unlikely but then the next day the market lost all of those gains, and continues to add to the losses - worried that the Fed was not raising rates fast enough to keep higher inflation at bay.
It's All About Inflation
While a lot of attention is being given to the Fed and what the Fed might do next, the focus has to come back to not just stopping inflation from going higher but how do they get inflation to decrease fast enough before it derails the consumer. I highlight all of these inflation variables because you could get good news on supply chain improvements and corporate earnings but if oil remains above $100 per barrel and wage growth is still 6%+, it difficult to picture how the year over year change in the inflation rate gets below 4% or 5% before the end of the year.
The consumer is everything. If the consumer has higher wages and the cash reserves to withstand the higher prices while the Fed is working to bring inflation down, it is possible that we could see a rally in the second half of the year. But the long inflation persists, the less likely that relief rally scenario becomes.
This Time It’s Different
I urge all investors to be careful here. In the investment world you will sometimes hear the phase “this time it’s different” or “we have never been here before” which can add additional stress and anxiety to a market environment that is already scary. I urge caution here because in 2022 there has been a trend that is very different. In most market downturns, when stocks go down, bonds will typically be up, which is one of the benefits of a properly diversified portfolio. When you compare historical returns of the S&P 500 Index versus the Aggregate Bond Index, you will see this pattern:
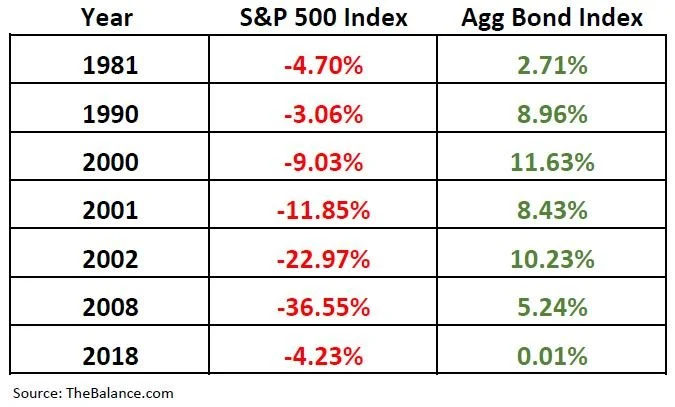
Unfortunately, as of May 9, 2022, stocks and bonds are both down a significant amount year-to -date:

It feels like we are getting close to a fork in the road. Either we will begin to see meaningful improvement in the inflation rate over the next few months setting both the stock and bond market on a path to recovery in the second half of 2022, or despite the Fed’s best efforts, regardless of whether or not we have seen a peak in inflation, if inflation does not come down a meaningful amount by the fall, the U.S. economy may slip into a mild recession in 2023. Until we know, investors will have to pay very close attention to these monthly indicators that are driving the inflation rate.
About Michael……...
Hi, I’m Michael Ruger. I’m the managing partner of Greenbush Financial Group and the creator of the nationally recognized Money Smart Board blog . I created the blog because there are a lot of events in life that require important financial decisions. The goal is to help our readers avoid big financial missteps, discover financial solutions that they were not aware of, and to optimize their financial future.
