

2024 Market Outlook: Investors Are In For A Few Surprises
Investors have to be ready for many surprises in 2024. While the US economy was able to escape a recession in 2023, if anything, it has increased the chances of either a recession or a market pullback in the first half of 2024.
Investors have to be ready for many surprises in 2024. While the US economy was able to escape a recession in 2023, if anything, it has increased the chances of either a recession or a market pullback in the first half of 2024. While many investors remember how bad the Great Recession was back in 2008 and 2009, very few remember what the market conditions were like prior to the recession beginning. As an investment firm, we archive a lot of that data, so we reference it at any time to determine where the market may be headed today, and the historical data is alarming.
Rewind the clock to January 2008
In January 2008, the US economy was already in a recession, but it had not officially been declared yet that's because a recession, by textbook definition, is two consecutive quarters of negative GDP, but you don't get the quarterly GDP readings until after each calendar quarter end, so while the recession in the US officially began December 2007, investors didn't realize recession had been declared until mid-way through 2008. So what were the forecasts for the S&P 500 in January 2008?
The broker-dealer that we were with at the time was forecasting in January 2008 that the S&P 500 Index would be up 16% in 2008. We now know that 2008 was the first year of the Great Recession, and the S&P 500 ended up posting a loss of 36% for the year. Many investors don't realize that historically, the consensus is very bad at predicting a coming recession because they failed to recognize the patterns in the economy and monetary policy that tend to be very good predictors of recessions. Investors are often more worried about missing out on the next 20% rally in the markets, which is why they get caught when the market begins its steep sell-off.
What were some of these economists looking at in January 2008 that made them so wrong? Towards the end of 2007, we had already begun to see the cracks within the US housing market, the economy had already started to slow, but in September 2007, the Federal Reserve began to lower interest rates which stock forecasters saw as a bullish signal that the monetary stimulus of lower interest rates would mean growth for the stock market in 2008. This echoes much of the same rhetoric that I heard in the fourth quarter of 2023 as the Fed decided to go on pause and then built in rate cuts to their 2024 forecast.
If you look back at history, there's a pattern between the US economy and the Fed funds rate, and it's fairly consistent over time. Here is a chart of the Fed funds rate going back to 1993. You will see the same pattern in the chart, The Fed raises rates to fight inflation, they pause (which is the tabletop portion at each of the mountain peaks), and then rates drop rapidly when the economy slows by too much, and the economy enters a recession. The Fed is historically very bad at delivering soft landings, which is a reduction in inflation without a recession.
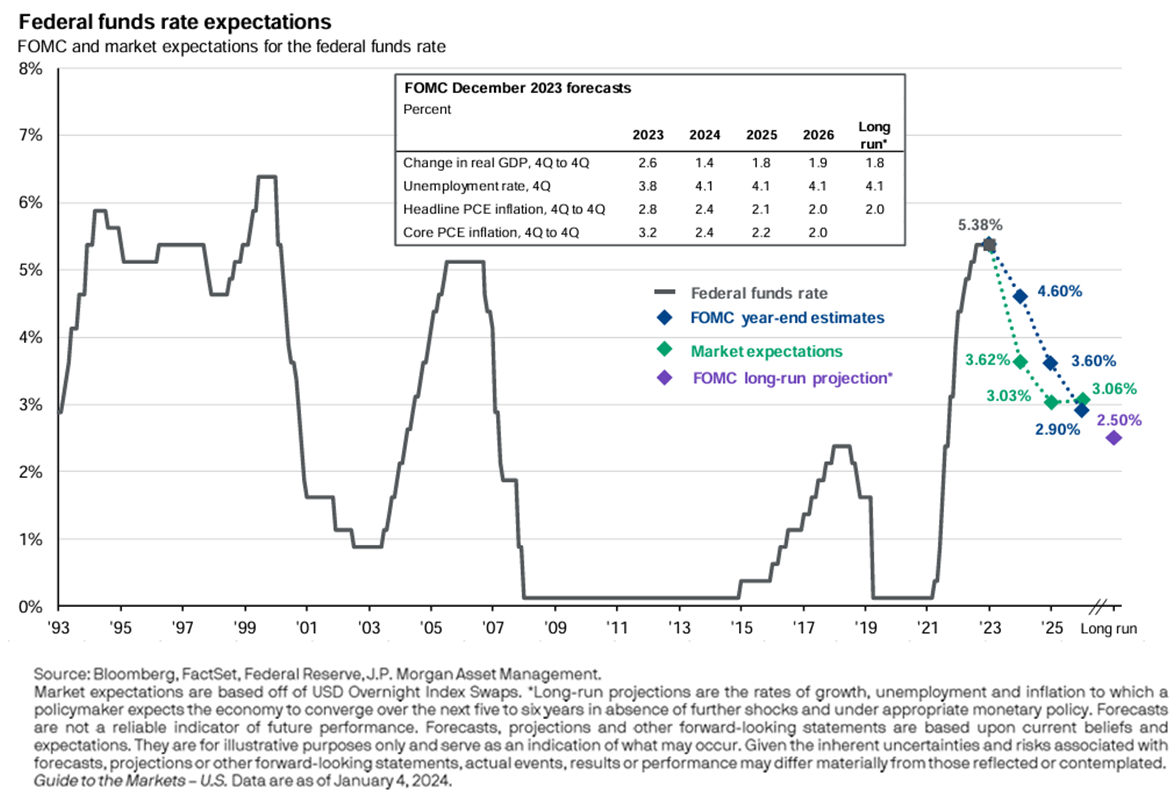
Why is that? I think largely it's because we have the largest economy in the world, so picture a battleship in a bathtub, it takes a long time to turn, and because it's so large, once you've begun the turn you can't just stop the turn on a dime, so our turns tend to overshoot their mark, creating prolonged bull market rallies past what the consensus expects, but also an inability to stop the economy from slowing too much in an effort to fight inflation before it dips into a recession.
Here is the pattern
This chart shows our current rate hike cycle as well as the five rate hike cycles before us. For the five rate hike cycles preceding our current cycle, four of the five resulted in a recession. But that means one of the five created a soft landing, which one was it?

The 1994/1995 rate hike cycle was one of the very few soft landings that the Fed has engineered in history, so could that be done again? What was different about the mid-90s compared to the other four rate hike cycles that led us into a recession?
Leading Economic Index
The leading economic index is comprised of multiple economic indicators such as manufacturing hours worked, consumer sediment, building permits, and more. Its parts are considered by many to be forward-looking measurements of economic activity, which is why it's called the leading index. Below is a historical chart of the LEI index going back to 1960. The way you read the chart, when it's blue the leading indicators in aggregate are positive, when it's red, the leading indicators in aggregate are contracting.
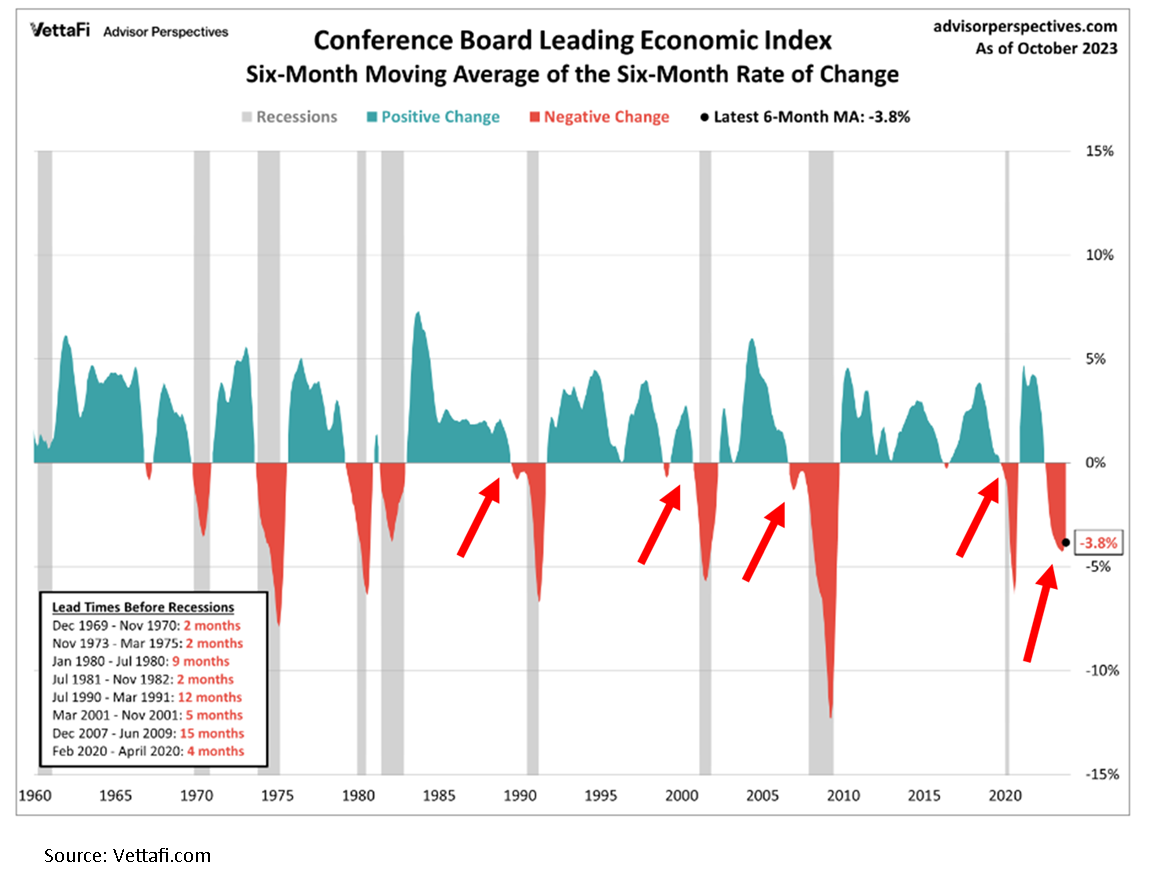
If you look at the four rate hike cycles that led to a recession, the leading indicators index was contracting in all four prior to the recession beginning, serving as a warning sign. But if you look at 1995 in the chart, the leading indicators index never contracted, which means the Fed was able to bring down inflation without slowing the economy.
But on the far right-hand side of the chart, look at where we are now. Not only has the leading indicators index contracted similar to the four rate hike cycles that caused the recession, but it's contracted at a level so deep that we've never been at this level without already being in a recession. If we avoid a recession over the next 12 months, it will be the first time that the LEI index has been this low without a recession preceding it.
Inverted yield curve
There is a technical indicator in the bond market called the yield curve, which tracks both short-term and long-term interest rates. Without getting into the technical details of how it works, when the yield curve inverts, which means short-term interest rates are higher than long-term interest rates, historically, it's a bearish signal, and it increases the likelihood of a recession occurring. In the past, an inverted yield curve has been a very good predictor of a coming recession. See the chart below.
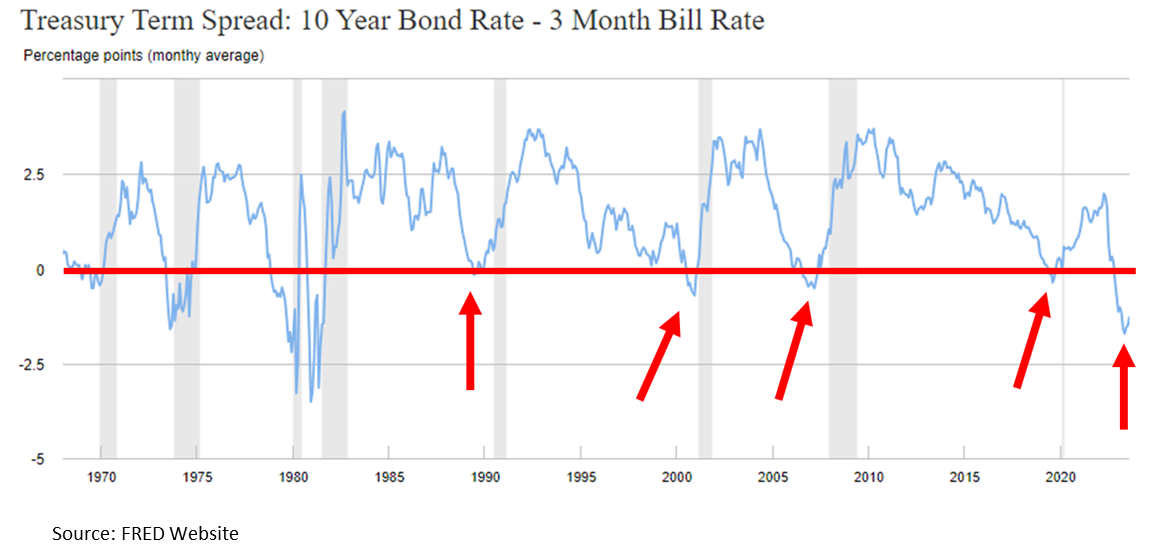
Anytime The blue line drops below the red line the yield curve is inverted, the gray bars on the chart are the recessions, so when all of the previous 5 recessions the yield curve gave us an advance warning before the recession actually occurred. On the far right-hand side of the chart, that is where we are now, not just slightly inverted, but far more heavily inverted than the previous four recessions. Similar to the leading indicators index historical behavior, if we were to avoid a recession in the next 12 months, that would be the exception to the rule.
Returning to our original question of why was the 1994/1995 soft landing different, notice on the inverted yield curve chart during 1995, the yield curve never inverted, making it much different than the situation we're in now.
Magnitude and pace of rate hikes
After going through this exercise and understanding the patterns of the leading indicators index as well as the yield curve, let's return to our first chart, which showed the six rate hike cycles, including the one we're in now.
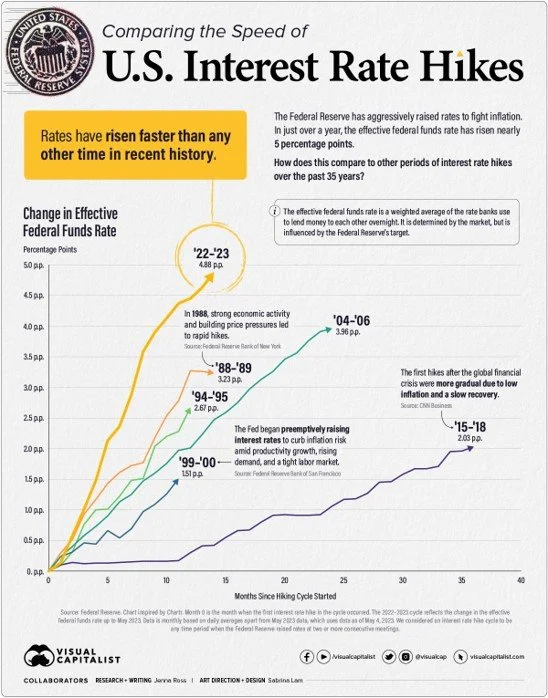
The gold line is the rate hike cycle that we're in now, the others are the five previous rate hike cycles. Again four of those five caused the recession, and the reason why the gold line on the chart is higher than the rest the Fed raised rates higher and faster than they had in the previous five rate hike cycles which begs the question, if the catalyst that caused the recessions is stronger, wouldn't the occurance of a recession be more likely?
Said another way, think of the Fed as a bully that likes to push kids at school, the kids represent the US economy, and the force that the bully uses to push the kids is measured by the magnitude of the interest rate increase. There are six kids standing in the hallway as the bully approaches, the first four he pushes with half of his strength, and the kids fall over on the floor, the fifth child gets nudged but does not fall over, but the bully is now running full speed at the sixth child and we're trying to figure out how it's going to end.
With history as a guide, I have a difficult time envisioning a situation where that sixth student remains on their feet.
No Recession
So what if we're wrong? What if, by some miracle, in the face of all these historic trends, the US economy avoids a recession? I would then add that while it is, of course, possible that we could avoid a recession because it's happened before, that does not necessarily mean we are going avoid a 10% plus market correction at some point in 2024 because the stock market looks to be priced for perfection. You can see this in the future earnings expectations for the S&P 500. Blue bars on the chart are the earnings expectations going into 2024 that are already baked into the S&P 500 stock prices.

It seems that not only is the consensus expecting no recession, but they are also expecting significant earnings growth. Again, with the leading economic indicators being so negative right now and the Fed not expected to lower rates until mid-2024, how do the companies in the S&P 500 meet those aggressive earnings expectations when it seems like the consumer is softening? I completely understand that the stock market is a forward-looking animal, but it seems more likely that we're repeating the mistakes of the past because the stock market can only go so far without the economy and the stock market is already way ahead even as we head into 2024. That was the most puzzling aspect of 2023, the stock market continued to rally throughout all of 2023, while the U.S. economy continued to slow throughout 2023.
The Consumer Is Not As Strong As They Seem
I continue to hear the phrase, “consumer spending remains strong”, and I agree that the consumer has been more resilient that even I expected in 2023. However, much of that spending is being done on credit. Take a look at how much credit card debt has risen in the U.S. post COVID, quickly breaking through over $1 Trillon dollars.

Not only has the level of credit card debt risen to record levels but the interest rates being charged on that debt is significantly higher than it was just a year ago, resulting in less discretionary income for consumers with credit card debt.
Buffet & Munger
Many people know the famous investor Warren Buffet and his famous quote: “Be fearful when others are greedy, and be greedy when others are fearful.” But many people don’t know that Warren had a fellow billionaire partner in Berkshire Hathaway named Charlie Munger. Charlie just passed away in 2023 at the age of 99, and Charlie had a famous quote of his own:
“The world is full of foolish gamblers, and they will not do as well as the patient investors.”
Living in a world of FOMO (Fear Of Missing Out), patience is probably the most difficult investment discipline to master, but I personally have found it to be the most rewarding discipline during my 20+ year career in the investment industry. The year 2024 may be lining up to be another history lesson as FOMO investors fail to recognize the historical pattern between interest rates and the economy dating back 50 years.

About Michael……...
Hi, I’m Michael Ruger. I’m the managing partner of Greenbush Financial Group and the creator of the nationally recognized Money Smart Board blog . I created the blog because there are a lot of events in life that require important financial decisions. The goal is to help our readers avoid big financial missteps, discover financial solutions that they were not aware of, and to optimize their financial future.


This Market Rally Could Be A Bear Trap!! Here’s why……
The recent stock market rally could end up being a bear market trap for investors. If it is, this would be the 4th bear market trap of 2022.

After a really tough first 6 months of the year, the stock market has been in rally mode, rising over 9% within the last 30 days. It’s left investors anxious to participate in the rally to recapture the losses that were incurred in the first half of the year. Our guidance to clients, while there are plenty of bobbing heads on TV talking about “buying the dip” and trying to call the “bottom” in the market, this could very well be what we call a “bear trap”. A bear trap is a short-term rally that baits investors into thinking the market has bottomed only to find out that they fell for the trap, and experience big losses when the market retreats to new lows.
The 4th Bear Trap In 2022
If the current rally ends up being a bear trap, it would actually be the 4th bear trap so far in 2022.

The green boxes in the chart show when the rallies occurred and the magnitude. Notice how the market moved to a new lower level after each rally, this is a common pattern when you are in a prolonged bear market environment.
So how do you know when the bear market is over and the new sustainable bull market rally has begun? It’s actually pretty simple. Ask yourself, what were the issues that drove the market lower in the first place? Next question, “Is the economy making MEANINGFUL progress to resolve those issues?” If the answer is yes, you may in fact be at the beginning of the rally off of the bottom; if the answer is no, you should resist the temptation to begin loading up on risk assets.
It's Not A Secret
It’s not a secret to anyone that inflation is the main issue plaguing not just the U.S. economy but economies around the world. Everyone is trying to call the “peak” but we did a whole video on why the peak doesn’t matter.
The market cheered the July inflation report showing that headline year over year inflation dropped from 9.1% in June to 8.5% in July. While progress is always a good thing, if the inflation rate keeps dropping by only 0.60% per month, we are going to be in a lot of trouble heading into 2023. Why? As long as the inflation rate (the amount prices are going up) is higher than the wage growth rate (how much more people are making), it will continue to eat away at consumer spending which is the bedrock of the U.S. economy. As of July, wages are growing at only 6.2% year over year. That’s still a big gap until we get to that safety zone.
Understand The Math Behind The CPI Data
While it’s great that the CPI (Consumer Price Index) is dropping, the main CPI number that hits the headlines is the year-over-year change, comparing where prices were 12 months ago to the prices on those same goods today. Let me explain why that is an issue as we look at the CPI data going forward. If I told you I will sell you my coffee mug today for $100, you would say “No way, that’s too expensive.” But a year from now I try and sell you that same coffee mug for $102 and I tell you that the cost of this mug has only risen by 2% over the past year, does that make you more likely to buy it? No, it doesn’t because the price was already too high to begin with.
In August 2021, inflation was already heating up. The CPI headline number for August 2021 was 5.4%, already running above the Fed’s comfort level of 3%. Similar to the example I just gave you above with the coffee mug, if the price of everything was ALREADY at elevated levels a year ago, and it went up another 8.5% on top of that elevated level, why is the market celebrating?
Probability of A 2023 Recession
Even though no single source of data is an accurate predicator as to whether or not we will end up in a recession in 2023, the chart that I am about to show you is being weighted heavily in the investment decisions that we are making for our clients.
Historically an “inverted” yield curve has been a fairly accurate predicator of a coming recession. Without going into all of the details of what causes a yield curve inversion, in its simplest form, it’s the bond market basically telling the stock market that a recession could be on the horizon. The chart below shows all of the yield curve inversions going back to 1970. The red arrows are where the inversion happened and the gray shaded areas are where recession occurred.

Look at where we are right now on the far right-hand side of the chart. There is no question that the yield curve is currently inverted and not just by a little bit. There are two main takeaways from this chart, first, there has been a yield curve inversion prior to every recession going back to 1970, an accurate data point. Second, there is typically a 6 – 18 month delay between the time the yield curve inverts and when the recession actually begins.
Playing The Gap
I want to build off of that last point about the yield curve. Investors will sometimes ask, “if there is historically a 6 – 18 month delay between the inversion and the recession, why would you not take advantage of the market rally and then go to cash before the recession hits?” My answer, if someone could accurately do that on a consistent basis, I would be out of a job, because they would manage all of the money in the world.
Recession Lessons
I have been in the investment industry since 2002. I experienced the end of the tech bubble bust, the Great Recession of 2008/2009, Eurozone Crisis, and 2020 COVID recession. I have learned a number of valuable lessons with regard to managing money prior to and during those recessions that I’m going to share with you now:
It’s very very difficult to time the market. By the time most investors realize we are on the verge of a recession, the market losses have already piled up.
Something typically breaks during the recession that no one expects. For example, in the 2008 Housing Crisis, on the surface it was just an issue with inflated housing prices, but it manifested into a leverage issue that almost took down our entire financial system. The questions becomes if we end up in a recession in 2023, will something break that is not on the surface?
Do not underestimate the power of monetary and fiscal policy.
The Power of Monetary & Fiscal Policy
I want to spend some time elaborating on that third lesson. The Fed is in control of monetary policy which allows them to use interest rates and bond activity to either speed up or slow down the growth rate of the economy. The Fed’s primary tool is the Fed Funds Rate, when they want to stimulate the economy, they lower rates, and when they want to slow the economy down (like they are now), they raise rates.
Fiscal policy uses tax policy to either stimulate or slow down the economy. Similar to what happened during COVID, the government authorized stimulus payments, enhanced tax credits, and created new programs like the PPP to help the economy begin growing again.
Many investors severely underestimate the power of monetary and fiscal stimulus. COVID was a perfect example. The whole world economy came to a standstill for the first time in history, but the Fed stepped in, lowered rates to zero, injected liquidity into the system via bond purchases, and Congress injected close to $7 Trillion dollars in the U.S. economy via all of the stimulus policies. Even though the stock market dropped by 34% within two months at the onset of the COVID crisis in 2020, the S&P 500 ended up posting a return of 16% in 2020.
Now those same powerful forces that allowed the market to rally against unsurmountable odds are now working against the economy. The Fed is raising rates and decreasing liquidity assistance. Since the Fed has control over short term interest rates but not long-term rates, that is what causes the yield curve inversion. Every time the Fed hikes interest rates, it takes time for the impact of those rate hikes to make their way through the economy. Some economists estimate that the delay between the rate hike and the full impact on the economy is 6 – 12 months.
The Fed Is Raising More Aggressively
The Fed right now is not just raising interest rates but raising them at a pace and magnitude that is greater than anything we have seen since the 1970’s. A chart below shows historical data of the Fed Fund Rate going back to 2000.

Look at 2004 and 2016, it looks like a staircase. Historically the Fed has raised rates in small steps of 0.25% - 0.50%. This gives the economy the time that it needs to digest the rate hikes. If you look at where we are now in 2022, the line shoots up like a rocket because they have been raising rates in 0.75% increments and another hike of 0.50% - 0.75% is expected at the next Fed meeting in September. When the Fed hikes rates bigger and faster than it ever has in recent history, it increases the chances that something could “break” unexpectedly 6 to 12 months from now.
Don’t Fight The Fed
You will frequently hear the phrase “Don’t Fight The Fed”. When you look back at history, when the Fed is lowering interest rates in an effort to jump start the economy, it usually works. Conversely, when the Fed is raising rates to slow down the economy to fight inflation, it usually works but it’s a double edged sword. While they may successfully slow down inflation, to do so, they have to slow down the economy, which is traditionally not great news for the stock market.
I have to credit Rob Mangold in our office with this next data point that was eye opening to me, when you look back in history, the Fed has NEVER been able to reduce the inflation rate by more than 2% without causing a recession. Reminder, the inflation rate is at 8.5% right now and they are trying to get the year over year inflation rate back down to the 2% - 3% range. That’s a reduction of a lot more than 2%.
Stimulus Packages Don’t Work
In the 1970’s, when we had hyperinflation, the government made the error of issuing stimulus payments and subsidies to taxpayers to help them pay the higher prices. They discovered very quickly that it was a grave mistake. If there is inflation and the people have more money to spend, it allows them to keep paying those higher prices which creates MORE inflation. That is why in the late 70’s and early 80’s, interest rates rose well above 10%, and it was a horrible decade for the stock market.
In the U.S. we have become accustomed to recessions that are painful but short. The COVID Recession and 2008/2009 Housing Crisis were both painful but short because the government stepped in, lowered interest rates, printed a bunch of money, and got the economy growing again. However, when inflation is the root cause of our pain, unless the government repeats their mistakes from the 1970’s, there is very little the government can do to help until the economy has contracted by enough to curb inflation.
Is This The Anomaly?
Investors have to be very careful over the next 12 months. If by some chance, the economy is able to escape a recession in 2023, based on the historical data, that would be an “anomaly” as opposed to the rule. Over my 20 year career in the industry, I have heard the phrase “well this time it’s different because of X, Y, and Z” but I have found that it rarely is. Invest wisely.
About Michael……...
Hi, I’m Michael Ruger. I’m the managing partner of Greenbush Financial Group and the creator of the nationally recognized Money Smart Board blog . I created the blog because there are a lot of events in life that require important financial decisions. The goal is to help our readers avoid big financial missteps, discover financial solutions that they were not aware of, and to optimize their financial future.

