2024 Market Outlook: Investors Are In For A Few Surprises
Investors have to be ready for many surprises in 2024. While the US economy was able to escape a recession in 2023, if anything, it has increased the chances of either a recession or a market pullback in the first half of 2024.
Investors have to be ready for many surprises in 2024. While the US economy was able to escape a recession in 2023, if anything, it has increased the chances of either a recession or a market pullback in the first half of 2024. While many investors remember how bad the Great Recession was back in 2008 and 2009, very few remember what the market conditions were like prior to the recession beginning. As an investment firm, we archive a lot of that data, so we reference it at any time to determine where the market may be headed today, and the historical data is alarming.
Rewind the clock to January 2008
In January 2008, the US economy was already in a recession, but it had not officially been declared yet that's because a recession, by textbook definition, is two consecutive quarters of negative GDP, but you don't get the quarterly GDP readings until after each calendar quarter end, so while the recession in the US officially began December 2007, investors didn't realize recession had been declared until mid-way through 2008. So what were the forecasts for the S&P 500 in January 2008?
The broker-dealer that we were with at the time was forecasting in January 2008 that the S&P 500 Index would be up 16% in 2008. We now know that 2008 was the first year of the Great Recession, and the S&P 500 ended up posting a loss of 36% for the year. Many investors don't realize that historically, the consensus is very bad at predicting a coming recession because they failed to recognize the patterns in the economy and monetary policy that tend to be very good predictors of recessions. Investors are often more worried about missing out on the next 20% rally in the markets, which is why they get caught when the market begins its steep sell-off.
What were some of these economists looking at in January 2008 that made them so wrong? Towards the end of 2007, we had already begun to see the cracks within the US housing market, the economy had already started to slow, but in September 2007, the Federal Reserve began to lower interest rates which stock forecasters saw as a bullish signal that the monetary stimulus of lower interest rates would mean growth for the stock market in 2008. This echoes much of the same rhetoric that I heard in the fourth quarter of 2023 as the Fed decided to go on pause and then built in rate cuts to their 2024 forecast.
If you look back at history, there's a pattern between the US economy and the Fed funds rate, and it's fairly consistent over time. Here is a chart of the Fed funds rate going back to 1993. You will see the same pattern in the chart, The Fed raises rates to fight inflation, they pause (which is the tabletop portion at each of the mountain peaks), and then rates drop rapidly when the economy slows by too much, and the economy enters a recession. The Fed is historically very bad at delivering soft landings, which is a reduction in inflation without a recession.
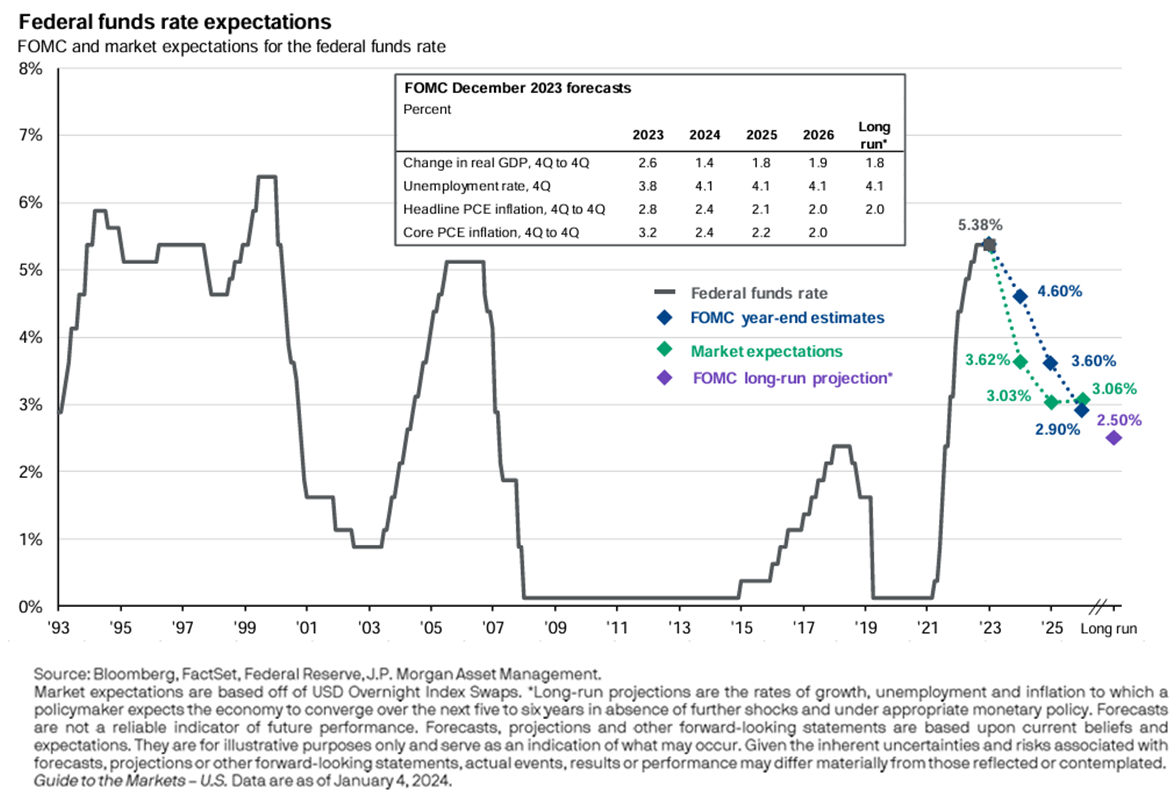
Why is that? I think largely it's because we have the largest economy in the world, so picture a battleship in a bathtub, it takes a long time to turn, and because it's so large, once you've begun the turn you can't just stop the turn on a dime, so our turns tend to overshoot their mark, creating prolonged bull market rallies past what the consensus expects, but also an inability to stop the economy from slowing too much in an effort to fight inflation before it dips into a recession.
Here is the pattern
This chart shows our current rate hike cycle as well as the five rate hike cycles before us. For the five rate hike cycles preceding our current cycle, four of the five resulted in a recession. But that means one of the five created a soft landing, which one was it?

The 1994/1995 rate hike cycle was one of the very few soft landings that the Fed has engineered in history, so could that be done again? What was different about the mid-90s compared to the other four rate hike cycles that led us into a recession?
Leading Economic Index
The leading economic index is comprised of multiple economic indicators such as manufacturing hours worked, consumer sediment, building permits, and more. Its parts are considered by many to be forward-looking measurements of economic activity, which is why it's called the leading index. Below is a historical chart of the LEI index going back to 1960. The way you read the chart, when it's blue the leading indicators in aggregate are positive, when it's red, the leading indicators in aggregate are contracting.
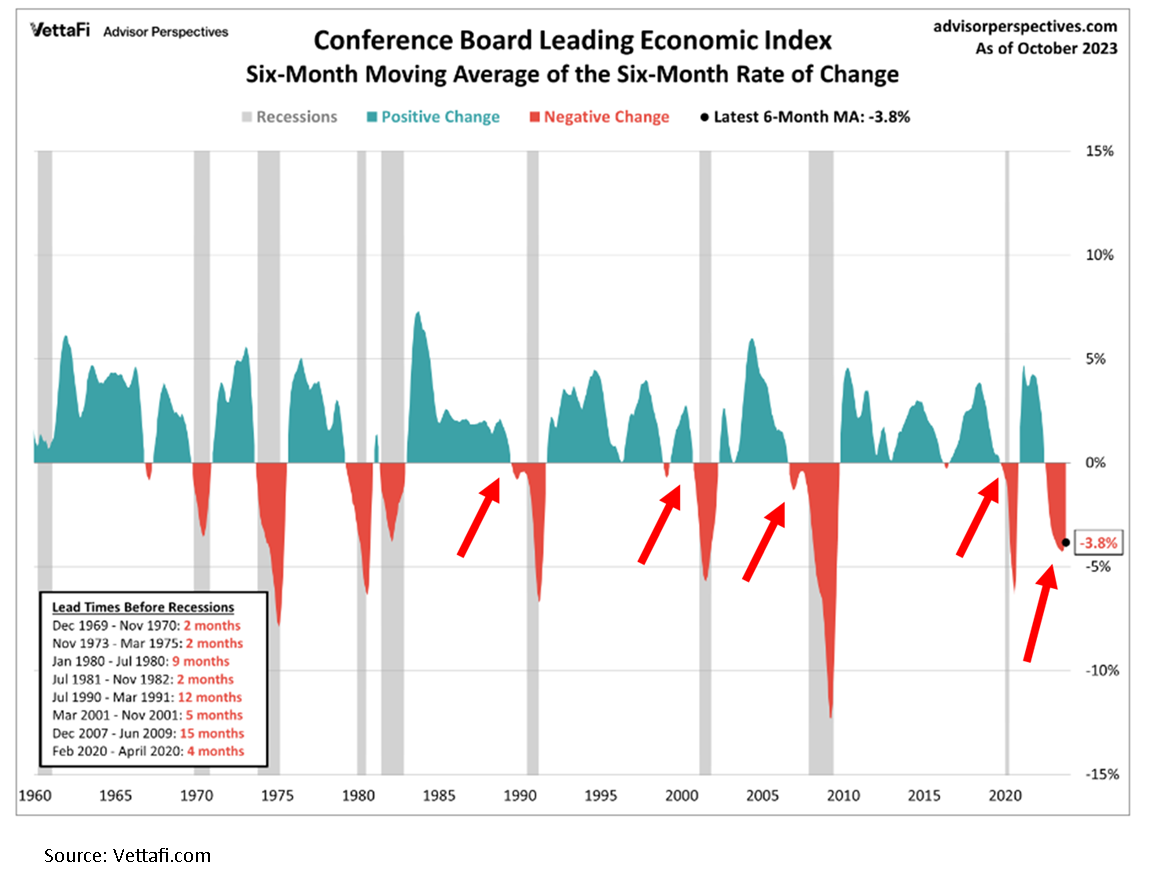
If you look at the four rate hike cycles that led to a recession, the leading indicators index was contracting in all four prior to the recession beginning, serving as a warning sign. But if you look at 1995 in the chart, the leading indicators index never contracted, which means the Fed was able to bring down inflation without slowing the economy.
But on the far right-hand side of the chart, look at where we are now. Not only has the leading indicators index contracted similar to the four rate hike cycles that caused the recession, but it's contracted at a level so deep that we've never been at this level without already being in a recession. If we avoid a recession over the next 12 months, it will be the first time that the LEI index has been this low without a recession preceding it.
Inverted yield curve
There is a technical indicator in the bond market called the yield curve, which tracks both short-term and long-term interest rates. Without getting into the technical details of how it works, when the yield curve inverts, which means short-term interest rates are higher than long-term interest rates, historically, it's a bearish signal, and it increases the likelihood of a recession occurring. In the past, an inverted yield curve has been a very good predictor of a coming recession. See the chart below.
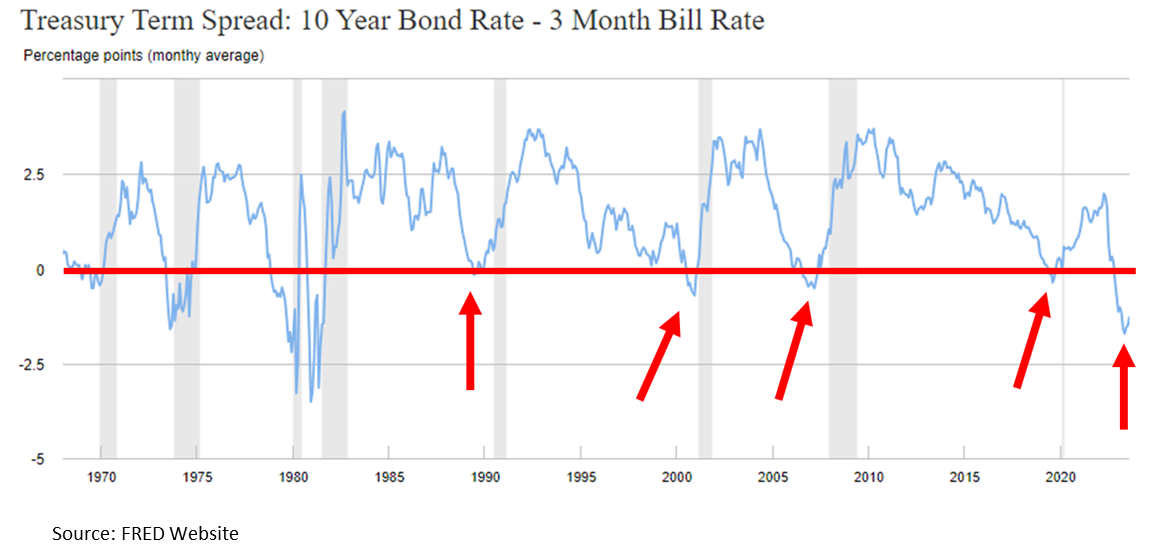
Anytime The blue line drops below the red line the yield curve is inverted, the gray bars on the chart are the recessions, so when all of the previous 5 recessions the yield curve gave us an advance warning before the recession actually occurred. On the far right-hand side of the chart, that is where we are now, not just slightly inverted, but far more heavily inverted than the previous four recessions. Similar to the leading indicators index historical behavior, if we were to avoid a recession in the next 12 months, that would be the exception to the rule.
Returning to our original question of why was the 1994/1995 soft landing different, notice on the inverted yield curve chart during 1995, the yield curve never inverted, making it much different than the situation we're in now.
Magnitude and pace of rate hikes
After going through this exercise and understanding the patterns of the leading indicators index as well as the yield curve, let's return to our first chart, which showed the six rate hike cycles, including the one we're in now.
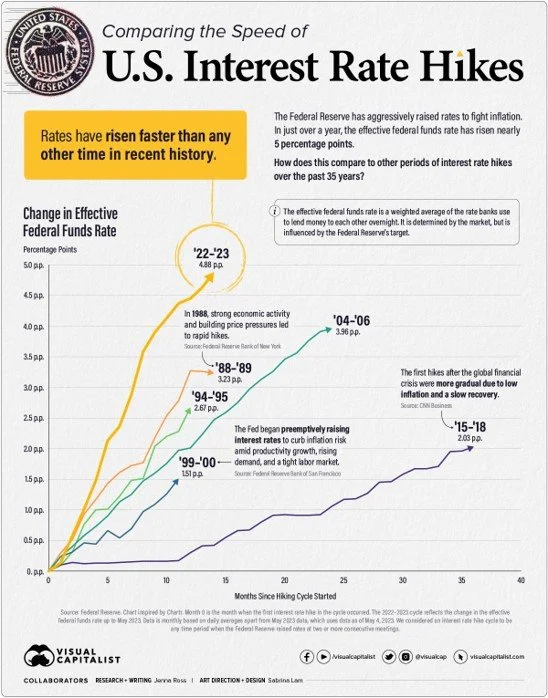
The gold line is the rate hike cycle that we're in now, the others are the five previous rate hike cycles. Again four of those five caused the recession, and the reason why the gold line on the chart is higher than the rest the Fed raised rates higher and faster than they had in the previous five rate hike cycles which begs the question, if the catalyst that caused the recessions is stronger, wouldn't the occurance of a recession be more likely?
Said another way, think of the Fed as a bully that likes to push kids at school, the kids represent the US economy, and the force that the bully uses to push the kids is measured by the magnitude of the interest rate increase. There are six kids standing in the hallway as the bully approaches, the first four he pushes with half of his strength, and the kids fall over on the floor, the fifth child gets nudged but does not fall over, but the bully is now running full speed at the sixth child and we're trying to figure out how it's going to end.
With history as a guide, I have a difficult time envisioning a situation where that sixth student remains on their feet.
No Recession
So what if we're wrong? What if, by some miracle, in the face of all these historic trends, the US economy avoids a recession? I would then add that while it is, of course, possible that we could avoid a recession because it's happened before, that does not necessarily mean we are going avoid a 10% plus market correction at some point in 2024 because the stock market looks to be priced for perfection. You can see this in the future earnings expectations for the S&P 500. Blue bars on the chart are the earnings expectations going into 2024 that are already baked into the S&P 500 stock prices.

It seems that not only is the consensus expecting no recession, but they are also expecting significant earnings growth. Again, with the leading economic indicators being so negative right now and the Fed not expected to lower rates until mid-2024, how do the companies in the S&P 500 meet those aggressive earnings expectations when it seems like the consumer is softening? I completely understand that the stock market is a forward-looking animal, but it seems more likely that we're repeating the mistakes of the past because the stock market can only go so far without the economy and the stock market is already way ahead even as we head into 2024. That was the most puzzling aspect of 2023, the stock market continued to rally throughout all of 2023, while the U.S. economy continued to slow throughout 2023.
The Consumer Is Not As Strong As They Seem
I continue to hear the phrase, “consumer spending remains strong”, and I agree that the consumer has been more resilient that even I expected in 2023. However, much of that spending is being done on credit. Take a look at how much credit card debt has risen in the U.S. post COVID, quickly breaking through over $1 Trillon dollars.

Not only has the level of credit card debt risen to record levels but the interest rates being charged on that debt is significantly higher than it was just a year ago, resulting in less discretionary income for consumers with credit card debt.
Buffet & Munger
Many people know the famous investor Warren Buffet and his famous quote: “Be fearful when others are greedy, and be greedy when others are fearful.” But many people don’t know that Warren had a fellow billionaire partner in Berkshire Hathaway named Charlie Munger. Charlie just passed away in 2023 at the age of 99, and Charlie had a famous quote of his own:
“The world is full of foolish gamblers, and they will not do as well as the patient investors.”
Living in a world of FOMO (Fear Of Missing Out), patience is probably the most difficult investment discipline to master, but I personally have found it to be the most rewarding discipline during my 20+ year career in the investment industry. The year 2024 may be lining up to be another history lesson as FOMO investors fail to recognize the historical pattern between interest rates and the economy dating back 50 years.

About Michael……...
Hi, I’m Michael Ruger. I’m the managing partner of Greenbush Financial Group and the creator of the nationally recognized Money Smart Board blog . I created the blog because there are a lot of events in life that require important financial decisions. The goal is to help our readers avoid big financial missteps, discover financial solutions that they were not aware of, and to optimize their financial future.


Is Inflation Peaking? That’s The Wrong Question…….
While a lot of investors are asking if inflation has peaked, there is a more importnat question they should be asking which will have a bigger impact on our path forward…….

As I write this article on May 11, 2022, the inflation number was just released for April indicating an 8.3% increase in the Consumer Price Index (CPI) which is the primary measure of the inflation rate. The news and market analysts seem to be consumed with the question “has inflation peaked?” Since the April CPI reading was below the March CPI of 8.5%, the answer may very well be “yes”, but I think there is a more important question that analysts and investors should be paying attention to and I would argue that the answer to this question will be more meaningful to the markets. Here it is, looking at all of the drivers of inflation right now, how does the inflation rate get back down to a level that will help the U.S. economy to avoid a recession?
Claiming victory that inflation has peaked could be a very short celebration if the level of inflation REMAINS at an elevated level for longer than the market and the Fed expects.
The Inflation Problem Has Become More Complex
At the end of 2021, it seemed to be the consensus that the primary driver of higher inflation was due to supply chain constraints in a post COVID world. The solution to that problem seemed fairly simple, as the global supply chain heals, there will be more goods to buy, and prices will gradually come down throughout 2022; but that has changed now. It’s not just supply chain issues that are driving inflation any longer, we now have:
Global supply chain issues
Russian / Ukraine conflict
Oil still over $100 per barrel
Tight labor markets
Wage growth
Strong corporate earnings but weaker forecasts
Fed policy
I would also argue that some of the inflation catalysts listed above will have a more significant impact on the rate of inflation than just the COVID supply constraints. In this article I’m going to walk you through the trends that we are seeing in each of these inflation catalysts and how they could impact inflation going forward. We do not believe that the market is doomed to enter a recession at this point but with so many more forces driving inflation higher, monitoring what really matters to the longer term inflation trend should be foremost in the mind of investors as the war against inflation enters the second half of the 2022.
Russia / Ukraine Conflict
Russia’s continued assault on Ukraine has caused a number of supply chain disruptions in itself but none more impactful to the U.S. than the price of oil. The price of oil has been over $100 per barrel for months which is huge driver of inflation since goods need to be transported on planes, ships, trucks, and trains. Oil companies are not in a rush to produce more because they are enjoying lofty profits and they realize that the price of oil could come down quickly if the violence ends in Ukraine. This is why they are hesitant to spend a lot of money to bring more production online because the price of oil could drop down to $80 or below within the next few months. Could oil go higher from here? It could. The Chinese economy has recently been hampered by COVID outbreaks so demand for oil has eased within the last month, but if this changes you could see the price of oil hit new highs on increased demand from China and we are about to enter the summer travel season in the U.S. If oil prices stay above $100 per barrel throughout the summer, it may keep inflation at elevated levels for longer than anticipated.
The Price of Oil
We just went through what’s driving the price of oil higher but if the price of oil drops within the next few months it’s not an automatic victory. If the price of oil is dropping because there is more supply coming online or because there is peace in Ukraine that is excellent, that should reduce inflationary pressures. However, if the price of oil is decreasing because demand is beginning to soften because the consumer is beginning to buy less, that’s not a positive indicator.
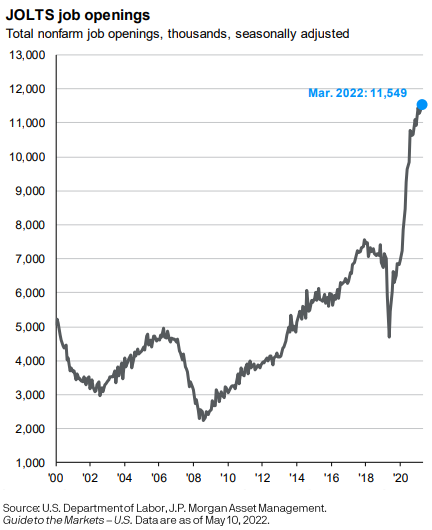
More Jobs Than Workers
Currently there are 5.9 million unemployed people in the U.S., and as of March there are 11.5M job openings which puts us at 2 job openings for every 1 person looking for work. If you look at the chart below of the total job openings, it’s easy to see that we are in uncharted territory here:
So, when you have more jobs than people looking for work, what do you think is going to happen to wages? They are going to go up. When you look back in history, one of the largest drivers of big inflationary periods is wage growth. Think about it this way, if the government hands you a stimulus check, you will be able to buy more stuff or pay higher prices for goods and services than you normally would, but this is temporary. Once you have spent that government stimulus money, you can no longer afford to pay higher prices.
If you change jobs, and you receive a $30,000 raise, now you can pay higher prices, not just this year but next year, and the year after that. Wage growth creates “sticky inflation”. It doesn’t just go away when the supply chain recovers or when oil prices retreat. As of April, wage growth has risen 6.4% over the past year, and the last time we saw wage growth over 6% was the 1970’s which not so coincidentally was a period of prolonged hyperinflation.
The only way I can foresee wage growth decreasing is a slow down in the economy which raises the risk of a recession. It’s simple supply and demand. If you have more jobs than people to fill them, companies will have to pay hire wages to attract and keep employees, the companies will most likely pass those higher costs onto the consumer in the form of higher prices, eventually the consumer can no longer afford those higher prices, the economy slows down, and then those excess jobs are eliminated. Not a fun storyline.
Subtle Warning Signs In Corporate Earnings
The tone from the Fed at the beginning of 2022 was that they will be raising rates to slow down inflation, but the economy is strong enough to withstand the rate hikes and we should be able to avoid a recession. The U.S. economy is driven primarily by consumer spending, and the consumer definitely showed up to spend in the first quarter of 2022. However, while many of the companies in the S&P 500 Index exceeded earning expectations, a number of them softened their outlook for the remainder of 2022 due to rising input costs and the impact of higher prices on consumer spending. Knowing that the stock market and bond market are forward looking animals, even though inflation has not taken a huge toll on corporate earnings yet, clouds are beginning to form which investors should pay close attention to.
Tech Stocks Getting Hit
As of May 9th, the S&P 500 Index is down 16% but the Nasdaq is down 26%. When inflation shows up, valuations begin to matter over a company’s growth story because cash becomes king. Here is how I explain it, if inflation is going up at 8% per year, if I ask you if you want me to give you $1 today or $1 a year from now, you would choose $1 today because a year from now, that dollar would have less purchasing power, because inflation is causing the price of everything to go up. It works the same way with stock prices.
The market uses P/E Ratios to determine how expensive stock is which is simply a company’s stock price divided by its earnings per share. If a company’s stock price is $100 and they are expected to earn $100 in profit for each share of stock, the P/E ratio would be 1. But it’s common for stocks to trade at 10, 15, or even 30 times one year of forward earnings. The higher the PE ratio, the more assumed future growth is built into the price of that stock. Some growth companies have very little in terms of net profit because they are spending a lot of money to make their big growth dreams come to life. These growth stocks can sometimes trade at a PE of 50, 100, or higher!!
When inflation hits and investors realize a dollar today is more valuable than a dollar tomorrow, they have to begin to discount those future returns that are built into stock prices. A stock that is trading at 50 times their one year earnings will typically have to drop in price a lot more than a stock that is only trading at 10 times it’s future one year earnings because you have to discount 50 years of earnings instead of 10.
Fed Policy
The last variable in the inflation equation is Fed policy. The Fed has a really tough job right now, reduce inflation without pushing the economy into a recession. When it was just supply chain issues, I think the market had it right by describing it as “the Fed is trying to engineer a soft landing”. With new inflationary forces now entering the equation, I would describe the Feds task as “threading a needle while the needle is moving”.
At the May meeting, the Fed announced, as expected, a 0.50% increase to the Fed funds rate, but during that meeting they also dismissed that a future 0.75% rate hike was on the table. The markets cheered and rose significantly that day hearing that a 0.75% hike was unlikely but then the next day the market lost all of those gains, and continues to add to the losses - worried that the Fed was not raising rates fast enough to keep higher inflation at bay.
It's All About Inflation
While a lot of attention is being given to the Fed and what the Fed might do next, the focus has to come back to not just stopping inflation from going higher but how do they get inflation to decrease fast enough before it derails the consumer. I highlight all of these inflation variables because you could get good news on supply chain improvements and corporate earnings but if oil remains above $100 per barrel and wage growth is still 6%+, it difficult to picture how the year over year change in the inflation rate gets below 4% or 5% before the end of the year.
The consumer is everything. If the consumer has higher wages and the cash reserves to withstand the higher prices while the Fed is working to bring inflation down, it is possible that we could see a rally in the second half of the year. But the long inflation persists, the less likely that relief rally scenario becomes.
This Time It’s Different
I urge all investors to be careful here. In the investment world you will sometimes hear the phase “this time it’s different” or “we have never been here before” which can add additional stress and anxiety to a market environment that is already scary. I urge caution here because in 2022 there has been a trend that is very different. In most market downturns, when stocks go down, bonds will typically be up, which is one of the benefits of a properly diversified portfolio. When you compare historical returns of the S&P 500 Index versus the Aggregate Bond Index, you will see this pattern:
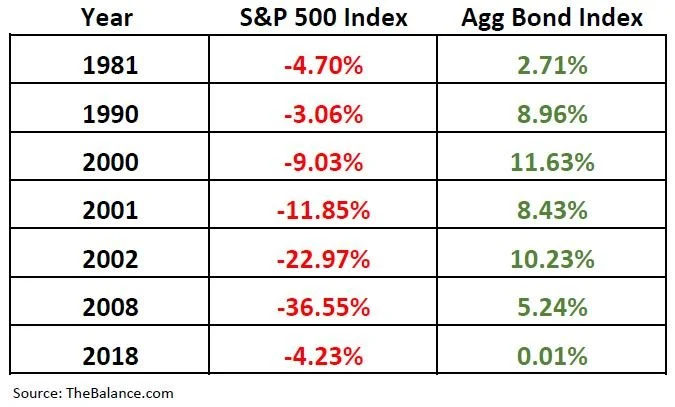
Unfortunately, as of May 9, 2022, stocks and bonds are both down a significant amount year-to -date:

It feels like we are getting close to a fork in the road. Either we will begin to see meaningful improvement in the inflation rate over the next few months setting both the stock and bond market on a path to recovery in the second half of 2022, or despite the Fed’s best efforts, regardless of whether or not we have seen a peak in inflation, if inflation does not come down a meaningful amount by the fall, the U.S. economy may slip into a mild recession in 2023. Until we know, investors will have to pay very close attention to these monthly indicators that are driving the inflation rate.
About Michael……...
Hi, I’m Michael Ruger. I’m the managing partner of Greenbush Financial Group and the creator of the nationally recognized Money Smart Board blog . I created the blog because there are a lot of events in life that require important financial decisions. The goal is to help our readers avoid big financial missteps, discover financial solutions that they were not aware of, and to optimize their financial future.


What Caused The Market To Sell Off In September?

What Caused The Market To Sell Off In September?
The stock market experienced a fairly significant drop in the month of September. In September, the S&P 500 Index dropped 4.8% which represents the sharpest monthly decline since March 2020. I wanted to take some time today to evaluate:
· What caused the market drop?
· Do we think this sell off is going to continue?
· Have the recent market events caused us to change our investment strategy?
September Is Historically A Bad Month
Looking back at history, September is historically the worse performing month for the stock market. Since 1928, the S&P 500 Index has averaged a 1% loss in September (WTOP News). Most investors have probably forgotten that in September 2020, the market experienced a 10% correction, but rallied significantly in the 4th quarter.
The good news is the 4th quarter is historically the strongest quarter for the S&P 500. Since 1945, the stock market has averaged a 3.8% return in the final three months of the year (S&P Global).
The earned income penalty ONLY applies to taxpayers that turn on their Social Security prior to their normal retirement age. Once you have reached your normal retirement age, this penalty does not apply.
Delta Variant
The emergence of the Delta Variant slowed economic activity in September. People cancelled travel plans, some individuals avoided restaurants and public events, employees were out sick or quarantined, and it delayed some companies from returning 100% to an office setting. However, we view this as a temporary risk as vaccination rates continue to increase, booster shots are distributed, and the death rates associated with the virus continue to stay at well below 2020 levels.
China Real Estate Risk
Unexpected risks surfaced in the Chinese real estate market during September. China's second largest property developer Evergrande Group had accumulated $300 billion in debt and was beginning to miss payments on its outstanding bonds. This spread fears that a default could cause issues other places around the globe. Those risks subsided as the month progressed and the company began to liquidate assets to meet its debt payments.
Rising Inflation
In September we received the CPI index report for August that showed a 5.3% increase in year over year inflation which was consistent with the higher inflation trend that we had seen earlier in the year. In our opinion, inflation has persisted at these higher levels due to:
· Big increase in the money supply
· Shortage of supply of good and services
· Rising wages as companies try to bring employees back into the workforce
The risk here is if the rate of inflation continues to increase then the Fed may be forced to respond by raising interest rates which could slow down the economy. While we acknowledge this as a risk, the Fed does not seem to be in a hurry to raise rates and recently announced plans to pare back their bond purchases before they begin raising the Fed Funds Rate. Fed Chairman Powell has called the recent inflation trend “transitory” due to a bottleneck in the supply chain as company rush to produce more computer chips, construction materials, and fill labor shortages to meet consumer demand. Once people return to work and the supply chain gets back on line, the higher levels of inflation that we are seeing could subside.
Rising Rates Hit Tech Stocks
Interest rates rose throughout the month of September which caused mortgage rates to move higher, but more recently there has been an inverse relationship between interest rates and tech stocks. As interest rates rise, tech stocks tend to fall. We attribute this largely to the higher valuations that these tech stocks trade at. As interest rates rise, it becomes more difficult to justify the multiples that these tech stocks are trading at. It is also important to acknowledge that these tech companies have become so large that the tech sector now represents about 30% of the S&P 500 Index (JP Morgan Guide to the Markets).
Risk of a Government Shutdown
Toward the end of the month, the news headlines were filled with the risk of the government shutdown which has been a reoccurring issue for the U.S. government for the past 20 years. This was nothing new, but it just added more uncertainty to the pile of negative headlines that plagued the markets in September. It was announced on September 30th that Congress had approved a temporary funding bill to extend the deadline to December 3rd.
Expectation Going Forward
Even though the Stock Market faced a pile of bad news in September, our internal investment thesis at our firm has not changed. Our expectation is that:
· The economy will continue to gain strength in coming quarters
· There is a tremendous amount of liquidity still in the system from the stimulus packages that has yet to be spent
· People will begin to return to work to produce more goods and services
· Those additional goods and services will then ease the current supply chain bottleneck
· Interest rates will move higher but they still remain at historically low levels
· The risk of the delta variant will diminish increasing the demand for travel
We will continue to monitor the economy, financial markets, and will release more articles in the future as the economic conditions continue to evolve in the coming months.

About Michael……...
Hi, I’m Michael Ruger. I’m the managing partner of Greenbush Financial Group and the creator of the nationally recognized Money Smart Board blog . I created the blog because there are a lot of events in life that require important financial decisions. The goal is to help our readers avoid big financial missteps, discover financial solutions that they were not aware of, and to optimize their financial future.
DISCLOSURE: This material is for informational purposes only. Neither American Portfolios nor its Representatives provide tax, legal or accounting advice. Please consult your own tax, legal or accounting professional before making any decisions. Any opinions expressed in this forum are not the opinion or view of American Portfolios Financial Services, Inc. and have not been reviewed by the firm for completeness or accuracy. These opinions are subject to change at any time without notice. Any comments or postings are provided for informational purposes only and do not constitute an offer or a recommendation to buy or sell securities or other financial instruments. Readers should conduct their own review and exercise judgment prior to investing. Investments are not guaranteed, involve risk and may result in a loss of principal. Past performance does not guarantee future results. Investments are not suitable for all types of investors. Investment advisory services offered through Greenbush Financial Group, LLC. Greenbush Financial Group, LLC is a Registered Investment Advisor. Securities offered through American Portfolio Financial Services, Inc (APFS). Member FINRA/SIPC. Greenbush Financial Group, LLC is not affiliated with APFS. APFS is not affiliated with any other named business entity. There is no guarantee that a diversified portfolio will enhance overall returns or outperform a non-diversified portfolio. Diversification does not ensure against market risk. The opinions voiced in this material are for general information only and are not intended to provide specific advice or recommendations for any individual. To determine which investments may be appropriate for you, consult your financial advisor prior to investing. All performance referenced is historical and is no guarantee of future results. All indices are unmanaged and cannot be invested into directly. Guarantees apply to certain insurance and annuity products (not securities, variable or investment advisory products) and are subject to product terms, exclusions and limitations and the insurer's claims-paying ability and financial strength. Before investing, consider the investment objectives, risks, charges, and expenses of the annuity and its investment options. Please submit using the same generated coversheet for this submission number. Potential investors of 529 plans may get more favorable tax benefits from 529 plans sponsored by their own state. Consult your tax professional for how 529 tax treatments and account fees would apply to your particular situation. To determine which college saving option is right for you, please consult your tax and accounting advisors. Neither APFS nor its affiliates or financial professionals provide tax, legal or accounting advice. Please carefully consider investment objectives, risks, charges, and expenses before investing. For this and other information about municipal fund securities, please obtain an offering statement and read it carefully before you invest. Investments in 529 college savings plans are neither FDIC insured nor guaranteed and may lose value.