

Will The January Market Selloff Continue?
The markets have experienced an intense selloff in the first three weeks of 2022. As of January 21st, the S&P 500 Index is down over 7% for the month. There are only a few times in the past 10 years that the index has dropped by more the 5% in a single month. That begs the questions, “After those big monthly declines, historically, what happens next?”

The markets have experienced an intense selloff in the first three weeks of 2022. As of January 21st, the S&P 500 Index is down over 7% for the month. There are only a few times in the past 10 years that the index has dropped by more the 5% in a single month. That begs the questions, “After those big monthly declines, historically, what happens next?” Continued decline? Market recovery? We are going to answer that question in this article
The recent selloff has also been widespread. The selloff in January has negatively impacted stocks, bonds, crypto, while inflation continues to erode the value of cash. It has essentially created a nowhere to hide market environment. As of January 21, 2022, the YTD returns of the major indices are:
S&P 500 Index: -7.7%
Nasdaq: -12.0%
Small Cap 600: -8.5%
Agg (Bonds): -1.7%
Bitcoin: -24.1%
In this article I’m going to cover:
What has caused the selloff?
Do we expect the selloff to continue?
This Has Happened Before
How many times has the S&P 500 index dropped by more than 5% in a month over the past 10 years?
Answer: 4 times
February 2020: -18.92%
November 2018: -5.56%
December 2015: -6.42%
July 2011: -10.40%
Next question: How many times did the S&P 500 Index post a positive return 3 months following the month with the 5%+ loss?
Answer: ALL OF THEM
Mar 2020 – May 2020: 16.7%
Dec 2018 – Feb 2019: 9.5%
Jan 2016 – Mar 2016: 8.6%
Aug 2011 – Oct 2011: 4.0%
Don’t Make The Jump In / Jump Out Mistake
There is no doubt that the big, swift downturns in the markets bring fear, uncertainty, and stress for investors but all too often investors let their emotions get the better of them and the lose sight of the biggest economic trends that are at work. The most common phrase that I hear from investors during these steep declines is:
“Maybe we should just go to cash to stop the losses and then we can buy back into the stock market once the risks have passed.”
The issue becomes: when do you get back in? Following these big temporary sells offs in the market, it is common that the lion share of the gains happened before things feel good again. Investors get back in after the market has already rallied back, meaning they solidified their losses and they are now allocating money back into stocks when they have returned to higher levels.
We accurately forecasted higher levels of volatility in the market in 2022 when we release our 2022 Market Outlook video. It is also our expectation that with inflation rising and the Fed moving interest rates higher, the selloff that we have experienced in January, will not be the only steep selloff that we are faced with this year. Before we get into the longer- term picture, let’s first look at what prompted the January selloff in the markets.
What Caused The Market Selloff in January?
There are a number of factors that we believe has caused this severe selloff in January:
COVID Omicron cases have surged
The Fed’s more hawkish tone
Rising interest rates
Tech sector selloff
COVID investment plays unwinding
Loss of enhanced child tax credit monthly payments
While that looks like a long list, at the risking sounding like a broken record, if you go back to the Market Outlook video that we released in December, all of these were expected. It’s only when unexpected events occur that we then have to shift our strategy for the entire year. Let’s look at each of these items one by one:
COVID Cases Have Peaked
One thing that caught the market by surprise over the past few months is how contagious the Omicron variant was and how many cases there would be. This caused the recovery story to stall as safety measures were put back into place to control the spread of the most recent variant. The good news is it looks like the cases have peaked and are now on the decline. See the chart below:

It's a little tough to see in the chart but the blue line represents the number of confirmed COVID cases. If you look all the way on the righthand side, as of January 20th, they have dropped dramatically. The 7-day moving average has dropped by about 100,000 cases. This trend supports our forecast that the economy will begin opening up again starting in February. We expect the reopening trade story to be part of the market rally coming off of this tough January for the markets.
The Fed’s Hawkish Tone
It's the Fed’s job to keep inflation under control so the economy does not overheat. Inflation has been running at rate of over 6% for the past several months and going into 2022, the Fed telegraphed making 3 rate hikes in 2022. After the Fed’s January meeting, an even more hawkish tone was found in those meeting minutes, suggesting that more than 3 rate hikes could be on the table this year. This caused interest rates to rise rapidly which hurt both stocks and bonds in January.
But let’s take a look at history. The last time the Fed started raising rates was in 2016. Between 2016 and 2018, they hiked the Fed Funds Rate 8 times. During that two-year period, the S&P 500 was up 15.8%. The lesson here is just because the Fed is beginning to raise rates does not necessarily mark the end of the bull market rally.
Rising Interest Rates
Interest rates rose sharply in January which put downward pressure on both stocks and bonds. Investor often have bonds in their portfolio to offer protection when the there are selloffs in the stock market but when interest rates are moving high and the stock market is selling off at the same time, both stocks and bonds tend to move lower together. The yield on the 10 Year Treasury jumped from 1.51% on December 31, 2021 to 1.86% on January 18, 2022. That does not sound like a big increase but in terms of interest rates that is a huge move in 18 days. (In percentage terms, over 23%)
We do expect interest to continue to rise in 2022 but not at the concentrated monthly pace that we saw in January.
Tech Stock Drop
Tech stock took a big hit in January. The Nasdaq is down 12% in the first three weeks of 2022. In the 2022 Market Outlook we talked about tech stock coming under pressure this year in the face of rising interest rate and a lesson from the 1970’s about the “Nifty Fifty”. These tech stocks tend to trade at higher valuations. Interest rates and valuation levels tend to have an inverse relationship meaning if a stock is trading at a higher valuation level (P/E), they tend to be more adversely affected compared to the rest of the market when interest rates move higher.
COVID Investment Plays Unwind
In January, stocks that were considered “stay at home” COVID plays, like streaming, home exercise equipment, and electronic document providers experience large corrections. Here are some of the names that fall into that space and their performance YTD as of January 21, 2022:
Netlfix: -33%
Peloton: -23%
DocuSign: -23%
Now that the United States has reached a level of vaccinations and positive COVID cases that would suggest that we are at or close to herd immunity, there seems to be a higher likelihood that future COVID variants may not cause extreme economic shutdowns that supported the higher valuation level of these “stay at home” investment strategies.
Loss of Child Tax Credit Payments
Since the Build Back Better bill did not pass in December 2021, the $300+ per month that many parents were receiving for the Enhanced Child Tax Credits stopped in January. While those monthly payments to families were only meant to be temporary, it was highly anticipated that they were going to be extended into 2022 with the passing of the Build Back Better bill. Not having that extra money every month could slow down consumer spending in the first quarter of 2022.
Do We Expect The Selloff To Continue?
No one has a crystal ball but I would be very surprised if we do not see a recovery rally in the markets over the next few months. I think people underestimate the amount of money that has been injected into the U.S. economy over the past 18 months. If you total up all of the COVID stimulus packages over the past 18 months, they total $6.9 Trillion dollars. Compare that to the TARP Stimulus package that saved the banks and housing market in the 2008/2009 recession which only totaled $700 Billion. A lot of that stimulus money has yet to be spent due to supply change and labor constraints over the past year.
It's our expectations that the supply chain, which is already showing improvement, will continue to heal as we move further into 2022, which will give rise to higher levels of consumer spending and in turn, higher corporate earnings.
Inflation will be the greatest risk to the economy in 2022, but if the recovery of the supply chain causes prices to stabilize and consumers have the cash and wages to pay these temporarily higher prices, the bull rally could continue in 2022. But again, it will be choppy. The market could experience numerous corrections similar to what we are experiencing in January that investors may have to hold through, especially as the Fed begins to announce interest rate hikes later this year. We expect patience to be rewarded in 2022.

About Michael……...
Hi, I’m Michael Ruger. I’m the managing partner of Greenbush Financial Group and the creator of the nationally recognized Money Smart Board blog . I created the blog because there are a lot of events in life that require important financial decisions. The goal is to help our readers avoid big financial missteps, discover financial solutions that they were not aware of, and to optimize their financial future.
DISCLOSURE: This material is for informational purposes only. Neither American Portfolios nor its Representatives provide tax, legal or accounting advice. Please consult your own tax, legal or accounting professional before making any decisions. Any opinions expressed in this forum are not the opinion or view of American Portfolios Financial Services, Inc. and have not been reviewed by the firm for completeness or accuracy. These opinions are subject to change at any time without notice. Any comments or postings are provided for informational purposes only and do not constitute an offer or a recommendation to buy or sell securities or other financial instruments. Readers should conduct their own review and exercise judgment prior to investing. Investments are not guaranteed, involve risk and may result in a loss of principal. Past performance does not guarantee future results. Investments are not suitable for all types of investors. Investment advisory services offered through Greenbush Financial Group, LLC. Greenbush Financial Group, LLC is a Registered Investment Advisor. Securities offered through American Portfolio Financial Services, Inc (APFS). Member FINRA/SIPC. Greenbush Financial Group, LLC is not affiliated with APFS. APFS is not affiliated with any other named business entity. There is no guarantee that a diversified portfolio will enhance overall returns or outperform a non-diversified portfolio. Diversification does not ensure against market risk. The opinions voiced in this material are for general information only and are not intended to provide specific advice or recommendations for any individual. To determine which investments may be appropriate for you, consult your financial advisor prior to investing. All performance referenced is historical and is no guarantee of future results. All indices are unmanaged and cannot be invested into directly. Guarantees apply to certain insurance and annuity products (not securities, variable or investment advisory products) and are subject to product terms, exclusions and limitations and the insurer's claims-paying ability and financial strength. Before investing, consider the investment objectives, risks, charges, and expenses of the annuity and its investment options. Please submit using the same generated coversheet for this submission number. Potential investors of 529 plans may get more favorable tax benefits from 529 plans sponsored by their own state. Consult your tax professional for how 529 tax treatments and account fees would apply to your particular situation. To determine which college saving option is right for you, please consult your tax and accounting advisors. Neither APFS nor its affiliates or financial professionals provide tax, legal or accounting advice. Please carefully consider investment objectives, risks, charges, and expenses before investing. For this and other information about municipal fund securities, please obtain an offering statement and read it carefully before you invest. Investments in 529 college savings plans are neither FDIC insured nor guaranteed and may lose value.


2022 Market Outlook
There are trends that are developing in the U.S. economy that we have not seen for decades. As inflation continues to rise at a rapid pace, we have to look back to the 1970’s as a reference point to determine how inflation could impact stocks, bonds, gold, and cash going into 2022. The most common questions that we have received from clients over the past few weeks are:

There are trends that are developing in the U.S. economy that we have not seen for decades. As inflation continues to rise at a rapid pace, we have to look back to the 1970’s as a reference point to determine how inflation could impact stocks, bonds, gold, and cash going into 2022. The most common questions that we have received from clients over the past few weeks are:
Will the stock market rally continue into 2022?
Will higher inflation derail the economy?
How will the market react to the Fed increasing interest rates in 2022?
A lesson from “The Nifty Fifty”
How will the labor shortage and supply chain issues impact the markets in 2022?
I plan to address all of these questions and more as we present our market outlook for 2022.
The Economy Will Continue to Strengthen
It’s our expectation that we will see the U.S. economy gain strength in the first half of 2022. Our economy is based primary on consumer spending and the consumer is charged with cash and ready to spend. The cash has come from record levels of government stimulus in 2020 and 2021, as well as rising wages across many sectors in the U.S. economy. Debt levels are also at historic lows as well. Due to the supply chain constraints, people could not spend the money, therefore they paid down their debt. Per the chart below, debt payments as a percent of U.S. households’ disposable income is at the lowest level in over 40 years.

Talk to any pool company and they will provide you with a clear picture of the pent- up demand. Some pool installers are fully booked through 2022 and are taking deposits for pools for 2023.
Back Orders At Record Levels
Many of the companies that we have spoken with across various industries have back orders at record levels. With back orders, the customer is already committed to buying a product from a company whether it’s a car, roof, gym equipment, etc., but they have yet to take delivery of that product. When the product is delivered, they normally submit full payment, and the company realizes the revenue. From an outlook standpoint, when companies have large back orders, it takes some of the risk off the table because it is not an “if the sales are going to be there to generate revenue” but rather “how quickly can the company deliver the product to their customers”.
Supply Chain Constraints
The answer to the question “how quickly can they deliver?” relies heavily on how fast the global supply chain can get back online going into 2022. People have been slower to return to the workforce than originally expected, which means less people at the ports to unload container ships, less truck drivers to transport the goods from the ports to the stores, and less employees in stores to stock shelves. However, we see a number of new trends that should ease these constraints in 2022:
Individuals needing to return to the workforce after depleting stimulus cash reserves
Employer offering higher wages and sign on bonuses to attract employees
A higher level of vaccination rates in children, easing childcare constraints, and allowing more parents to return to the workforce
I think the economy has largely underestimated the impact of the childcare constraints on the ability for parents to return to the workforce. If your child has a cough, even though a test may reveal that they don't have COVID, they may not be able to return to school for a few days, requiring a parent to take time off from work.
Relief At The Ports
The two main ports in the U.S are the “twin ports” in Los Angeles and Long Beach; 40% of sea freight enters the U.S. through those two ports. Both have been working around the clock to unload ships and they are making significant progress. Mario Cordero, executive director of the Port of Long Beach, stated that in mid- November there were 111 ships off the coast of California waiting to be unloaded and within two weeks that number was reduced to 61 ships. However, it takes time for the goods to get off the ship, loaded onto a truck, and delivered to stores and businesses, but the trend is going in the right direction.
Record Levels of Cash Injection
Over the past 18 months, the U.S. Government has injected more cash into our economy than any other time in history. To put this in perspective, let's compare the dollar amount of the bailout packages during the Great Recession of 2008 / 2009, to the level of cash injection over the past 18 months. In the illustration below on the left side you will see the TARP Program which was the government bailout for the banks and the housing market in 2008 / 2009. On the right, you will see all of the stimulus program that the government rolled out in 2020 / 2021 to battle COVID.

The total cost of TARP was $700 Billion.
Over the past 18 months the government has injected almost $7 Trillion…………TRILLION……into the U.S. economy. That is 10 times the TARP program that was used to rescue the US economy in 2008/2009 when we almost lost the entire U.S. banking system.
To go one more step, below is a chart of the year over year change in the M2 money supply. This allows us to see how much cash is circulating within the U.S. economy compared to the prior year going all the way back to 1980.

Look at that mountain on the righthand side of the chart. We have had recession in the past which has required the government to inject liquidity, which are illustrated by the grey areas in the chart, but nothing to the magnitude of what we have seen over the past 18 months. Just a side note, this chart does not include the recent $1.2 Trillion dollar infrastructure bill that was already passed or the $1.75 Trillion Build Back Better bill that is deck.
A lot of this cash that has been injected into the economy has not been spent yet because due to the supply chain constraints, consumers and business have not been able to spend it. As the supply chain gets back online in 2022 and 2023, consumers and businesses will be able to put this cash to work which should be a boost to the U.S. economy.
Inflation, Inflation, Inflation
The great risk to the economy as we enter 2022 is undoubtedly rising inflation. We have all seen prices rise rapidly for just about everything we buy: groceries, gas, travel, etc. The supply chain issues have made this problem worse because the less goods there are, the more expensive they become. This leads us to the main question which is:
“Will inflation subside once the supply chain gets back online or are these higher levels of inflation that we are seeing now just the beginning?”
This is the question that everyone wants the answer to but it’s too early to tell. The only thing that's going to provide us with the answer is time, so we are going to be watching these trends unfold week by week, month by month, as the data comes in during 2022. In my opinion, there is an equal chance of both scenarios playing out. Scenario one, the supply chain improves throughout 2022, increasing the supply of goods and services, which in turn stabilizes prices, and the risk of hyperinflation begins to fade. Scenario two, either the supply chain does not heal fast enough, or wage growth continues to escalate, causing inflation rates to continue to rise, forcing the Fed’s hand to raise rates more quickly.
You have to remember that inflation only begins to do damage when prices rise to levels that consumers and businesses can no longer afford. Given the historic levels of cash that have been injected into the economy, it’s our expectation that even with prices rising over the next 6 months, that may not curb the consumers ability or desire to purchase those same goods and services at higher prices.
The Fed
The Fed has two main objectives:
Keep the economy at full employment
Keep inflation within its target range of 2% - 3%
As you can see in the chart below, the CPI (Consumer Price Index) which is the Fed’s main measuring stick for inflation has risen well above the Fed’s 3% comfort zone and continues to rise.

In November, it was reported that the year over year change in CPI (inflation) was 6.9%. That’s a big number. In response to these heightened levels of inflation, the Fed has increased its timeline for decreasing the amount of bonds that it is purchasing as well as escalating the timeline for their first interest rate hike. With these changes, the Fed is intentionally tapping the brakes, so the economy does not overheat and give rise to hyperinflation like we saw in the 1970’s. But it's important to understand that every time the Fed raises interest rates, it is working against economic growth because it makes lending more expensive. Less lending normally means less spending.
This change in the Fed stance is not necessarily an end all for the stock market rally. Investors have to remember the Fed is raising rates because the economy is strong which has caused prices to rise. Historically, as long as the Fed is able to raise rates at a measured pace, the economy and the market have time to digest those small increases, and the growth trend can continue. It is when the Fed has to raise rates in large increments in a relatively short period of time, it creates more of an abrupt end to an economic expansion. Think of it this way, if the interest rate on a 30-year mortgage go from 3.25% to 3.50% it’s not going to necessary derail the housing market. But if that 30-year mortgage rate goes from 3.25% to 5% in short period of time, that could cause a huge drop in housing prices because people will no longer be able to afford the mortgage payments to purchase a house at these elevate prices.
The Nifty Fifty
Looking at that inflation chart that I showed you earlier, it’s been 30 years since the Core CPI index has been over 3%. People that just started investing within the last 30 years have not seen the impact of inflation on stock, bonds, cash, and other asset classes. The last time the U.S. economy experienced higher inflation for a prolonged period of time was the 1970’s. There are a lot of important investment lessons that we learned in the 1970’s but one of them that bears mentioning is the lesson of the “Nifty Fifty”.
The Nifty Fifty was the name given to a group of stocks in the 1970’s that were the darlings of the stock market. Companies like McDonalds, Polaroid, Disney, IBM, Johnson & Johnson were names within the Nifty Fifty. This group of stocks are similar to the FANGs that we have today which include Facebook, Amazon, Netflix, and Google.
Why the comparison? Coming out of the 1960’s there was prolonged bull market rally, similar to the one we have today, these Nifty Fifty stocks were the growth engines of the market, and as such they traded at very high valuations (P/E ratios) compared to their peers in the stock market. Many of the Nifty Fifty stocks had P/E ratios above 50 times forward earnings. To put that in perspective, right now the S&P 500 Index has a P/E of about 21x forward earnings. When higher inflation shows up, it traditionally has a larger negative impact on stocks that are trading at higher multiples compared to stock that have lower P/E ratios. This is because higher interest rates erode the present value of those future earnings that are baked into the price of those stocks. When higher inflation showed up in the 1970’s, many of stocks in the Nifty Fifty dropped by over 60%. Investors need to remember, when the economy is good and inflation is low, the market tends to care less about valuations. When inflation increase and/or the economy slows down, all of a sudden valuations will begin to matter again to investors.
I’m making this point as a word of caution; the Nifty Fifty and the FANG have a lot of similarities. Even though, at this point, I do not expect a hyper inflationary environment like the 70’s, a rise in inflation may have a similar impact on stocks trading at a higher valuation. Netflix current trades a PE of 55, Amazon (P/E 66), Microsoft (P/E 38). The market looked at the Nifty Fifty similar to how I hear investors talk about the FANG stocks now, “how can they ever go down?” Also from a psychological standpoint, investors often find it difficult to sell holdings that have made them a lot of money, and these FANG stocks have increase in value a lot over the past 10 years. There is also the tax hit that investors incur in taxable accounts when unrealize gains turn into realized gains.
To be clear, this is not a recommendation for investors to go sell of their FANG stocks, it’s about understanding the trends that have played out in history, how those trends may compare to where we are now when assessing risk, opportunity, and the investment decisions that we may face in 2022.
2022 Outlook Summary
Brining all of these variables together, we expect the first half the year to bring with it strong economic growth which should be a favorable environment for risk assets. But…….we don’t anticipate that it will be a smooth ride in 2022 for equity investors. As the Fed implements its anticipated interest rate hikes, there could be a number of selloffs throughout the year that will test the patience of investors. If inflation does not get out of control, those selloffs could be an opportunity for investors to put cash to work, as the market shakes off the scary headline risks and the growth trend continues. We expect the labor shortage and supply chain issues to improve in 2022, which should help to ease some of the inflation fears as prices begin to stabilize in 2022 and potentially drop going into 2023.
The second half of the year will depend largely on the trend of inflation. If inflation runs hotter than expected, it could begin to have an impact on consumer spending as prices rise above what consumers are willing to pay, and it could force the Fed to increase the magnitude or frequency of rate hikes in 2022. Either of those two items could potentially erase or decrease the gains the U.S. stock market may have achieved in the first half of the year.
With higher levels of volatility almost a given for 2022, investor may have to resist the urge to sell out of their stock positions and retreat to bonds or cash knowing that an inflationary environment is an enemy of both high-quality bonds and cash. Overall, investors will have to pay closer attention the economic and inflation data throughout the year to determine if pivots should be made in their investment strategy, especially as we enter the second half of the year.
About Michael……...
Hi, I’m Michael Ruger. I’m the managing partner of Greenbush Financial Group and the creator of the nationally recognized Money Smart Board blog . I created the blog because there are a lot of events in life that require important financial decisions. The goal is to help our readers avoid big financial missteps, discover financial solutions that they were not aware of, and to optimize their financial future.
DISCLOSURE: This material is for informational purposes only. Neither American Portfolios nor its Representatives provide tax, legal or accounting advice. Please consult your own tax, legal or accounting professional before making any decisions. Any opinions expressed in this forum are not the opinion or view of American Portfolios Financial Services, Inc. and have not been reviewed by the firm for completeness or accuracy. These opinions are subject to change at any time without notice. Any comments or postings are provided for informational purposes only and do not constitute an offer or a recommendation to buy or sell securities or other financial instruments. Readers should conduct their own review and exercise judgment prior to investing. Investments are not guaranteed, involve risk and may result in a loss of principal. Past performance does not guarantee future results. Investments are not suitable for all types of investors. Investment advisory services offered through Greenbush Financial Group, LLC. Greenbush Financial Group, LLC is a Registered Investment Advisor. Securities offered through American Portfolio Financial Services, Inc (APFS). Member FINRA/SIPC. Greenbush Financial Group, LLC is not affiliated with APFS. APFS is not affiliated with any other named business entity. There is no guarantee that a diversified portfolio will enhance overall returns or outperform a non-diversified portfolio. Diversification does not ensure against market risk. The opinions voiced in this material are for general information only and are not intended to provide specific advice or recommendations for any individual. To determine which investments may be appropriate for you, consult your financial advisor prior to investing. All performance referenced is historical and is no guarantee of future results. All indices are unmanaged and cannot be invested into directly. Guarantees apply to certain insurance and annuity products (not securities, variable or investment advisory products) and are subject to product terms, exclusions and limitations and the insurer's claims-paying ability and financial strength. Before investing, consider the investment objectives, risks, charges, and expenses of the annuity and its investment options. Please submit using the same generated coversheet for this submission number. Potential investors of 529 plans may get more favorable tax benefits from 529 plans sponsored by their own state. Consult your tax professional for how 529 tax treatments and account fees would apply to your particular situation. To determine which college saving option is right for you, please consult your tax and accounting advisors. Neither APFS nor its affiliates or financial professionals provide tax, legal or accounting advice. Please carefully consider investment objectives, risks, charges, and expenses before investing. For this and other information about municipal fund securities, please obtain an offering statement and read it carefully before you invest. Investments in 529 college savings plans are neither FDIC insured nor guaranteed and may lose value.

What Caused The Market To Sell Off In September?

What Caused The Market To Sell Off In September?
The stock market experienced a fairly significant drop in the month of September. In September, the S&P 500 Index dropped 4.8% which represents the sharpest monthly decline since March 2020. I wanted to take some time today to evaluate:
· What caused the market drop?
· Do we think this sell off is going to continue?
· Have the recent market events caused us to change our investment strategy?
September Is Historically A Bad Month
Looking back at history, September is historically the worse performing month for the stock market. Since 1928, the S&P 500 Index has averaged a 1% loss in September (WTOP News). Most investors have probably forgotten that in September 2020, the market experienced a 10% correction, but rallied significantly in the 4th quarter.
The good news is the 4th quarter is historically the strongest quarter for the S&P 500. Since 1945, the stock market has averaged a 3.8% return in the final three months of the year (S&P Global).
The earned income penalty ONLY applies to taxpayers that turn on their Social Security prior to their normal retirement age. Once you have reached your normal retirement age, this penalty does not apply.
Delta Variant
The emergence of the Delta Variant slowed economic activity in September. People cancelled travel plans, some individuals avoided restaurants and public events, employees were out sick or quarantined, and it delayed some companies from returning 100% to an office setting. However, we view this as a temporary risk as vaccination rates continue to increase, booster shots are distributed, and the death rates associated with the virus continue to stay at well below 2020 levels.
China Real Estate Risk
Unexpected risks surfaced in the Chinese real estate market during September. China's second largest property developer Evergrande Group had accumulated $300 billion in debt and was beginning to miss payments on its outstanding bonds. This spread fears that a default could cause issues other places around the globe. Those risks subsided as the month progressed and the company began to liquidate assets to meet its debt payments.
Rising Inflation
In September we received the CPI index report for August that showed a 5.3% increase in year over year inflation which was consistent with the higher inflation trend that we had seen earlier in the year. In our opinion, inflation has persisted at these higher levels due to:
· Big increase in the money supply
· Shortage of supply of good and services
· Rising wages as companies try to bring employees back into the workforce
The risk here is if the rate of inflation continues to increase then the Fed may be forced to respond by raising interest rates which could slow down the economy. While we acknowledge this as a risk, the Fed does not seem to be in a hurry to raise rates and recently announced plans to pare back their bond purchases before they begin raising the Fed Funds Rate. Fed Chairman Powell has called the recent inflation trend “transitory” due to a bottleneck in the supply chain as company rush to produce more computer chips, construction materials, and fill labor shortages to meet consumer demand. Once people return to work and the supply chain gets back on line, the higher levels of inflation that we are seeing could subside.
Rising Rates Hit Tech Stocks
Interest rates rose throughout the month of September which caused mortgage rates to move higher, but more recently there has been an inverse relationship between interest rates and tech stocks. As interest rates rise, tech stocks tend to fall. We attribute this largely to the higher valuations that these tech stocks trade at. As interest rates rise, it becomes more difficult to justify the multiples that these tech stocks are trading at. It is also important to acknowledge that these tech companies have become so large that the tech sector now represents about 30% of the S&P 500 Index (JP Morgan Guide to the Markets).
Risk of a Government Shutdown
Toward the end of the month, the news headlines were filled with the risk of the government shutdown which has been a reoccurring issue for the U.S. government for the past 20 years. This was nothing new, but it just added more uncertainty to the pile of negative headlines that plagued the markets in September. It was announced on September 30th that Congress had approved a temporary funding bill to extend the deadline to December 3rd.
Expectation Going Forward
Even though the Stock Market faced a pile of bad news in September, our internal investment thesis at our firm has not changed. Our expectation is that:
· The economy will continue to gain strength in coming quarters
· There is a tremendous amount of liquidity still in the system from the stimulus packages that has yet to be spent
· People will begin to return to work to produce more goods and services
· Those additional goods and services will then ease the current supply chain bottleneck
· Interest rates will move higher but they still remain at historically low levels
· The risk of the delta variant will diminish increasing the demand for travel
We will continue to monitor the economy, financial markets, and will release more articles in the future as the economic conditions continue to evolve in the coming months.
About Michael……...
Hi, I’m Michael Ruger. I’m the managing partner of Greenbush Financial Group and the creator of the nationally recognized Money Smart Board blog . I created the blog because there are a lot of events in life that require important financial decisions. The goal is to help our readers avoid big financial missteps, discover financial solutions that they were not aware of, and to optimize their financial future.
DISCLOSURE: This material is for informational purposes only. Neither American Portfolios nor its Representatives provide tax, legal or accounting advice. Please consult your own tax, legal or accounting professional before making any decisions. Any opinions expressed in this forum are not the opinion or view of American Portfolios Financial Services, Inc. and have not been reviewed by the firm for completeness or accuracy. These opinions are subject to change at any time without notice. Any comments or postings are provided for informational purposes only and do not constitute an offer or a recommendation to buy or sell securities or other financial instruments. Readers should conduct their own review and exercise judgment prior to investing. Investments are not guaranteed, involve risk and may result in a loss of principal. Past performance does not guarantee future results. Investments are not suitable for all types of investors. Investment advisory services offered through Greenbush Financial Group, LLC. Greenbush Financial Group, LLC is a Registered Investment Advisor. Securities offered through American Portfolio Financial Services, Inc (APFS). Member FINRA/SIPC. Greenbush Financial Group, LLC is not affiliated with APFS. APFS is not affiliated with any other named business entity. There is no guarantee that a diversified portfolio will enhance overall returns or outperform a non-diversified portfolio. Diversification does not ensure against market risk. The opinions voiced in this material are for general information only and are not intended to provide specific advice or recommendations for any individual. To determine which investments may be appropriate for you, consult your financial advisor prior to investing. All performance referenced is historical and is no guarantee of future results. All indices are unmanaged and cannot be invested into directly. Guarantees apply to certain insurance and annuity products (not securities, variable or investment advisory products) and are subject to product terms, exclusions and limitations and the insurer's claims-paying ability and financial strength. Before investing, consider the investment objectives, risks, charges, and expenses of the annuity and its investment options. Please submit using the same generated coversheet for this submission number. Potential investors of 529 plans may get more favorable tax benefits from 529 plans sponsored by their own state. Consult your tax professional for how 529 tax treatments and account fees would apply to your particular situation. To determine which college saving option is right for you, please consult your tax and accounting advisors. Neither APFS nor its affiliates or financial professionals provide tax, legal or accounting advice. Please carefully consider investment objectives, risks, charges, and expenses before investing. For this and other information about municipal fund securities, please obtain an offering statement and read it carefully before you invest. Investments in 529 college savings plans are neither FDIC insured nor guaranteed and may lose value.


Beware of Annuities

I’ll come right out and say “I’m not a fan of annuities”. They tend to carry:
1) Higher internal fees
2) Surrender charges that prevent investors from getting out of them
3) “Guarantees” that are inferior to alternative investment solutions
Unfortunately, annuities pay Financial Professionals a lot of money, which is why it is not uncommon for Investment Advisors to present them as a primary solution. For example, some annuities pay Investment Professionals 5% - 8% of the amount invested, so if you invest $200,000 in the annuity, the advisor gets paid $10,000 to $16,000 as soon as you deposit the money to the annuity. Compared to an Investment Advisor that may be charging you 1% per year to manage your portfolio, it will take them 5 to 8 years to earn that same amount.
To be fair, there are a few situations where I think annuities make sense, and I will share those with you in this article. In general, however, I think investors should be very cautious when they are presented with an annuity as a primary investment solution, and I will explain why.
Fixed Annuities & Variable Annuities
There are two different types of annuities. Fixed annuities and variable annuities. Within those categories, there are a lot of different flavors, such as indexed annuities, guaranteed income benefits, non-qualified, qualified, etc. Annuities are often issued by banks, investment firms, insurance companies, employer sponsored plan providers, or directly to the consumer. It is important to understand that not all annuities are the same and they can vary greatly from provider to provider. The points that I will be making in this article are my personal option based on my 20 years of experience in the investment industry.
Annuities Have High Fees
My biggest issue with annuities in general is the higher internal costs associated with them. When you read the fine print, annuities can carry:
· Commissions
· Contract fees
· Mortality expenses
· Surrender fees
· Rider fees
· Mutual fund expense ratios
· Penalties for surrender prior to age 59½
When you total all of those annual fees, it can sometimes be between 2% - 4% PER YEAR. The obvious questions is, “How is your money supposed to grow if the insurance company is assessing fees of 2% - 4% per year?”
Sub-Par Guarantees
The counter argument to this is that the insurance company is offering you “guarantees” in exchange for these higher fees. During the annuity presentation, the broker might say “if you invest in this annuity, you are guaranteed not to lose any money. It can only make money”. Who wouldn’t want that? But the gains in these annuities are often either capped each year, or get chipped away by the large internal fees associated with the annuity contract. So, even though you may not “lose money”, you may not be making as much as you could in a different investment solution.
Be The Insurance Company
At a high level, this is how insurance companies work. They sell you an annuity, then the insurance company turns around and invests your money, and hands you back a lower rate of return, often in the form of “guarantees”. That is how they stay in business. So, my question is “Why wouldn’t you just keep your money, invest it like the insurance would have, and you keep all of the gains”?
The answer: Fear. Most investments involve some level of risk, meaning you could lose money. Annuity presentations prey on this fear. They will usually show financial illustrations from recessions, such as when the market went down 30%, but the annuity lost no value. For retirees, this can be very appealing, because the working years are over and now they just have their life savings to last them for the rest of their lives.
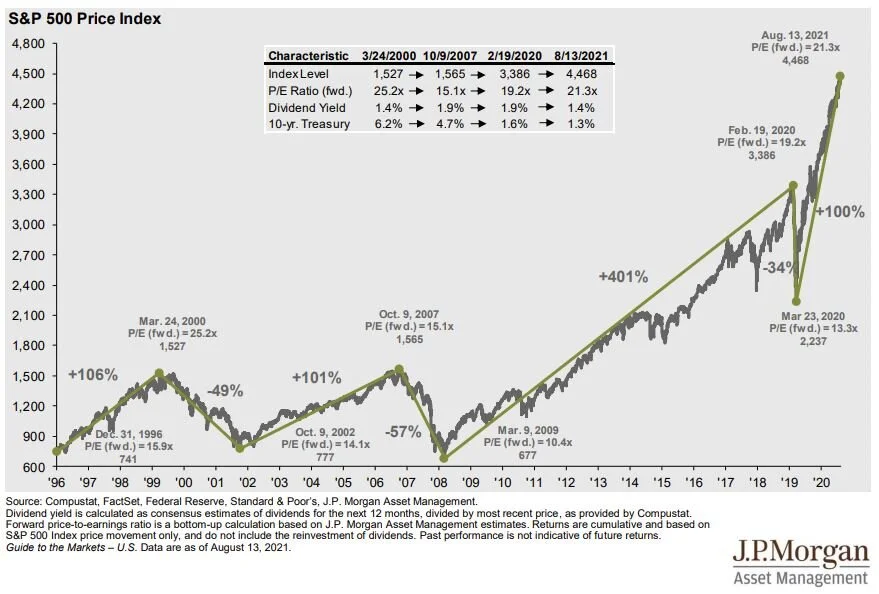
But like other successful investors, insurance companies rely on the historical returns of the stock market, which suggest that over longer periods of time (10+ year) the stock market tends to appreciate in value. See the charge of the S&P 500 Index below. Even with the pull backs and recessions, the value of the stock market has historically moved higher.
Annuity Surrender Fees Lock You In
The insurance company knows they are going to have your money for a long period of time because most annuities carry “surrender fees”. Most surrender schedules last 5 – 10 YEARS!! This means if you change your mind and want out of the annuity before the surrender period is up, the annuity company hits you with big fees. So, before you write the check to fund the annuity, make sure it’s 100% the right decision.
Do Not Invest an IRA In An Annuity
This situation always baffles me. We will come across investors that have an IRA invested in an annuity. Annuities by themselves have the advantage of being “tax deferred vehicles” meaning you do not pay taxes on the gains accumulated in the annuity until you make a withdrawal. You pay money to the insurance company to have that benefit since annuities are insurance products.
An IRA by itself is also a tax deferred account. You can choose to invest your IRA in whatever you want – cash, stocks, bonds, mutual funds, or an annuity. So, here is my question: since an IRA is already tax deferred vehicle, why would you pay extra fees to an annuity company to invest it in a tax deferred annuity? It makes no sense to me.
The answer, again, is usually fear. An individual retires, they meet with an investment advisor that recommends that they rollover their 401(k) into an IRA, and uses the fear of losing money in the market to convince them to move their full 401(k) into an annuity product. I completely understand the fear of losing money in retirement, and for some individuals it may make sense to put a portion of their retirement assets into something like an annuity that offers some guarantees. But in my experience, it rarely makes sense to invest the majority of your retirement assets in an annuity.
Guaranteed Minimum Income Benefits
Another sparkling gem associated with annuities that is often appealing to retirees are annuities that carry a GMIB, or “Guaranteed Minimum Income Benefit”. These annuities are usually designed to go up by a “guaranteed” 5% - 8% per year, and then at a set age will pay you a set monthly amount for the rest of your life. Now that sounds wonderful, but here is the catch that I want you to be aware of. For most annuity companies, the value of your annuity associated with the “guaranteed increases” only matters if you annuitize the contract with that insurance company. After 10 years, if instead you decided to surrender the annuity, you typically do not receive those big, guaranteed increases, but instead get the actual value of the underlying investments less the big fees. This is why there is often more than one “balance” illustrated on your annuity statement.
Here is the catch of the GMIB – when you go to turn it on, the annuity company decides what that fictitious GMIB balance will equal in the form of a monthly benefit for the rest of your life. Also, with some annuities, they cap the guaranteed increase after a set number of years. In general, what I have found is annuities that were issued with GMIB prior to 2008 tend to be fairly generous, because that was before the 2008/2009 recession. After 2008, the guarantees associated with these GMIB’s became less advantageous.
When Do Annuities Make Sense
I have given you the long list of reason why I am not a fan of annuities but there are a few situations where I think annuities can make sense:
1) Overspending protection
2) CD’s vs Fixed Annuity
Overspending Protection
When people retire, for the first time in their lives, they often have access to their 401(K), 403(b), or other retirement account. Having a large dollar amount sitting in accounts that you have full access to can sometimes be a temptation to overspend, make renovation to your house, go on big vacations, etc. But when you retire, when the money is gone, it is gone. For individuals that do not trust themselves to not spend through the money, turning that lump sum of money into a guaranteed money payment for the rest of their lives may be beneficial. In these cases, it may make sense for an individual to purchase an annuity with their retirement dollars, because it lowers the risk of them running out of money in retirement.
CD’s vs Fixed Annuities
For individuals that have a large cash reserve, and do not want to take any risk, sometimes annuity companies will offer attractive fixed annuity rates. For example, your bank may offer a 2 year CD at a 2%, but there may be an insurance company that will offer you a fixed annuity at a rate of 3.5% per year for 7 years. The obvious benefit is a higher interest rate each year. The downside is usually that the annuity carries surrender fees if you break the annuity before the maturity date. But if you don’t see any need to access the cash before the end of the surrender period, it may be worth collecting the higher interest rate.
Final Advice
Selecting the right investment vehicle is a very important decision. Before selecting an investment solution, it often makes sense to meet with a few different firms to listen to the approach of each advisor to determine which is the most appropriate for your financial situation. If you go into one of these meetings and an annuity is the only solution that is present, I would be very cautious about moving forward with that solution before you have vetted other options.
About Michael……...
Hi, I’m Michael Ruger. I’m the managing partner of Greenbush Financial Group and the creator of the nationally recognized Money Smart Board blog . I created the blog because there are a lot of events in life that require important financial decisions. The goal is to help our readers avoid big financial missteps, discover financial solutions that they were not aware of, and to optimize their financial future.
DISCLOSURE: This material is for informational purposes only. Neither American Portfolios nor its Representatives provide tax, legal or accounting advice. Please consult your own tax, legal or accounting professional before making any decisions. Any opinions expressed in this forum are not the opinion or view of American Portfolios Financial Services, Inc. and have not been reviewed by the firm for completeness or accuracy. These opinions are subject to change at any time without notice. Any comments or postings are provided for informational purposes only and do not constitute an offer or a recommendation to buy or sell securities or other financial instruments. Readers should conduct their own review and exercise judgment prior to investing. Investments are not guaranteed, involve risk and may result in a loss of principal. Past performance does not guarantee future results. Investments are not suitable for all types of investors. Investment advisory services offered through Greenbush Financial Group, LLC. Greenbush Financial Group, LLC is a Registered Investment Advisor. Securities offered through American Portfolio Financial Services, Inc (APFS). Member FINRA/SIPC. Greenbush Financial Group, LLC is not affiliated with APFS. APFS is not affiliated with any other named business entity. There is no guarantee that a diversified portfolio will enhance overall returns or outperform a non-diversified portfolio. Diversification does not ensure against market risk. The opinions voiced in this material are for general information only and are not intended to provide specific advice or recommendations for any individual. To determine which investments may be appropriate for you, consult your financial advisor prior to investing. All performance referenced is historical and is no guarantee of future results. All indices are unmanaged and cannot be invested into directly. Guarantees apply to certain insurance and annuity products (not securities, variable or investment advisory products) and are subject to product terms, exclusions and limitations and the insurer's claims-paying ability and financial strength. Before investing, consider the investment objectives, risks, charges, and expenses of the annuity and its investment options. Please submit using the same generated coversheet for this submission number. Thank you.
Roth Conversions In Retirement

Roth conversions in retirement are becoming a very popular tax strategy. It can help you to realize income at a lower tax rate, reduce your RMD’s, accumulate assets tax free, and pass Roth money onto your beneficiaries. However, there are pros and cons that you need to be aware of, because processing a Roth conversion involves showing more taxable income in a given year. Without proper tax planning, it could lead to unintended financial consequences such as:
· Social Security taxed at a higher rate
· Higher Medicare premiums
· Assets lost to a long term care event
· Higher taxes on long term capital gains
· Losing tax deductions and credits
· Higher property taxes
· Unexpected big tax liability
In this video, Michael Ruger will walk you through some of the strategies that he uses with his clients when implementing Roth Conversions. This can be a very effective wealth building strategy when used correctly.
About Michael……...
Hi, I’m Michael Ruger. I’m the managing partner of Greenbush Financial Group and the creator of the nationally recognized Money Smart Board blog . I created the blog because there are a lot of events in life that require important financial decisions. The goal is to help our readers avoid big financial missteps, discover financial solutions that they were not aware of, and to optimize their financial future.
DISCLOSURE: This material is for informational purposes only. Neither American Portfolios nor its Representatives provide tax, legal or accounting advice. Please consult your own tax, legal or accounting professional before making any decisions. Any opinions expressed in this forum are not the opinion or view of American Portfolios Financial Services, Inc. and have not been reviewed by the firm for completeness or accuracy. These opinions are subject to change at any time without notice. Any comments or postings are provided for informational purposes only and do not constitute an offer or a recommendation to buy or sell securities or other financial instruments. Readers should conduct their own review and exercise judgment prior to investing. Investments are not guaranteed, involve risk and may result in a loss of principal. Past performance does not guarantee future results. Investments are not suitable for all types of investors

The Impact of Inflation on Stocks, Bonds, and Cash
The inflation fears are rising in the market and we are releasing this video to help you to better understand how inflation works and the impact that is has on stock, bonds, and cash.

The inflation fears are rising in the market and we are releasing this video to help you to better understand how inflation works and the impact that is has on stock, bonds, and cash. In this video we will go over:
· How inflation works
· Recent inflation trends that are spooking the markets
· Do we have to worry about hyperinflation like in the 80’s
· How stocks perform in inflationary environments
· The risk to bonds in inflationary environments
· How cash melts due to inflation
· The Feds reaction to inflation
· Inflation conspiracy theories that are building momentum
About Michael……...
Hi, I’m Michael Ruger. I’m the managing partner of Greenbush Financial Group and the creator of the nationally recognized Money Smart Board blog . I created the blog because there are a lot of events in life that require important financial decisions. The goal is to help our readers avoid big financial missteps, discover financial solutions that they were not aware of, and to optimize their financial future.
DISCLOSURE: This material is for informational purposes only. Neither American Portfolios nor its Representatives provide tax, legal or accounting advice. Please consult your own tax, legal or accounting professional before making any decisions. Any opinions expressed in this forum are not the opinion or view of American Portfolios Financial Services, Inc. and have not been reviewed by the firm for completeness or accuracy. These opinions are subject to change at any time without notice. Any comments or postings are provided for informational purposes only and do not constitute an offer or a recommendation to buy or sell securities or other financial instruments. Readers should conduct their own review and exercise judgment prior to investing. Investments are not guaranteed, involve risk and may result in a loss of principal. Past performance does not guarantee future results. Investments are not suitable for all types of investors

The GameStop Surge: 5 Investment Lessons
In this video, we will be explaining what is driving the price surge in GameStop, AMC, and other companies in the markets. More importantly there are 5 very important investment lessons that investors can learn from the recent GameStop anomaly that we will present in the video.
In this video, we will be explaining what is driving the price surge in GameStop, AMC, and other companies in the markets. More importantly there are 5 very important investment lessons that investors can learn from the recent GameStop anomaly that we will present in the video.

About Michael……...
Hi, I’m Michael Ruger. I’m the managing partner of Greenbush Financial Group and the creator of the nationally recognized Money Smart Board blog . I created the blog because there are a lot of events in life that require important financial decisions. The goal is to help our readers avoid big financial missteps, discover financial solutions that they were not aware of, and to optimize their financial future.


The U.S. Government Debt Crisis Is Almost Here
With the massive amount of money that has been printed by the U.S. Government this year, a U.S. government debt crisis is looming. In this video we will walk you through:
With the massive amount of money that has been printed by the U.S. Government this year, a U.S. government debt crisis is looming. In this video we will walk you through:
• Probability that a debt crisis will occur
• When the U.S. Government Debt Crisis could begin
• Should you be making changes to your investment allocation?
• Possible solutions to stave off the debt crisis
• Data that we use to track the government debt trends

About Michael……...
Hi, I’m Michael Ruger. I’m the managing partner of Greenbush Financial Group and the creator of the nationally recognized Money Smart Board blog . I created the blog because there are a lot of events in life that require important financial decisions. The goal is to help our readers avoid big financial missteps, discover financial solutions that they were not aware of, and to optimize their financial future.


How The COVID Second Wave Will Impact The Stock Market
As COVID-19 cases continue to rise in the United States, it has left investors wondering what impact this could have for the stock market in coming months. In this article we are going to review
As COVID-19 cases continue to rise in the United States, it has left investors wondering what impact this could have for the stock market in coming months. In this article we are going to review:
Key Indicators To Track
Impact of A Second Full Shutdown
Chances of A Double Dip Recession
Status of Vaccines And COVID-19 Treatments
Government Stimulus Programs In The Works
Key Indicators To Track
We are not completely dismissing the traditional economic indicators such as unemployment rates, GDP, manufacturer’s index, and consumer spending habits. While we are in uncharted waters with this global pandemic, those indicators still allow us to piece together the US economy‘s timeline to recovery. However, it is hard to deny that COVID-19 tracking data such as daily infection rates will have a material impact on the decisions that investors will make in the coming months. From the experts we have spoken to, while daily infection rates would seem to be the most important, the more important data is the hospitalization rate and the number of people in the ICU.
You could potentially have a lot of people getting infected with COVID-19, but as long as they are able to recover before the virus becomes life-threatening, it would indicate that the COVID-19 treatments are working, and the health system is getting better at treating the virus in the early stages. However, if we see hospitalization rates spiking, and the number of people in the ICU increasing dramatically, that could increase the likelihood of another fall shut down in various states, extending the time to recovery.
The numbers are not great right now. The hospitalization rate is just over 80,000, which is much higher than the previous two peaks from earlier in 2020.
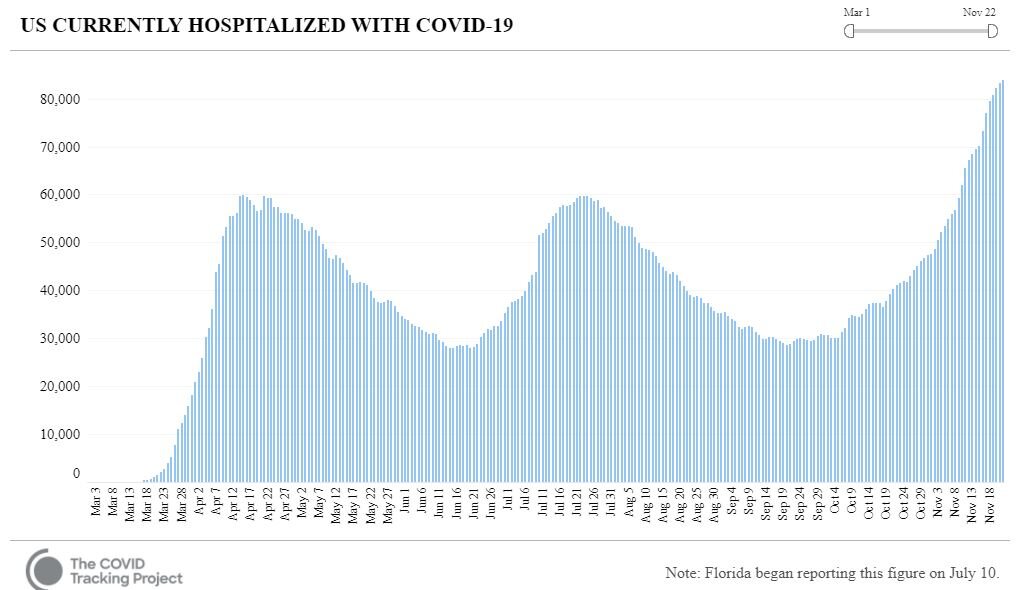
COVID 19 infection rate
If this trend continues, it could put the capacity of the US health system to the test, and it could dramatically increase the number of daily deaths that we are currently seeing from the pandemic.
Government Stimulus Programs
If the current trends continue and the US elected officials determine the best way to reverse the trend is another full shut down of the economy, US citizens and businesses would most likely need support from the government to weather a second shut down. Prior to the presidential elections, Congress was working on a second stimulus package which included another round of checks to be sent to individuals below certain income thresholds, a second round of PPP loans to businesses, state aid, and additional unemployment benefits.
A few quick notes about the stimulus programs. In the preliminary legislation, we did not see any changes to the income threshold to receive the checks from the IRS, but the amounts could potentially be different. This means if you received a check the first time, you will most likely receive a check in the second round. There were several changes made to the criteria of small businesses to receive PPP loan money. Businesses now would have to show a percentage of loss revenue during a specified period to be eligible for the second round of PPP loans. For the unemployment benefits, the primary legislation suggests that it will be a lower bonus amount than the previous $600 per week.
The largest clear and present danger to the market is if the economy goes into a second shut down and Congress is not able to agree upon terms of a second round of stimulus to aid US citizens and businesses. Time will be of the essence, and if Congress waits too long to act, irreversible damage could be done to the US economy, which may prolong the timeline to recovery.
With that said, if Congress is able to provide the economy with the aid it needs to bridge the gap between where we are now to the beginning of the post COVID-19 era, the market could respond very favorably to that environment, even though the news headlines will be ugly in the coming weeks.
The Market Is Forward-Looking
Through all of this, we must remember that the stock market is a forward-looking animal. As we have seen in the past, while the news today may be bad, if the market sees light at the end of the tunnel, it will not necessarily prompt a huge sell off knowing that relief is on the way. As COVID-19 treatments and vaccines continue to gain approval for emergency use, it could provide the market with that reinsurance by mid-2021. The US economy could be on its way to a meaningful recovery, but as I mentioned above, that also assumes that the government will be willing to step in and provide financial support if an economic shutdown takes place in the coming weeks or months.
What does this mean for investors? If you have a long time horizon, it is important to keep your long-term perspective, even though the markets may gyrate in the short term. For conservative investors, it is acknowledging that there are still a lot of variables that have yet to play out over the course of the next few months, and maintaining the appropriate balance between risk and return within their portfolio is key.
Chances of A Double Dip Recession
What are the chances that the market takes another big dive like we saw in March and April of 2020? Based on the information that we have gathered, in my personal opinion, the market could experience a sell off or two before we are on the other side of this pandemic, but I would be surprised if it is of the magnitude that we saw earlier in 2020. The reason for this being, we are most likely towards the end of this pandemic versus the beginning or the middle. During the big sell off at the beginning of 2020, the S&P 500 index dropped by 34%. The market at that point had no way to know what was on the horizon because the virus had just arrived, we were learning about it as it was spreading, and there were no treatments in the works, so the market had no way of forecasting what the timeline could be to recovery. It seems like we are in a much different environment now even though the US Economy faces the threat of a second wave.
A recession is defined as two consecutive quarters of negative GDP growth. If we get a full shutdown of the US economy in the coming weeks or months, it is not off the table that we could have a negative GDP reading for the fourth quarter of 2020 and the first quarter of 2021, technically classifying it as a double dip recession. Only time will tell.
Status of COVID-19 Vaccines And Treatments
It is encouraging that new treatments and vaccines are being approved by the FDA on almost a weekly basis. The challenge becomes the level of production needed, and the distribution of these treatments to the US population. we have to acknowledge that some of these treatments have their own challenges. One of the vaccines that was recently announced has to be stored at a negative 70 degrees Celsius, which is a lot colder then your typical commercial freezer. Special trucks would need to be built to transport it, and special freezers would have to be built and installed to house the vaccine. It also becomes a question of how long the vaccination will last, of if COVID-19 mutates, thus rendering the current vaccines less effective. There are still a lot of question marks even though there seems to be hope around the treatments that are being released now. The positive note is there is both treatments being created for those that have been infected by the virus while at the same time vaccines are being developed to help people from getting the virus in the first place. The stock market will undoubtedly be watching closely to how effective these treatments are at treating the virus, and in turn painting a picture as to the timeline did the economic recovery post COVID-19.

About Michael……...
Hi, I’m Michael Ruger. I’m the managing partner of Greenbush Financial Group and the creator of the nationally recognized Money Smart Board blog . I created the blog because there are a lot of events in life that require important financial decisions. The goal is to help our readers avoid big financial missteps, discover financial solutions that they were not aware of, and to optimize their financial future.

Which Stock Market Index Is Better To Track? The Dow or S&P 500 Index
Today, I’m going explain the difference between the Dow Jones Industrial Average (“The Dow”) and the S&P 500 Index. While both indexes are meant to be an accurate representation of the performance of the US
Today, I’m going explain the difference between the Dow Jones Industrial Average (“The Dow”) and the S&P 500 Index. While both indexes are meant to be an accurate representation of the performance of the US stock market, it’s important to understand the difference between the two.
Why is it important? This year, 2020, is a perfect example why. As I write this article on August 21, 2020, the Dow Jones industrial average is DOWN -2.80% for the year. Meanwhile, the S&P 500 index is UP 4.79% for the year. If both indexes are supposed to be accurate representations of the performance of the stock market, why is one down 2% and the other up 4%?
Special disclosure: I will be mentioning individual companies in this article to help educate you on this topic. These are not recommendations to buy, sell, or hold any of the companies mentioned.
30 companies versus 500 companies
Neither of these indexes are comprised of all of the publicly traded companies in the U.S. stock market. The sponsors of these indexes have hand selected the companies that they have chosen to represent the index. The Dow Index is only made up of 30 companies. The S&P 500 index, as the name suggests, is comprised of 500 companies.
It’s easy for the S&P 500 to win the argument that 500 companies is probably a better representation of the overall stock market versus just the 30 companies that have been hand picked to represent the Dow.
Market sectors
Sector concentration also has a big impact on the performance of these indexes. Stocks are categorized into “sectors” which groups publicly traded companies together by industry. Banks are in the “financial sector”, oil companies are in the “energy sector”, and so on. Since the Dow and the S&P 500 Index have different companies in them, they also have different sector weightings. Below are charts that compare the sector weights in the S&P 500 Index and the DJIA (Dow Jones Industrial Average). The second chart provides a summary of the difference in the sector weightings. 30 companies
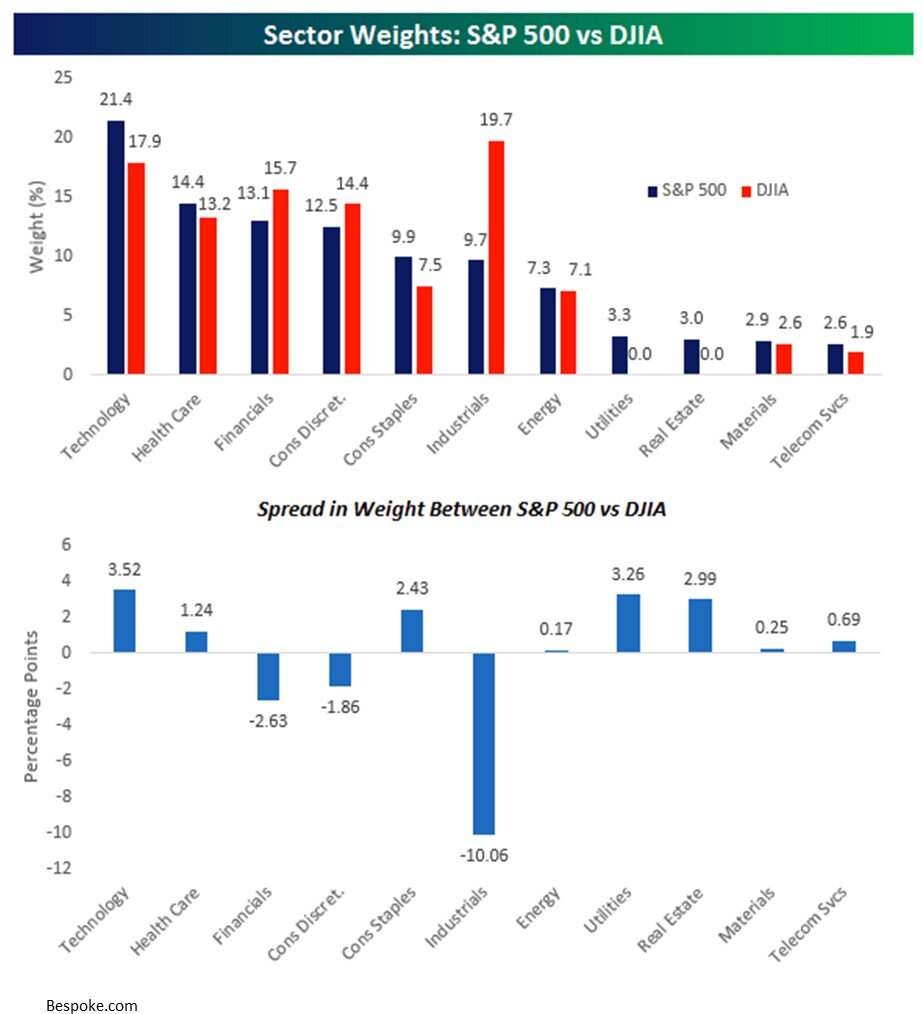
difference between S&p and dow
The largest two differences in the sector weightings between the S&P 500 Index and the Dow are Industrials and Technology. The S&P 500 Index has a higher concentration of technology stocks (Examples: Apple, Google, Amazon) and a lower concentration of Industrial Stocks (Examples: GE, Catepillar, 3M). So when tech stocks have a good year, all other things being equal, the return of the S&P 500 Index will most likely be higher than the Dow. This explains some of the deviation in the YTD return between the S&P 500 Index and the Dow Index because the technology sector is up 26% YTD while the industrial sector is down 5% YTD.
Price Weighted vs Market Cap Weighted
This is probably the most important difference between the two indexes.
The Dow Index is “Price Weighted”
The S&P 500 Index is “Market Cap Weighted”
Before I jump into the comparison, you first have to understand the pieces that make up these terms.
Stock Price
A company’s stock price is meaningless as a standalone data point. If all you told me was that Company A has a stock price of $25 and Company B has a stock price of $400, I have no idea which company is bigger, which company has performed better, or which company is cheaper to buy. The only thing that stock price tells you is the estimated value of the company divided by the number of shares outstanding.
Let me explain this in an example. I have two separate companies: Jim’s Construction Inc. worth $2M and Albany Software Inc worth $1M. Both companies decide to go public. When a company “goes public”, the ownership of the company moves from the handful of individual private owners to whoever owns the shares of the stock being issued. The company that is going public decides how many shares of stock that it wants to issue. In this example let’s say Albany Software only wants to offer 1,000 shares of stock but Jim’s Construction wants to issue 200,000 shares of stock. Remember, stock price is determined by the value of the company divided by the number of shares issued:
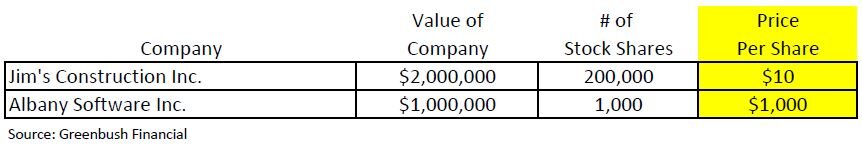
dow vs S&p
When these two companies go public, Jim’s Construction will have a stock price of $10 per share and Albany Software will have stock price of $1,000 per share. If I showed a group of amateur investors just the stock price of each company and asked them:
Which company is bigger?
Which company is more expensive to buy today?
Which company would you have liked to own 5 years ago?
Most people would answer Albany Software with a stock price of $1,000 per share. When the truth is Jim’s Construction is actually twice the size of Albany Software, both stocks are priced at their fair market value so one is not necessarily more expensive than the other, and assuming these companies went public 5 years ago, there is no way to know which stock has performed better. Maybe 5 years ago Jim’s Construction was trading at $2 per share resulting in a 400% gain versus Albany Software that was trading at $800 per share 5 years ago, only representing a 25% gain.
Market Cap
A company’s “market cap” is just another way of determining the total value of the company. Market cap is calculated by multiplying the number of shares outstanding by the current stock price. If you wanted to compare the size of Apple vs Google:
Apple Stock Price $473 x 4.2 Billion Shares = $2.02 Trillion market cap
Google Stock Price $1,581 x 676 Million Shares = $1.07 Trillion market cap
Again, even through Apple has a much lower stock price than Google, the total value of Apple is twice that of Google.
The Most Important Difference Between S&P & Dow
With that investment lesson under our belts, we are now ready to go full circle back so I can explain why the Dow Index being “Price Weighted” and the S&P 500 Index being “Market Cap Weighted” is so important.
The Dow Jones Index is Price Weighted
Remember the Dow Index is only made up of 30 stocks. When you hear on the news that the Dow Index went up 300 points today or was down 700 points yesterday, the sponsors of the Dow are running a price weighted calculation of the 30 companies within the index. The calculation is simple, it’s just the price per share of each stock divided by a common divisor (historically the number of stocks in the index).
The problem with this calculation, as we discussed above, is that it completely ignores the size or “market cap” of the company. If Apple and Joe’s Construction Inc. both have a share price of $400 per share, should they really be weighted equally in the index? I would argue no, but in the Dow Jones Index they would be weighted equally in index.
The S&P 500 Index is Market Cap Weighted
The S&P 500 Index on the other hand is market cap weighted. The index is made up of the 500 largest U.S. publicly traded companies. Within the index, the larger companies have a bigger impact on performance of the index because each company’s weight in the S&P Index is calculated by taking the market cap of the company divided by the total market cap of all 500 companies in the index.
Since the S&P 500 Index has a larger number of companies and ranks the companies by size within the index, I would argue that the S&P 500 Index is the more appropriate index to track for purposes of determining the true performance of the U.S. stock market.
Tips for Tracking The Indexes
The media likes to report on the Dow because the price movement numbers are bigger and it grabs attention. If both the Dow and the S&P 500 drop by 2% in a single day, that equates to a 554 point drop in the Dow and a 67 point drop in the S&P 500 Index. What grabs more attention?
“Market drops by 554 point!!” or “Market drops by 67 points”
But it’s not uncommon, for all of the reasons that we discussed, for the day-to-day performance of the Dow and S&P 500 Index to be different. One or two companies can have a large impact on the Dow Index and push it up or down for the day which is less likely within the S&P 500 Index because there are 500 companies within the index all moving in their various directions.
I also encourage you to track “percentages” and not “point” movements. The Dow falling by 500 points sounds horrible but you have to remember that the Dow index is currently at 27,739, so a 500 point move only represents a 1.8% change. Back in 2010, when the Dow Index was at 10,000, a 500 point drop was more meaningful because it represented a 5% drop in the index. Just something to keep in mind with both the Dow and the S&P 500 Index at these higher levels.
Remember: Track the S&P 500 Index not the Dow and measure the daily movements in percentages not points. 30 stocks

Michael Ruger
About Michael……...
Hi, I’m Michael Ruger. I’m the managing partner of Greenbush Financial Group and the creator of the nationally recognized Money Smart Board blog . I created the blog because there are a lot of events in life that require important financial decisions. The goal is to help our readers avoid big financial missteps, discover financial solutions that they were not aware of, and to optimize their financial future.
