Which Stock Market Index Is Better To Track? The Dow or S&P 500 Index
Today, I’m going explain the difference between the Dow Jones Industrial Average (“The Dow”) and the S&P 500 Index. While both indexes are meant to be an accurate representation of the performance of the US stock market, it’s important to understand the difference between the two.
2024, is a perfect example why. In 2024, the Dow Jones industrial average was up 12% for the year. Meanwhile, the S&P 500 index was up 25% for the year. If both indexes are supposed to be accurate representations of the performance of the stock market, why is one up 12% and the other up 25%?
Special disclosure: I will be mentioning individual companies in this article to help educate you on this topic. These are not recommendations to buy, sell, or hold any of the companies mentioned.
30 companies versus 500 companies
Neither of these indexes are comprised of all of the publicly traded companies in the U.S. stock market. The sponsors of these indexes have hand selected the companies that they have chosen to represent the index. The Dow Index is only made up of 30 companies. The S&P 500 index, as the name suggests, is comprised of 500 companies.
It’s easy for the S&P 500 to win the argument that 500 companies is probably a better representation of the overall stock market versus just the 30 companies that have been hand picked to represent the Dow.
Market sectors
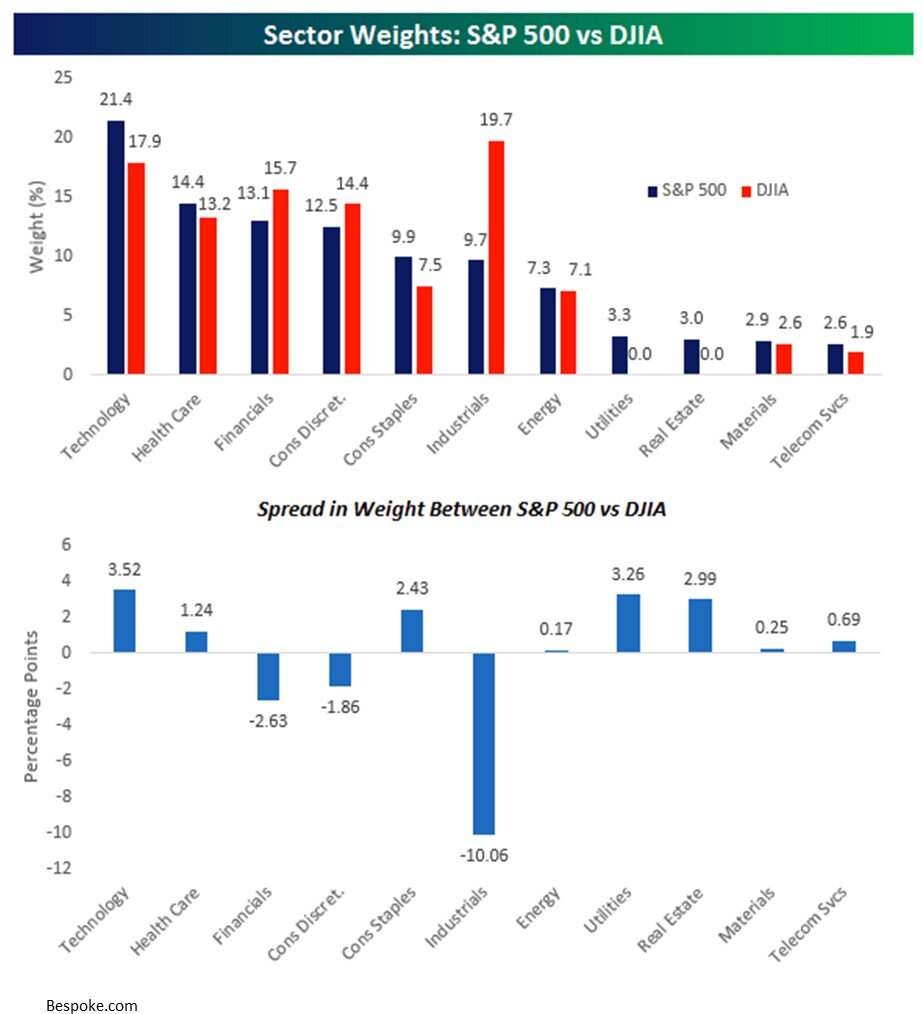
Sector concentration also has a big impact on the performance of these indexes. Stocks are categorized into “sectors” which groups publicly traded companies together by industry. Banks are in the “financial sector”, oil companies are in the “energy sector”, and so on. Since the Dow and the S&P 500 Index have different companies in them, they also have different sector weightings. Below are charts that compare the sector weights in the S&P 500 Index and the DJIA (Dow Jones Industrial Average). The second chart provides a summary of the difference in the sector weightings. 30 companies
difference between S&p and dow
The largest two differences in the sector weightings between the S&P 500 Index and the Dow are Industrials and Technology. The S&P 500 Index has a higher concentration of technology stocks (Examples: Apple, Google, Amazon) and a lower concentration of Industrial Stocks (Examples: Boeing, Caterpillar, 3M). So when tech stocks have a good year, all other things being equal, the return of the S&P 500 Index will most likely be higher than the Dow. This explains some of the deviation in the 2024 return between the S&P 500 Index and the Dow Index because the technology sector was up 36% in 2024 while the industrial sector was up 17%.
Price Weighted vs Market Cap Weighted
This is probably the most important difference between the two indexes.
• The Dow Index is “Price Weighted”
• The S&P 500 Index is “Market Cap Weighted”
Before I jump into the comparison, you first have to understand the pieces that make up these terms.
Stock Price
A company’s stock price is meaningless as a standalone data point. If all you told me was that Company A has a stock price of $25 and Company B has a stock price of $400, I have no idea which company is bigger, which company has performed better, or which company is cheaper to buy. The only thing that stock price tells you is the estimated value of the company divided by the number of shares outstanding.
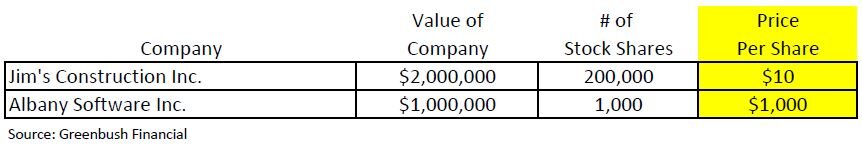
Let me explain this in an example. I have two separate companies: Jim’s Construction Inc. worth $2M and Albany Software Inc worth $1M. Both companies decide to go public. When a company “goes public”, the ownership of the company moves from the handful of individual private owners to whoever owns the shares of the stock being issued. The company that is going public decides how many shares of stock that it wants to issue. In this example let’s say Albany Software only wants to offer 1,000 shares of stock but Jim’s Construction wants to issue 200,000 shares of stock.
dow vs S&p
Dow vs S&P
When these two companies go public, Jim’s Construction will have a stock price of $10 per share and Albany Software will have stock price of $1,000 per share. If I showed a group of amateur investors just the stock price of each company and asked them:
• Which company is bigger?
• Which company is more expensive to buy today?
• Which company would you have liked to own 5 years ago?
Most people would answer Albany Software with a stock price of $1,000 per share. When the truth is Jim’s Construction is actually twice the size of Albany Software, both stocks are priced at their fair market value so one is not necessarily more expensive than the other, and assuming these companies went public 5 years ago, there is no way to know which stock has performed better. Maybe 5 years ago Jim’s Construction was trading at $2 per share resulting in a 400% gain versus Albany Software that was trading at $800 per share 5 years ago, only representing a 25% gain.
Market Cap
A company’s “market cap” is just another way of determining the total value of the company. Market cap is calculated by multiplying the number of shares outstanding by the current stock price. If you wanted to compare the size of Apple vs Meta:
Apple Stock Price $300 × 14.9 Billion Shares = $4.40 Trillion market cap
Meta Stock Price $615 × 2.5 Billion Shares = $1.56 Trillion market cap
Again, even through Apple has a much lower stock price than Meta, the total value of Apple is nearly twice that of Meta.
The Most Important Difference Between S&P & Dow
With that investment lesson under our belts, we are now ready to go full circle back so I can explain why the Dow Index being “Price Weighted” and the S&P 500 Index being “Market Cap Weighted” is so important.
The Dow Jones Index is Price Weighted
Remember the Dow Index is only made up of 30 stocks. When you hear on the news that the Dow Index went up 300 points today or was down 700 points yesterday, the sponsors of the Dow are running a price weighted calculation of the 30 companies within the index. The calculation is simple, it’s just the price per share of each stock divided by a common divisor (historically the number of stocks in the index).
The problem with this calculation, as we discussed above, is that it completely ignores the size or “market cap” of the company. If Apple and Joe’s Construction Inc. both have a share price of $400 per share, should they really be weighted equally in the index? I would argue no, but in the Dow Jones Index they would be weighted equally in index.
The S&P 500 Index is Market Cap Weighted
The S&P 500 Index on the other hand is market cap weighted. The index is made up of the 500 largest U.S. publicly traded companies. Within the index, the larger companies have a bigger impact on performance of the index because each company’s weight in the S&P Index is calculated by taking the market cap of the company divided by the total market cap of all 500 companies in the index.
Since the S&P 500 Index has a larger number of companies and ranks the companies by size within the index, I would argue that the S&P 500 Index is the more appropriate index to track for purposes of determining the true performance of the U.S. stock market.
Tips for Tracking The Indexes
The media likes to report on the Dow because the price movement numbers are bigger and it grabs attention. If both the Dow and the S&P 500 drop by 2% in a single day, that equates to an 846 point drop in the Dow and a 120 point drop in the S&P 500 Index. What grabs more attention?
“Market drops by 846 points!!” or “Market drops by 120 points”
But it’s not uncommon, for all of the reasons that we discussed, for the day-to-day performance of the Dow and S&P 500 Index to be different. One or two companies can have a large impact on the Dow Index and push it up or down for the day which is less likely within the S&P 500 Index because there are 500 companies within the index all moving in their various directions.
I also encourage you to track “percentages” and not “point” movements. The Dow falling by 500 points sounds horrible but you have to remember that the Dow index is currently at 49,600, so a 500 point move only represents a 1% change. Back in 2010, when the Dow Index was at 10,000, a 500 point drop was more meaningful because it represented a 5% drop in the index. Just something to keep in mind with both the Dow and the S&P 500 Index at these higher levels.
Remember: Track the S&P 500 Index not the Dow and measure the daily movements in percentages not points. 30 stocks

Michael Ruger
About Michael……...
Hi, I’m Michael Ruger. I’m the managing partner of Greenbush Financial Group and the creator of the nationally recognized Money Smart Board blog . I created the blog because there are a lot of events in life that require important financial decisions. The goal is to help our readers avoid big financial missteps, discover financial solutions that they were not aware of, and to optimize their financial future.
Last updated June, 2026