The Stock Market Dropped 800 Points Today. Is This A Warning Sign?

There was a large sell off in the stock market today. The Dow, S&P 500, and Nasdaq all dropped by over 3% in today’s trading session. After a long bull rally, big drops in the stock market often lead investors to the question: “Is this big drop in the market the beginning of something worse to come?” To answer that question, you have to identify what changed and more importantly what did not change in the economy and the markets over the past two weeks.
Interest Rates Have Spiked
If there is a single indicator or event that we can point to that has triggered the recent sell-off, it would be the dramatic rise in interest rates. Between September 17th and October 10th, the yield on a 10 year government bond went from 3% to 3.23%. Now that may not sound like a big move but interest rates on a 10 year bond moving by 0.23% in less than a month is a big move.
When interest rates go higher, it increases the cost associated with borrowing money. Mortgage News Daily reported yesterday that the average interest rate on a 30-year fixed mortgage is currently at 5% compared to just below 4% a year ago. As interest rates move higher, it may prevent some individuals from being able to finance a mortgage, get a car loan, or it may cause a business to forgo taking that loan to expand their business.
When interest rates rise gradually as they have over the past three years it historically does not prompt a big sell off because those higher rates are slowly integrated into the economy. The yield on the 10 Year Treasury bottomed in May 2016 at 1.46% and has been steadily climbing ever since. In May 2018, the 10 Year Treasury Bond was yielding around 2.80% so it took 2 years from the yield to go up by 1.34% compared to the 0.23% jump that we experience over the past 2 weeks.
Will The Rise In Rates Continue?
We could see a further rise in rates over the next few weeks but at this point, we have probably seen the majority of the big move up. Even though the Fed is expected to raise rates in December and possibly three to four times in 2019, there are other forces at work that are anchoring our rates to lower levels.
The first being the lower level of global interest rates. As you will see on the chart below, as of September 30, 2018, the U.S. is issuing 10 year bonds at 3.46%. When you look at other “credit worthy” counties like Germany, they are issuing their 10 year bonds at 0.69%. So when foreign countries have cash to park, they will gladly take the 3.46% interest rate for 10 years as opposed to 0.69% for 10 years. This makes the demand for US debt high around the global and we are not pressured to issue our debt at higher rates to entice buyers because our rates are already a lot higher than debt being issued by other governments around the world.
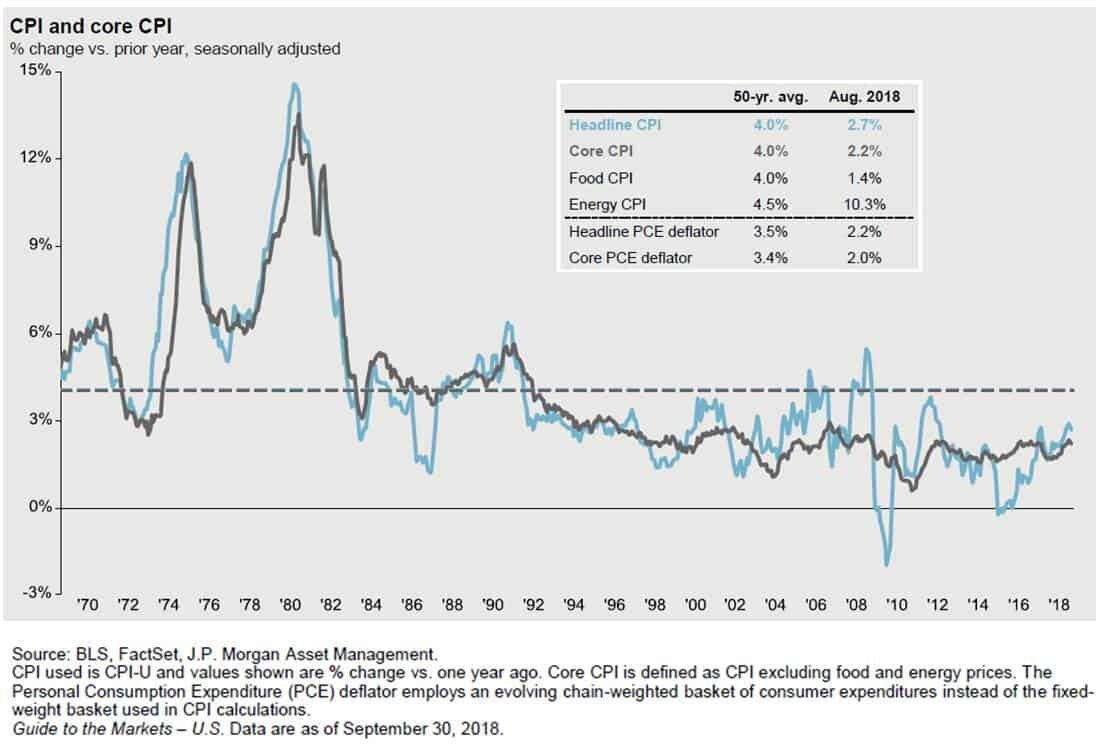
The second reason that rates are most likely to remain at lower levels over the next few months is tame inflation. When inflation rises above the Fed’s 2% target rate, they often respond by raising the Fed Funds Rate either more frequently or by larger increments. As you will see in the chart below, the annual year over year change in the core Consumer Price Index (CPI) as of August 2018, which is the Fed’s primary measure of inflation, was only up 2.2%. Very close to the Fed’s target range so the Fed is not behind the inflation curve. If inflation was roaring ahead at 3% or higher it would probably prompt the Fed to raise the Fed Funds rate faster than the market expects.
Rates Are Still At Healthy Levels
Even though interest rates are rising, they are still at historically low levels. Which then prompts the question: “At what level do interest rates become problematic?” If we use history as a guide, it would seem that once the yield on the U.S. 10 year treasury bond reach 4.50%, returns from the stock market come under pressure in the two year following the breach of that threshold. But historically, when rate are where they are now and moving higher, the stock market has traditionally moved higher as interest rates were rising.
See the chart below which illustrated the correlation between interest rates and stock prices. Each dot on this chart represents a 2 year return from the stock market between 1963 and 2018. If there is a positive correlation, that means interest rates are moving higher and stock prices are moving higher at the same time. This is illustrated with a dot placed above the line in the chart. Those are favorable environments and it makes sense because in the early stages of a rising rate environment the Fed is raising rates because the economy is healthy but rates are not higher enough yet where they are harming the growth rate of the economy.
Visa versa when the dots are below the line that means that there is a negative correlation between interest rates meaning interest rates are going up and stock prices are going down.

If you look at where 3.25% would be on the x axis you will not see any dots below the line. That would imply that between 1963 – 2018 when the interest rate on the 10 year treasury bond were at the current level and moving higher, two years later stock prices were always higher. Otherwise you would see a dot below the line. If the stock market were to be lower 2 years from now and interest rates are at their current rates and moving higher, it would be the first time that has ever happened within the last 55 years.
Could stock prices be lower 2 year from now? Sure they could but if you use history as a guide, it would suggest that such an event would have a low probability of occurrence.
Conclusion
As of right now, it would seem that the recent sell-off in the U.S. stock market was triggered by an unexpected rise in interest rates over the past two week. While higher interest rates are often revered as an unwelcome guest to bull markets, history would suggest that interest rates have not reached levels that would prompt an end to the current economic expansion. We would also add that there are other forces at work such as tame inflation rates and a lower global interest rate environment that may prevent a further dramatic increase in rates from the current levels.

About Michael……...
Hi, I’m Michael Ruger. I’m the managing partner of Greenbush Financial Group and the creator of the nationally recognized Money Smart Board blog . I created the blog because there are a lot of events in life that require important financial decisions. The goal is to help our readers avoid big financial missteps, discover financial solutions that they were not aware of, and to optimize their financial future.


