

2023 Market Outlook: A New Problem Emerges
While the markets are still very focused on the battle with inflation, a new problem is going to emerge in 2023 that is going to take it’s place. The markets have experienced a relief rally in November and December but we expect the rally to fade quickly going into 2023.
While the markets are still very focused on the battle with inflation, a new problem is going to emerge in 2023 that is going to take its place. The markets have experienced a relief rally in November and December, but we expect the rally to fade quickly going into 2023.
Inflation Trend and Fed Policy
I’m writing this article on December 15, 2022, and this week, we received the inflation reading for November and the Fed’s 0.50% interest rate hike. Headline CPI, the primary measure of inflation, dropped from 7.7% in October to 7.1% in November which is a meaningful decline, most likely signaling that peak inflation is behind us. So why such a grim outlook for 2023? One word……History. If you look at the historical trends of meaningful economic indicators and compare them to what the data is telling us now, the message to us is it will be nothing short of a Christmas miracle for the U.S. economy to avoid a recession in 2023.
The Inflation Battle Will Begin at 5%
While it's encouraging to see the inflation rate dropping, the true battle will begin once the year-over-year inflation rate measured by headline CPI reaches the 5% - 6% range. Inflation most likely peaked in June 2022 at 9% and dropped to 7.1% in November, but remember, the Fed’s target range for inflation is 2% - 3%, so we still have at least another 4% to go.
RECESSION RISK #1: If you look back through U.S. history, the Fed has never successfully reduced the inflation rate by more than 2% WITHOUT causing a recession. We have already dropped by 2%, and we still have another 4% to go.
I expect the next 3 months to show meaningful drops in the inflation rate and would not be surprised if we are in a 5% - 6% range by March or April, largely because supply chains have healed, the economy is slowing, the price of oil has come down substantially, and the job market is beginning to soften. But once we get down to the 5% - 6% range, we could see slow progress, which could end the party for investors that are stilling in the bull rally camp.
The Wage Growth Battle
We expect progress to be halted because of the shortage of supply of workers in the labor force, which will keep wages persistently higher, allowing the US consumer to keep paying higher prices for goods and services, which will leave us with higher interest rates for longer. Every time Powell has spoken over the past few months (the head of the Federal Reserve), he expresses his concerns that wages remain far too high. The solution is simple but ugly. The Fed needs to continue to apply pressure on the economy until the unemployment rate begins to rise which will bring wage growth level down to a level that will allow them to reach their 2% - 3% target inflation range.
Companies Are Reluctant To Let Go of Employees
Since one of the major issues plaguing US businesses is trying to find employees, companies will be more reluctant to let go of employee with the fear that they will need them once the economy begins to recover. This situation could create an abrupt spike and the unemployment rate when companies are finally forced to give in all at once to the reality that they will need to shed employees due to the slowing economy.
Rising Unemployment
Another lesson from history, if you look back at the past 9 recessions, how many times did the stock market bottom BEFORE the recession began? Answer: ZERO. So, if you think the bottom is already in the stock market but you also believe that there is a high probability that the U.S. economy will enter a recession in 2023, you are on the wrong side of history.
When we look back at the past 9 recessions, there is a common trend. As you would expect, when the economy begins to contract, people lose their jobs, which causes the unemployment rate to rise. In all of the past 9 recessions, the stock market did not bottom until AFTER the unemployment rate began to rise. If you think there is a high probability that the unemployment rate will rise in 2023, which is what the Fed is targeting to bring down wage growth, then we most likely have not seen the market bottom in this bear market cycle.
JP Morgan has a great chart summarizing this point across the past 9 recessions. While it looks like a lot is going on in this illustration, each chart shows one of the past 9 recessions.
The Purple Line = Unemployment Rate
The Black Straight Line = Where the stock market bottomed
The Gray Area = The recession
In each of the charts below, observe how the purple line begin to rise and then the solid black line follows in each chart. That would support the trend that the bottom in the stock market historically happens after the unemployment rate begin it’s climb which has not happened yet.

A New Problem Will Emerge
While the markets have been super focused on inflation in 2022, a new problem is going to surface in 2023. The economy is going to trade its inflation problem for the reality of a weakening U.S. consumer.
The Fed will be successful at slowing down the economy via their rate hikes, which will eventually lead to job losses, weakness in the housing market, a slowdown in consumer spending on goods and travel, and less capital spending. Those forces should be enough to deliver the two quarters of negative GDP growth in 2023, which would coincide with a recession.
The Fed Will Have Its Hands Tied
Normally, when the economy begins to contract, the Fed will step in and begin lowering interest rates to restart economic growth. However, if the inflation rate, while moving lower, is still between 4% and 5% when the economic slowdown hits, the Fed will not be able to come to the economy’s aid with fear that premature reductions in the fed funds rate could reignite inflation which is exactly what happened in the 1970s.
The recession itself will eventually bring inflation down to the Feds 2% inflation target, but while it’s happening, it’s going to feel like you are watching a train wreck in slow motion, but you can’t do anything about it. Not a great environment for the stock market.
Length of the recession
The next question I receive is, do we expect a mild recession or severe recession? I’ll be completely honest, it’s impossible to know. A lot will depend on the timing of when the economy begins to contract and where the rate of inflation is. The longer it takes inflation to get down to the 2% range while the economy contracts, the longer and more severe the recession will be. This absolutely could end up being a mild recession but there’s no way to know that sitting here in December 2022, looking at all of the challenges that lie ahead for the markets in 2023.
An Opportunity For Bonds
Due to the rising interest rates in 2022, the bond market has had one of the worst years in history. Below is a chart showing the annual returns of the aggregate bond index going back to 1970.

We have never seen a year where bonds are down 11% in a single year. It’s our expectation that this trend will reverse course in 2023. When interest rates stop rising, the Fed pauses and eventually begins lowering rates, that should be a positive environment for fixed-income returns. Where bonds failed to give investors any type of safety net in 2022, I think that safety net will return in 2023. We are already beginning to see evidence of interest rates moving lower, with the 10-year US Treasury yields moving from 4.2% down to the current rate of 3.5% over the past 45 days.
Warnings From The Inverted Yield Curve
While a number of the economic indicators that we watching are flashing red going into 2023, there are very few that tell the story better than the inverted yield curve. Without getting into all the technical details about what an inverted yield curve is, the simple version of this explanation is, it's basically the bond market telling the stock market that trouble is on the horizon. Historically, when the yield curve inverts, The US economy enters a recession within the next 6 to 18 months. See below, a chart of the yield curve going back to 1970.
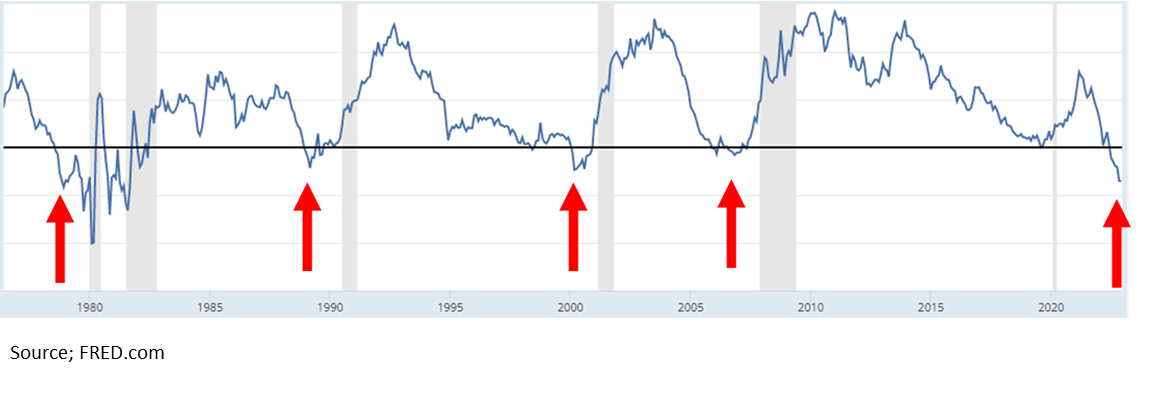
Each of the red arrows is where the yield curve inverts. The gray areas on the chart are the recessions. You can see very quickly how consistent the yield curve inversion has been at predicting recessions over time. If you look on the far right-hand side of the chart, that red arrow is where we are now, heavily inverted. So if you believe that we are not going to get a recession within the next 6 to 18 months, you are sitting heavily on the wrong side of history and have adopted a “this time it's different” mentality which can be dangerous. History tends to repeat itself more times than people like to admit.
Proactive investment decisions
Going into 2023, I think it's very important to be realistic about your expectations for the equity markets, given the headwinds that we face. This market environment is going to require very proactive investment decisions and constant monitoring of the economic data as we receive it throughout the year. A mild recession is entirely possible. If we end up in a mild recession, inflation drops down into the Feds comfort range due to the contracting economy, and the Fed can begin lowering rates before the end of 2023, that could put a bottom in the stock market, and the next bull market rally could emerge. But it's just too early to know that sitting here in December 2022 with a lot of headwinds facing the market.

About Michael……...
Hi, I’m Michael Ruger. I’m the managing partner of Greenbush Financial Group and the creator of the nationally recognized Money Smart Board blog . I created the blog because there are a lot of events in life that require important financial decisions. The goal is to help our readers avoid big financial missteps, discover financial solutions that they were not aware of, and to optimize their financial future.


When Do Higher Interest Rates Become Harmful To The Stock Market?
On Friday, the jobs report came out and it was a strong report. The consensus was expecting 180,000 new jobs in January and the actual number released on Friday ended up being 200,000. So why did the markets drop? The answer: wage growth. The jobs report not only contains how many new employees were hired but it also includes the amount

On Friday, the jobs report came out and it was a strong report. The consensus was expecting 180,000 new jobs in January and the actual number released on Friday ended up being 200,000. So why did the markets drop? The answer: wage growth. The jobs report not only contains how many new employees were hired but it also includes the amount that wages for the current workforce either increased or decreased on a year over year basis. The report on Friday indicated that wages went up by 2.9% year over year. That is the strongest wage growth number since 2009.
Double Edged Sword
Wage growth is a double edged sword. On the positive side, when wages are going up, people have more money in their paychecks which allows them to spend more and consumer spending makes up 70% of our GDP in the United States. I'm actually surprised the market did not see this coming. The whole premise behind tax reform was "if we give U.S. corporations a tax break, they will use that money to hire more employees and increase wages." The big question people had with the tax reform was "would the trickle down of the dollars saved by the corporations eventually make it to the employees pockets?" Many corporations in January, as a result of tax reform, announced employee bonuses and increases to the minimum wage paid within their organizations. The wage growth number on Friday would seem to imply that this is happening. So again, I'm actually surprised that the market was not ready for this and while the market reacted negatively I see this more as a positive long term trend, instead of a negative one. If instead the U.S. corporations decided not to give the bonuses or increase wages for employees and just use the money from the tax reform savings to increase dividends or share buybacks, then you probably would have seen only a moderate increase in the wage growth number. But that also would imply that there would be no "trickle down" effect to the middle class.
The Downside
This all sounds really positive but what is the downside to wage growth? While wage growth is good for employees, it's bad for corporate earnings. If I was paying Employee A $50,000 in 2017 but now I'm paying them $55,000 per year in 2018, assuming the output of that employee did not change, the expenses to the company just went up by $5,000 per year. Now multiply that over thousands of employees. It's a simple fact that higher expenses without higher output equals lower profits.
Wage Growth = Inflation
There is another downside to wage growth. Wage growth is the single largest contributor to inflation. Inflation is what we use to measure the increase in the price of goods and services in the U.S.. Why are these two measurements so closely related? If your salary just increased by $300 per month, when you go to the grocery store to buy milk, you may not notice that the price of milk went up by $0.15 over last week because you are making more in your paycheck. That is inflation. The price of everything starts going up because, in general, consumers have more take home pay and it gives the sellers of goods and services more pricing power. Visa versa, when the economy is in a recession, people are losing their jobs, and wages are decreasing. If you sell cars and you decided to raise the price of the cars that you sell, that may cause the consumer to not buy from you and look for a lower priced alternative. Companies have less pricing power when the economy is contracting and you typically have "deflation" not inflation.
When Does Inflation Become Harmful?
Some inflation is good. It means the economy is doing well. A rapid increase in inflation is bad because it forces the Fed to use monetary policy to slow down the economy so it does not over heat. The Fed uses the Federal Funds Rate as their primary tool to keep inflation in check. When inflation starts heating up, the Fed will often raise the Fed Funds Rate to increase the cost of lending which in turn reduces the demand for lending. It’s like tapping the brakes in your car to make sure you do not accelerate too quickly and then go flying off the road.
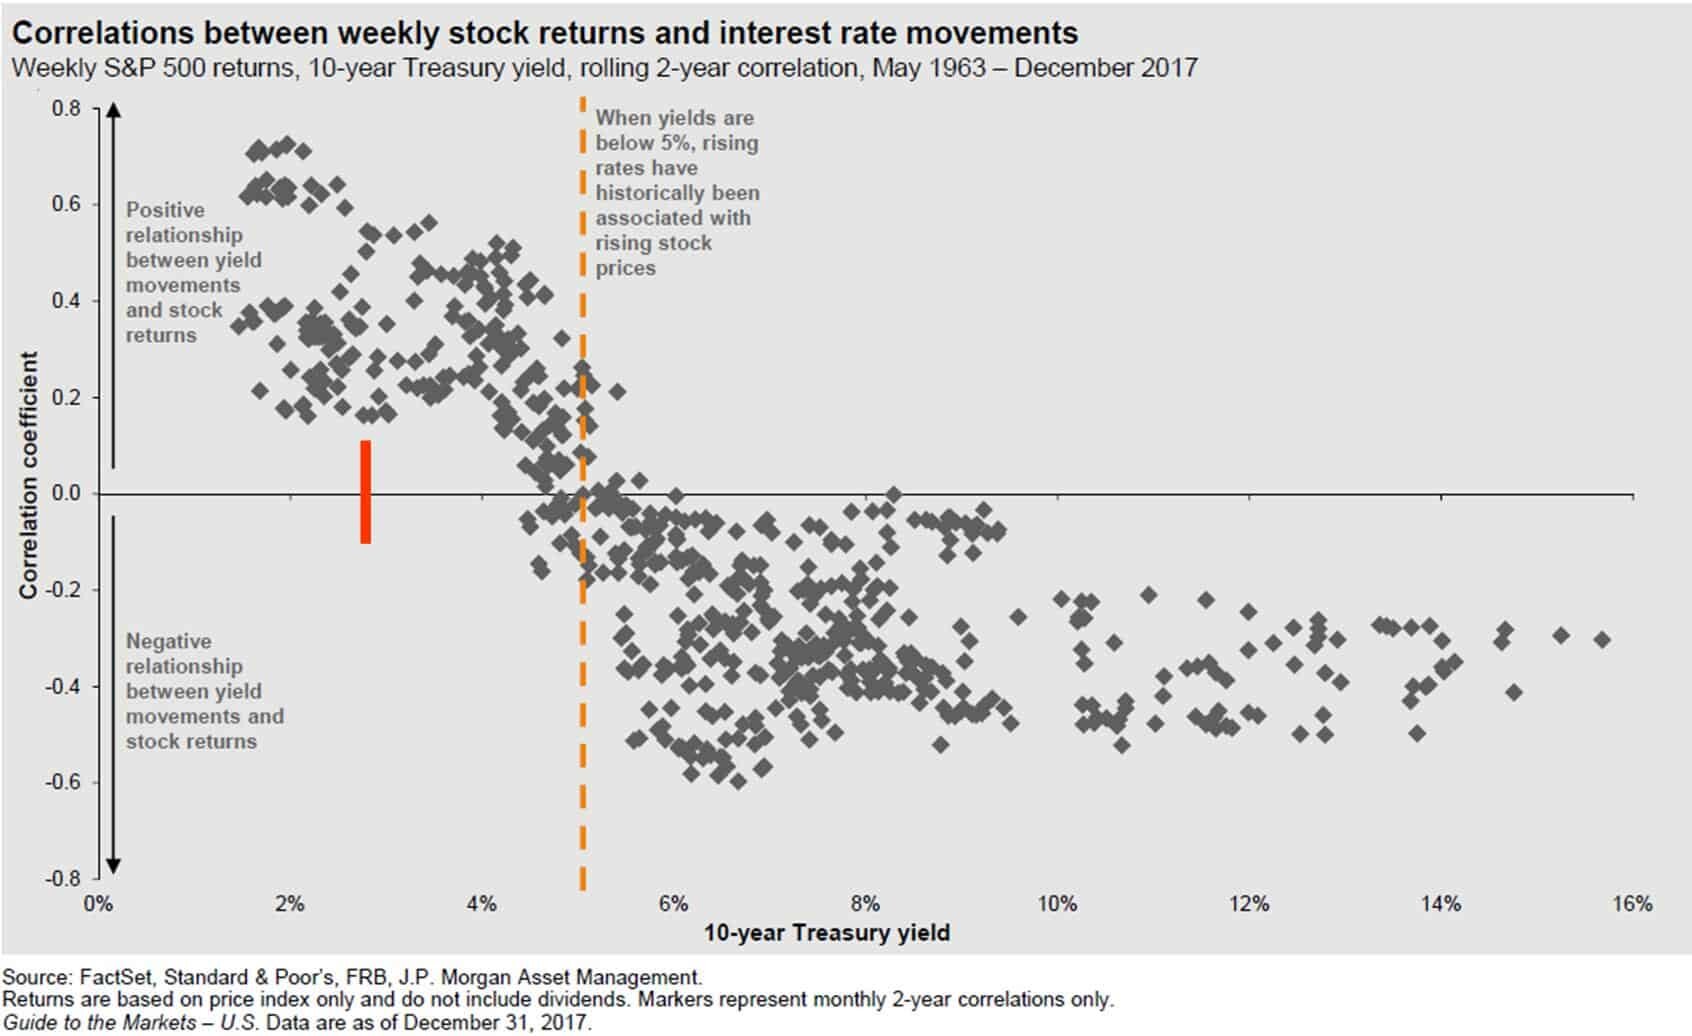
If some inflation is good but too much inflation is bad, the question is at what point do higher interest rates really jeopardize economic growth? The chart below provides us with guidance as to what has happened in the past when interest rates were on the rise.
correlation between interest rates and stocks
The chart compares every 2 year period in the stock market versus the level of the 10-Year Treasury yield between 1963 – 2017. For example, one dot would represent the time period 1963 – 1964. Another dot would represent 1964 – 1965 and so on. If the dot is above the “0.0” line, that means that there was a “positive correlation” between stock prices going up and the interest rate on the 10-Year Treasury yield going up during that same time period. Worded another way, when the dot is above the line that means the stock market was going up while interest rates were also increasing. In general, the dots above the line are good, when they are below the line, that’s bad.
Right now the 10-Year Treasury Bond is at 2.85% which is the red line on the chart. What we can conclude from this is going all the way back to 1963, at this data point, there has never been a two year period where interest rates were rising and stock prices were falling. Could it be different this time? It could, but it’s a low probability if we use historical data as our guide. History would suggest that we do not run into trouble until the yield on the 10-Year Treasury Bond gets above 4%. Once the yield on our 10-Year Treasury Bond reaches that level and interest rates are rising, historically the correlation between rising interest rates and stock prices turns negative. Meaning interest rates are going up but stock prices are going down.
It makes sense. Even though interest rates are moving up right now, they are still at historically low levels. So lending is still “cheap” by historical standards which will continue to fuel growth in the economy.
A Gradual Rise In Interest Rates
Most fixed income managers that we speak with are expecting a gradual rise in interest rates throughout 2018. While we expect interest rates to move higher throughout the year due to an increase in wage growth as a result of a tighter labor market, in our opinion, it’s a stretch to make the case that the yield on the 10-year Treasury will be at 4% by the end of the year.
If the U.S. was the only country in the world, I would feel differently. Our economy is continuing to grow, wages are increasing, the labor markets are tight which requires companies to pay more for good employees, and all of these factors would warrant a dramatic increase in the rate of inflation. But we are not the only country in the world and the interest rate environment in the U.S. is impacted by global rates.
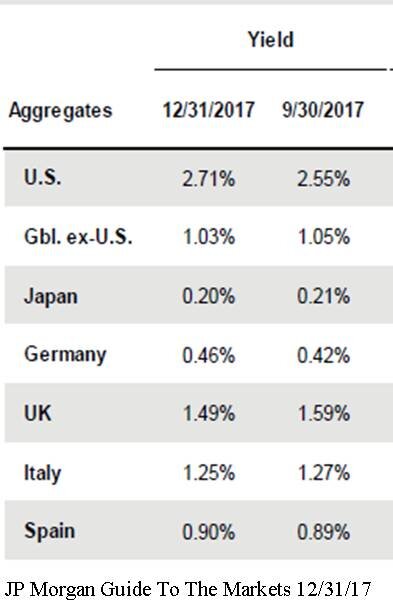
The chart below illustrates the yield on a 10 year government bonds for the U.S., Japan, Germany, UK, Italy, Spain, and total “Global Ex-U.S.”.
global interest rates
On December 31, 2017 the yield on a 10-Year Government Bond in the U.S. was 2.71%. The yield on a 10-Year government bond in Germany was only 0.46%. So, if you bought a 10-Year Government Bond from Germany, they are going to hand you back a measly 0.46% in interest each year for the next 10 years.
Why is this important? The argument can be made that while the changes in the Fed Funds Rate may have a meaningful impact on short-term rates, it may have less of an impact on intermediate to longer term interest rates. When the U.S. government needs more money to spend they conduct “treasury auctions”. The government announces that on a specified date that they are going to be selling “30 million worth of 10-year treasury bonds at a 2.8% rate”. As long as there is enough demand to sell all of the bonds at the 2.8% rate, the auction is a success. If there is not enough demand, then they may have to increase the interest rate from 2.8% to 3% to sell all $30 million worth of the bonds. While the U.S. 10-Year Treasury Bond only had a yield of 2.71%, it’s a lot higher than the other trusted government lenders around the world. As you can see in the chart above, the average 10-year government bond yield excluding the U.S. is 1.03%. This keeps the demand for U.S. debt high without the need to dramatically increase the interest rate on new government debt issuance to attract buyers of the debt.
As for the trend in global interest rates, you will see in the chart that from September 30, 2017 to December 31, 2017, global 10-year government bond yields ex-U.S. decreased from 1.05% to 1.03%. While we are in the monetary tightening cycle in the U.S., there is still monetary easing happening around the world as a whole which should prevent our 10-year treasury yields from spiking over the next 12 months.
Impact on Investment Portfolios
The media will continue to pounce on this story about “the risk of rising interest rates and inflation” throughout 2018 but it’s important to keep it in context. If tax reform works the way that it’s supposed to, wage growth should continue but we may not see the positive impact of increased consumer spending due to the wage growth until corporate earnings are released for the first and second quarter of 2018. We just have to wait to see how the strength of consumer spending nets out against the pressure on corporate earnings from higher wages.
However, investors should be looking at the fixed income portion of their portfolio to make sure there is the right mix of bonds if inflation is expected to rise throughout the year. Bond duration and credit quality will play an important role in your fixed income portfolio in 2018.
About Michael.........
Hi, I’m Michael Ruger. I’m the managing partner of Greenbush Financial Group and the creator of the nationally recognized Money Smart Board blog . I created the blog because there are a lot of events in life that require important financial decisions. The goal is to help our readers avoid big financial missteps, discover financial solutions that they were not aware of, and to optimize their financial future.


