We Are Sleep Walking Into The Next Crisis
The U.S. economy is headed down a dangerous path. In our opinion it has nothing to do with the length of the current economic cycle, valuations, interest rates, or trade wars. Instead, it has everything to do with our mounting government deficits. We have been talking about the federal budget deficits for the past ten years but when does that
The U.S. economy is headed down a dangerous path. In our opinion it has nothing to do with the length of the current economic cycle, valuations, interest rates, or trade wars. Instead, it has everything to do with our mounting government deficits. We have been talking about the federal budget deficits for the past ten years but when does that problem really come home to roost?
A Crisis In Plain Sight
An economic crisis is often easier to spot than you think if you are looking in the right places. Most of the time it involves identifying a wide spread trend that has evolved in the financial markets and the economy, shutting out all of the noise, and then applying some common sense. Looking at the tech bubble, people were taking home equity loans to buy tech stocks that they themselves did not understand. During the housing bubble people that were making $40,000 per year were buying homes for $500,000 and banks were giving loans with no verification of income. Both of the last two recessions you could have spotted by paying attention to the trends and applying some common sense.
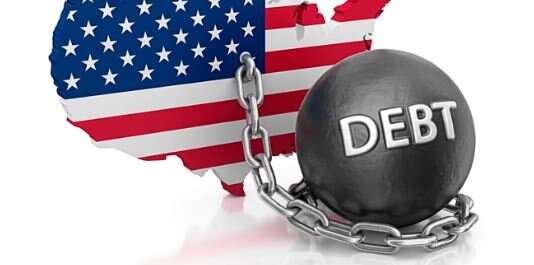
Government Debt
Looking at the data, we think there is a good chance that the next economic crisis may stem from reaching unsustainable levels of government debt. Up until now we have just been talking about it but my goal with this article is to put where we are now in perspective and why this "talking point" may soon become a reality.
Debt vs GDP
The primary measuring stick that we use to measure the sustainability of the U.S. debt level is the Debt vs GDP ratio. This ratio compares the total debt of the U.S. versus how much the U.S. economy produces in one year. Think of it as an individual. If I told you that someone has $100,000 in credit card debt, your initial reaction may be “wow, that’s a lot of debt”. But then what if I told you that an individual makes $1,000,000 per year in income? That level of debt is probably sustainable for that person since it’s only 10% of their gross earnings, whereas that amount of credit card debt would render someone who makes $50,000 per year bankrupt.
Our total gross federal deficit just eclipsed $21 trillion dollars. That’s Trillion with a “T”. From January through March 2018, GDP in the U.S. was running at an annual rate of $19.965 trillion dollars (Source: The Balance). Based on the 2018 Q1 data our debt vs GDP ratio is approximately 105%. That’s big number.
The Safe Zone
Before I start throwing more percentages at you let's first establish a baseline for what's sustainable and not sustainable from a debt standpoint. Two Harvard professors, Reinhart and Rogoff, conducted a massive study on this exact topic and wrote a whitepaper titled "Growth in a Time of Debt". Their study aimed to answer the question "how much debt is too much for a government to sustain?" They looked at historic data, not just for the U.S. but also for other countries around the world, to determine the correlation between various levels of Debt vs GDP and the corresponding growth or contraction rate of that economy. What they found was that in many cases, once a government's Debt vs GDP ratio exceeded 90%, it was frequently followed by a period of either muted growth or economic contraction. It makes sense. Even though the economy may still be growing, if you are paying more in interest on your debt then you are making, it puts you in a bad place.
Only One Time In History
There has only been one other time in U.S. history that the Debt vs GDP ratio has been as high as it is now and that was during World War II. Back in 1946, the Debt vs GDP ratio hit 119%. The difference between now and then is we are not currently funding a world war. I make that point because wars end and when they end the spending drops off dramatically. Between 1946 and 1952, the Debt vs GDP ratio dropped from 119% to 72%. Our Debt vs GDP ratio bottomed in 1981 at 31%. Since then it has been a straight march up to the levels that were are at now. We are not currently financing a world war and there is not a single expenditure that we can point to that will all of a sudden drop off to help us reduce our debt level.
Spending Too Much
So what is the United States spending the money on? Below is a snapshot of the 2018 federal budget which answers that question. As illustrated by the spending bar on the left, we are estimated to spend $4.1 trillion dollars in 2018. The largest pieces coming from Social Security, Medicare, and Medicaid.
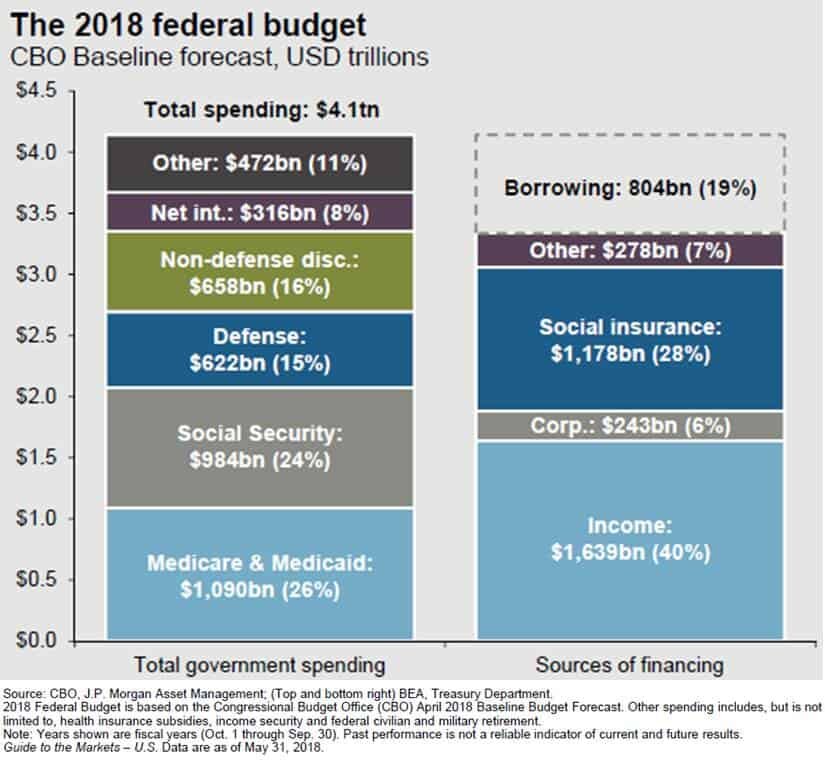
federal deficit
The bar on the right illustrates how the U.S. intends to pay for that $4.1 trillion in spending. At the top of that bar you will see “Borrowing $804 Bn”. That means the Congressional Budget Office estimates that the U.S. will have to borrow an additional $804 billion dollars just to meet the planned spending for 2018. With the introduction of tax reform and the infrastructure spending, the annual spending amount is expected to increase over the next ten years.
Whether you are for or against tax reform, it’s difficult to make the argument that it’s going to “pay for itself in the form of more tax as a result of greater economic growth.” Just run the numbers. If our annual GDP is $19.9 Trillion per year, our 3% GDP growth rate I already factored into the budget numbers, to bridge the $804B shortfall, our GDP growth rate would have to be around 7% per year to prevent further additions to the total government debt. Good luck with that. A 7% GDP growth rate is a generous rate at the beginning of an economic expansion. Given that we are currently in the second longest economic expansion of all time, it’s difficult to make the argument that we are going to see GDP growth rates that are typically associated with the beginning of an expansion period.
Apply Common Sense
Here’s where we apply common sense to the debt situation. Excluding the financing of a world war, the United State is currently at a level of debt that has never been obtained in history. Like running a business, there are only two ways to dig yourself out of debt. Cut spending or increase revenue. While tax reform may increase revenue in the form of economic growth, it does not seem likely that the U.S. economy is at this stage in the economic cycle and be able to obtain the GDP growth rate needed to prevent a further increase in the government deficits.
A cut in spending, in its simplest form, means that something has to be taken away. No one wants to hear that. The Republican and Democratic parties seem so deeply entrenched in their own camps that it will make it difficult, if not impossible, for any type of spending reform to take place before we are on the eve of what would seem to be a collision course with the debt wall. Over the past two decades, the easy solution has been to “just borrow more” which makes the landing even harder when we get there.
Answering the “when” question is probably the most difficult. We are clearly beyond what history has revered as the “comfort zone” when to comes to our Debt vs GDP ratio. However, the combination of the economic boost from tax reform and infrastructure spending in the U.S., the accelerating economic expansion that is happening outside of the U.S., and the low global interest rate environment, could continue to support growth rates even at these elevated levels of government debt.
Debt is tricky. There are times when it can be smart accept the debt, and times where it isn’t helpful. As we know from the not too distant past, it has the ability to sustain growth for an unnaturally long period of time but when the music stops it gets ugly very quickly. I’m not yelling that the sky is falling and everyone needs to go to cash tomorrow. But now is a good time to evaluate where you are risk wise within your portfolio and begin having the discussion with your investment advisor as to what an exit plan may look like if the U.S. debt levels become unsustainable and it triggers a recession within the next five years.

About Michael.........
Hi, I’m Michael Ruger. I’m the managing partner of Greenbush Financial Group and the creator of the nationally recognized Money Smart Board blog . I created the blog because there are a lot of events in life that require important financial decisions. The goal is to help our readers avoid big financial missteps, discover financial solutions that they were not aware of, and to optimize their financial future.


The Government Is Shut Down. Should You Be Worried?
The senate was not able to pass a temporary spending bill in the late hours of the night so as of Saturday, January 20th the government is officially shut down. But what does that mean? How will it impact you? What will be the impact on the stock market?
The senate was not able to pass a temporary spending bill in the late hours of the night so as of Saturday, January 20th the government is officially shut down. But what does that mean? How will it impact you? What will be the impact on the stock market?
Don’t Let The Media Scare You
The media loves big disruptive events. Why? The news is a "for profit" business. The more viewers they have, the more profits they make. What makes you watch more news? Fear. If the weather forecasts is 80 degrees and sunny, you just go on with your day. Instead, if the weather is predicting “The Largest Winter Blizzard Of The Century”, my guess is you will be glued to the weather channel most of the day trying to figure out when the storm will hit, how many feet of snow is expected to fall, and are schools closing, etc.
You will undoubtedly wake up this morning to headlines about “The Government Shutdown” and all of the horrible things that could happen as a result. In the short term a government shutdown or a “funding gap” is not incredibly disruptive. Many government agencies have residual funding to keep operations going for a period of time. Only portions of the government really “shut down”. The “essential” government services continue to function such as national security and law enforcement. The risk lies in the duration of the government shutdown. If Congress does not pass either a temporary extension or reach a final agreement within a reasonable period of time, some of these government agencies will run out of residual funding and will be forced to halt operations.
The news will target the “what if’s” of the current government shutdown. What if the government stays shut down and social security checks stop? What if the U.S. cannot fund defense spending and we are left defenseless? All of these scenarios would require a very prolonged government shutdown which is unlikely to happen.
How Often Does This Happen?
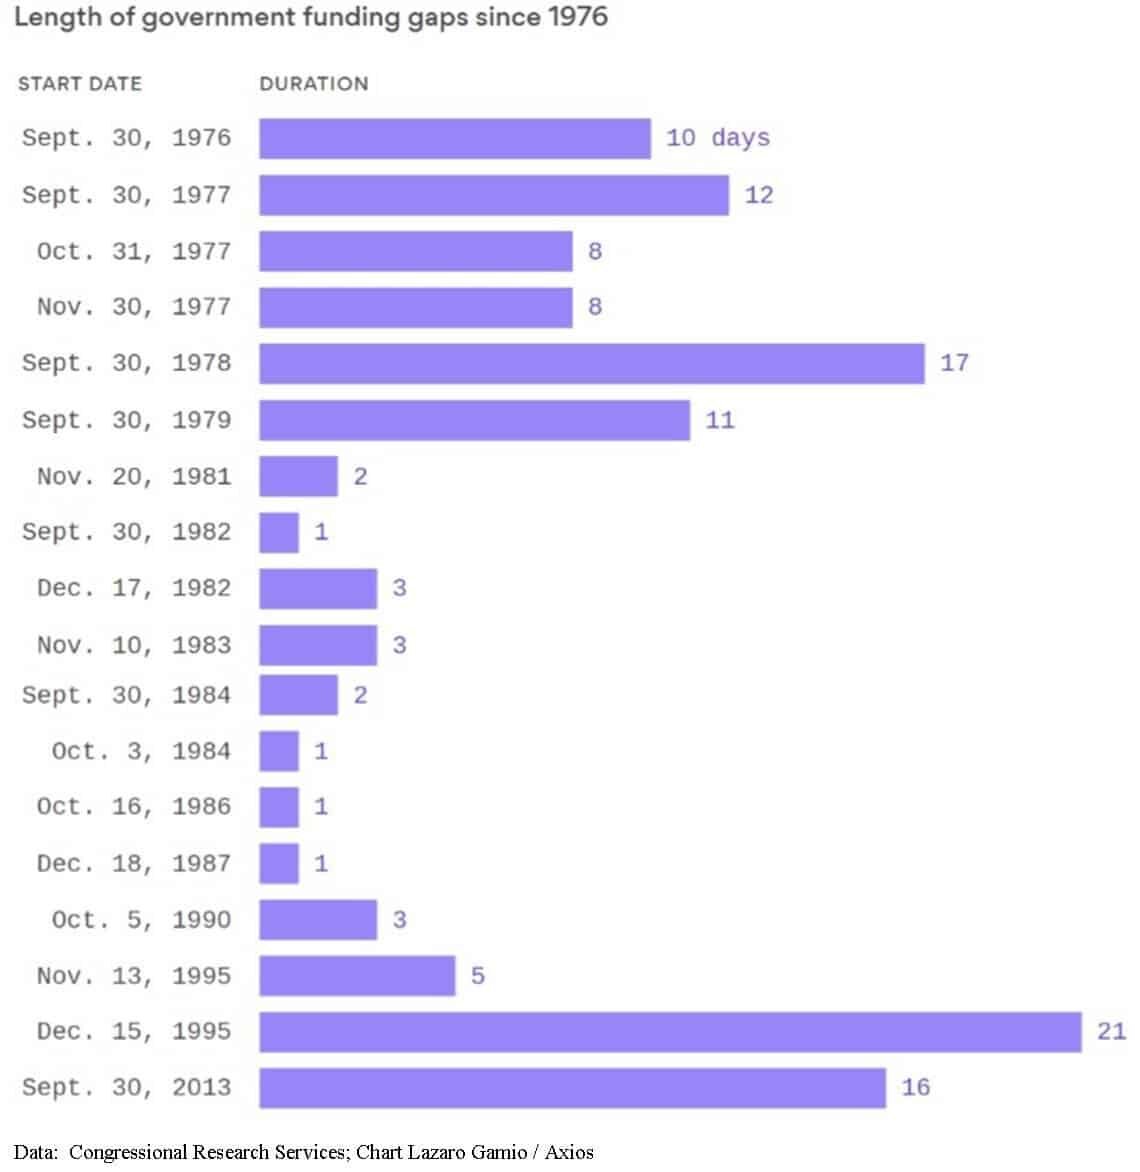
number of days the government is shut down
When I woke up this morning, my first questions was “how often do government shutdowns happen?” Is this an anomaly that I should be worried about or is it a frequent occurrence? The last government shutdown took place on September 30, 2013 and the government stayed shut down for 16 days. Prior to the 2013 shutdown, you have to go back to December 15, 1995. The duration of the 1995 shutdown was 21 days. Making the current government shutdown only the third shutdown between December 15, 1995 – January 20, 2018. Not an anomaly but also not a frequent event.
But let’s look further back. How many times did the U.S. government experience a shutdown between 1976 – 2018? In the past 42 years, the U.S. government has experienced a shutdown 18 times. On average the government shutdowns lasted for about 7 days. This makes me less worried about the current government shutdown given the number of shutdowns that we have overcome in the past.
This Shutdown Could Be Longer
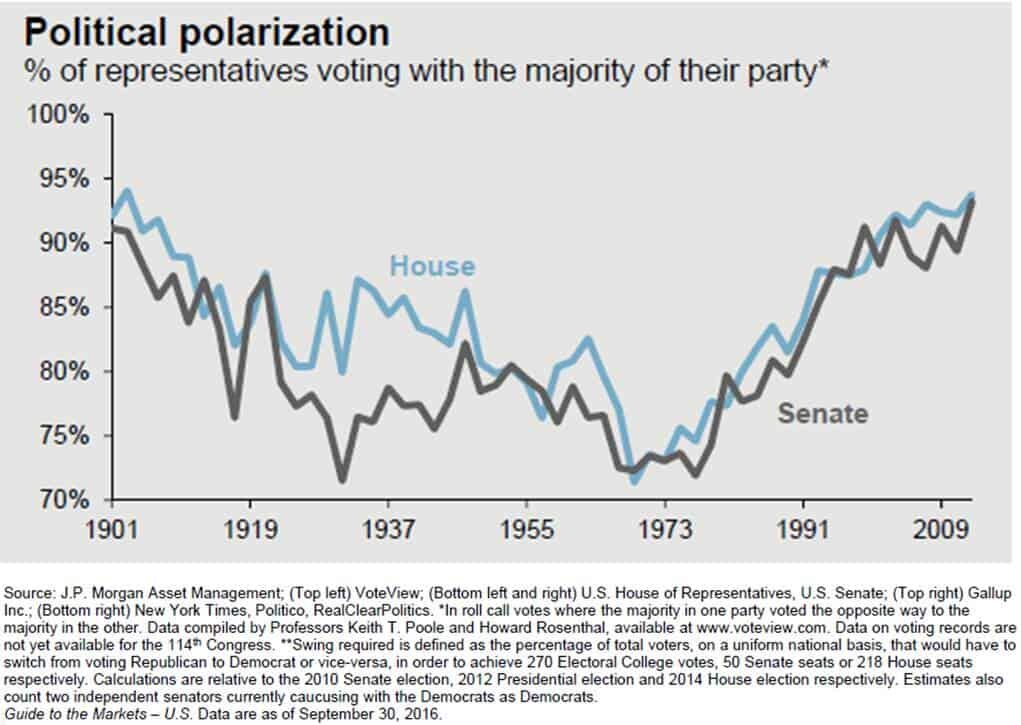
political polarization history
The only thing that worries me a little is the potential duration of the current government shutdown. I would not consider two data points to be a new “trend” but it is hard to ignore that the last two government shutdowns that occurred in 1995 and 2013 were much longer than the 7 day historical average. However, this could be the start of a new trend given how polarized Congress has become. It’s a clear trend that over the past 40 years fewer members of the Senate and House are willing to cross party lines during a vote. See the chart below: Back in 1973, only 73% of the members of Congress voted with the majority of their political party. It would seem rational to assume that during that time period members of Congress were more willing to step across the aisle for the greater good of the American people. Now, approximately 95% of the members of both the House and Senate vote with their own camp. This creates deadlock situations that take longer to resolve as the “blame game” takes center stage.
Impact On The Stock Market
In most cases, injecting uncertainty in our economy is never good for the stock market. However, given the fact that U.S. corporations are still riding the high of tax reform, if the government shutdown is resolved within the next two weeks it may have little or no impact on the markets.
If it were not for the recent passage of tax reform, my guess is this government shutdown may have been completely avoided. Not choosing a side here but just acknowledging the Democratic Party was delivered a blow with passage of tax reform in December. Since the spending bill requires 60 votes to pass in the Senate, it will require support from the Democrats. This situation provides the Democratic party with a golden opportunity to negotiate terms to help make up for some the lost ground from the passage of the Republican led tax bill. This challenging political environment could lengthen the duration of the government shutdown. However, it’s also important to remember that neither party benefits from a government shutdown, especially in a midterm election year.
Over the next two weeks, I would recommend that investors take all the media hype with a grain of salt. However, if a permanent or temporary spending bill is not passed within the next two weeks, it could result in increased volatility and downward pressure on the stock market as government agencies run out of cash reserves and begin to put workers on furlough. At this point, we are really in a “wait and see” environment.
About Michael……...
Hi, I’m Michael Ruger. I’m the managing partner of Greenbush Financial Group and the creator of the nationally recognized Money Smart Board blog . I created the blog because there are a lot of events in life that require important financial decisions. The goal is to help our readers avoid big financial missteps, discover financial solutions that they were not aware of, and to optimize their financial future.


What is a Bond?
A bond is a form of debt in which an investor serves as the lender. Think of a bond as a type of loan that a company or government would obtain from a bank but in this case the investor is serving as the bank. The issuer of the bond is typically looking to generate cash for a specific use such as general operations, a specific project, and staying current or
What is a Bond?
A bond is a form of debt in which an investor serves as the lender. Think of a bond as a type of loan that a company or government would obtain from a bank but in this case the investor is serving as the bank. The issuer of the bond is typically looking to generate cash for a specific use such as general operations, a specific project, and staying current or paying off other debt.
How do Investors Make Money on a Bond?
Your typical bonds will generate income for investors in one of two ways: periodic interest payments or purchasing the bond at a discount. There are also bonds where a combination of the two are applicable but we will explain each separately.
Interest Payments
There are interest rates associated with the bonds and interest payments are made periodically to the investor (i.e. semi-annual). When the bonds are issued, a promise to pay the interest over the life of the bond as well as the principal when the bond becomes due is made to the investor. For example, a $10,000 bond with a 5% interest rate would pay the investor $500 annually ($250 semi-annually). Typically tax would be due on the interest each year and when the bond comes due, the principal would be paid tax free as a return of cash basis.
Purchasing at a Discount
Another way to earn money on a bond would be to purchase the bond at a discount and at some time in the future get paid the face value of the bond. A simple example would be the purchase of a 10 year, $10,000 bond for a discounted price of $9,000. 10 years from the date of the purchase the investor would receive $10,000 (a $1,000 gain). Typically, the investor would be required to recognize $100 of income per year as “Original Issue Discount” (OID). At the end of the 10 year period, the gain will be recognized and the $10,000 would be paid but only $100, not $1,000, will have to be recognized as income in the final year.
Is There Risk in Bonds?
Investment grade bonds are often used to make a portfolio more conservative and less volatile. If an investor is less risk oriented or approaching retirement/in retirement they would be more likely to have a portfolio with a higher allocation to bonds than a young investor willing to take risk. This is due to the volatility in the stock market and impact a down market has on an account close to or in the distribution phase.
That being said, there are risks associated with bonds.
Interest Rate Risk – in an environment of rising interest rates, the value of a bond held by an investor will decline. If I purchased a 10 year bond two years ago with a 5% interest rate, that bond will lose value if an investor can purchase a bond with the same level of risk at a higher interest rate today. This will make the bond you hold less valuable and therefore will earn less if the bond is sold prior to maturity. If the bond is held to maturity it will earn the stated interest rate and will pay the investor face value but there is an opportunity cost with holding that bond if there are similar bonds available at higher interest rates.
Default Risk – most relevant with high risk bonds, default risk is the risk that the issuer will not be able to pay the face value of the bond. This is the same as someone defaulting on a loan. A bond held by an investor is only as good as the ability of the issuer to pay back the amount promised.
Call Risk – often times there are call features with a bond that will allow the issuer to pay off the bond earlier than the maturity date. In a declining interest rate environment, an issuer may issue new bonds at a lower interest rate and use the profits to pay off other outstanding bonds at higher interest rates. This would negatively impact the investor because if they were receiving 5% from a bond that gets called, they would likely use the proceeds to reinvest in a bond paying a lower rate or accept more risk to earn the same interest rate as the called bond.
Inflation Risk – a high inflation rate environment will negatively impact a bond because it is likely a time of rising interest rates and the purchasing power of the revenue earned on the bond will decline. For example, if an investor purchases a bond with a 3% interest rate but inflation is increasing at 5% the purchasing power of the return on that bond is eroded.
Below is a chart showing the risk spectrum of investing between asset classes and gives a visual on the different classes of bonds and their most susceptible risks.

2
Types of Bonds
Federal Government
Bonds issued by the federal government are backed by the full faith and credit of the U.S. Government and therefore are often referred to as “risk-free”. There are always risks associated with investing but in this case “risk-free” is referring to the idea that the U.S. Government is not likely to default on a bond and therefore the investor has a high likelihood of being paid the face value of the bond if held to maturity but like any investment there is risk.
There are a number of different federal bonds known as Treasuries and below we will touch on the more common:
Treasuries – Sold via auction in $1,000 increments. An investor will purchase the bond at a price below the face value and be paid the face value when the bond matures. You can bid on these bonds directly through www.treasurydirect.gov, or you can purchase the bonds through a broker or bank.
Treasury Bills – Short term investments sold in $1,000 increments. T-Bills are purchased at a discount with the promise to be paid the face value at maturity. These bonds have a period of less than a year and therefore, in a normal market environment, rates will be less than those of longer term bonds.
Treasury Notes – Sold in $1,000 increments and have terms of 2, 5, and 10 years. Treasury notes are often purchased at a discount and pay interest semi-annually. The 10 year Treasury note is most often used to discuss the U.S. government bond market and analyze the markets take on longer term macroeconomic trends.
Treasury Bonds – Similar to Treasury Notes but have periods of 30 years.
Treasury Inflation-Protected Securities (TIPS) – Sold in 5, 10, and 20 year terms. Not only will TIPS pay periodic interest, the face value of the bond will also increase with inflation each year. The increase in face value will be taxable income each year even though the principal is not paid until maturity. Interest rates on TIPS are usually lower than bonds with like terms because of the inflation protection.
Savings Bonds – There are two types of savings bonds still being issued, Series EE and Series I. The biggest difference between the two is that Series EE bonds have a fixed interest rate while Series I bonds have a fixed interest rate as well as a variable interest rate component. Savings bonds are purchased at a discount and accrue interest monthly. Typically these bonds mature in 20 years but can be cashed early and the cash basis plus accrued interest at the time of sale will be paid to the investor.
Municipal Bonds (Munis) – Bonds issued by states, cities, and local governments to fund specific projects. These bonds are exempt from federal tax and depending on where you live and where the bond was issued they may be tax free at the state level as well. There are two categories of Munis: Government Obligation Bonds and Revenue Bonds. Government Obligation Bonds are secured by the full faith and credit of the issuer’s taxing power (property/income/other). These bonds must be approved by voters. Revenue Bonds are secured by the revenues derived from specific activities the bonds were used to finance. These can be revenues from activities such as tolls, parking garages, or sports arenas.
Agency Bonds – These bonds are issued by government sponsored enterprises such as the Federal Home Loan Mortgage Association (Freddie Mac), the Federal Home Loan Mortgage Association (Fannie Mae), and the Federal Agricultural Mortgage Corporation (Farmer Mac). Agency bonds are used to stimulate activity such as increasing home ownership or agriculture production. Although they are not backed by the full faith and credit of the U.S. Government, they are viewed as less risky than corporate bonds.
Corporate Bonds – These bonds are issued by companies and although viewed as more risky than government bonds, the level of risk depends on the company issuing the bond. Bonds issued by a company like GE or Cisco may be viewed by investors as less of a default risk than a start-up company or company that operates in a volatile industry. The level of risk with the bond is directly related to the interest rate of the bond. Generally, the riskier the bond the higher the interest rate.
About Rob……...
Hi, I’m Rob Mangold. I’m the Chief Operating Officer at Greenbush Financial Group and a contributor to the Money Smart Board blog. We created the blog to provide strategies that will help our readers personally , professionally, and financially. Our blog is meant to be a resource. If there are questions that you need answered, pleas feel free to join in on the discussion or contact me directly.