
The Marriage Penalty: Past and Present
Whether you're currently married or not, the new tax legislation may impact how the "Marriage Penalty" affects you. Never heard of such a thing? Let's take a look at a simple example and show how it may be different under the new tax regulation.

The Marriage Penalty: Past and Present
Whether you're currently married or not, the new tax legislation may impact how the "Marriage Penalty" affects you. Never heard of such a thing? Let's take a look at a simple example and show how it may be different under the new tax regulation.
The Past (kind of)
I say "kind of" because most people still have to file their 2017 tax return. Here is the 2017 tax table for Single Filers and Married Filing Joint Filers:
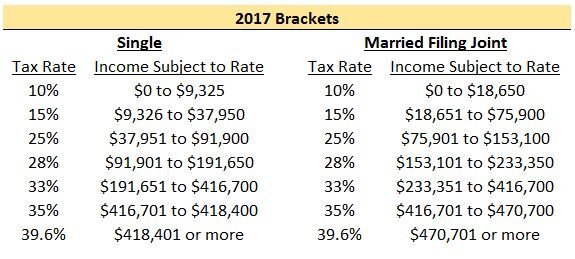
A reasonable person would think that the income subject to tax would simply double if you went from filing Single to Married Filing Joint. As you can see, this isn't the case once you are in the 25%+ tax bracket and it can mean big dollars! Let's take a look at a simple example where each person makes the same amount of money. We will also assume they will be taking the standard deduction in 2017.
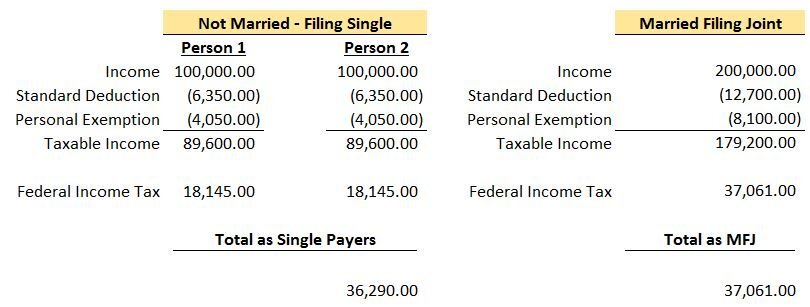
Note: To calculate the “Federal Income Tax” amount above, you can use the IRS tables here 2017 1040 Tax Table Instructions. All of your income is not taxed at your top rate. For example, if your top income falls in the 25% tax bracket, as a single payer you will only pay 25% on income from $37,951 to $91,900. Everything below that range will be taxed at either 10% or 15%.
As you can see, because of the change in filing status, this couple owed a total of $771 more to the federal government. This is the “Marriage Penalty”. Typically as incomes rise, the dollar amount of the penalty becomes larger. For this couple, their top tax bracket went from 25% each when filing single to 28% filing joint.
The Present
Here is the 2018 tax table in the new tax legislation for Single Filers and Married Filing Joint Filers:
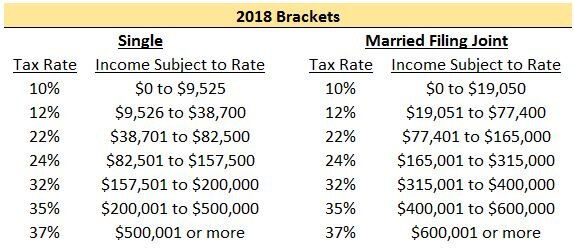
Upon review, you can see that the top income brackets are not doubled for Married Filing Joint. At 37%, a single person filing would reach the top rate at $500,001 while married filing joint would reach at $600,001. That being said, the “Marriage Penalty” appears to kick in at higher income levels compared to the past and therefore should impact less people. The income bracket for Married Filing Joint is doubled up until $400,000 of combined income compared to just $75,901 under the 2017 brackets.
Let’s take a look at the same couple in the example above.
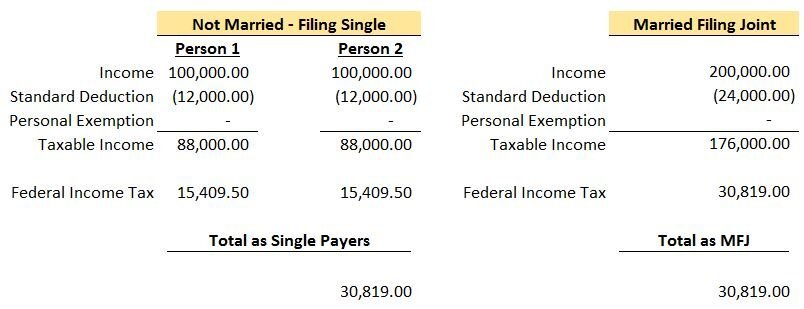
Due to the income brackets doubling from single to married filing joint for this couple, the “Marriage Penalty” they would have incurred in 2017 appears to go away. In this example, they would also pay less in federal taxes in both situations. This article is more focused on the impact on the “Marriage Penalty” but having a lower tax bill is always a plus.
Standard vs. Itemized Deductions
The tax brackets aren’t the only penalty. Another common tax increase people see when going from single to married filing joint are the deductions they lose. If I’m single and own a home, it is likely I will itemized because the sum of my property taxes, mortgage interest, and state income taxes exceed the standard deduction amount. Assume the couple in the example above is still not married but Person 1 owns a home and rather than taking the standard deduction, Person 1 itemizes for an amount of $15,000. For 2017, their total deductions will be $21,350 ($15,000 Person 1 plus $6,350 Person 2) and for 2018, their total deductions will be $27,000 ($15,000 Person 1 plus $12,000 Person 2).
Now they get married and have to choose whether to itemize or take the standard deduction.
2017: Assuming they live together in the same house, in 2017 they would still itemize because they have deductions of $15,000 for Person 1 and some additional items that Person 2 would bring to the table (i.e. their state income taxes). Say their total itemized deductions are $18,000 when married filing joint. They would still itemize because $18,000 is more than the Married Filing Joint standard deduction of $12,700. But now compare the $18,000 to the $21,350 they got filing single. They lose out on $3,350 of deductions. Usually, less deductions equals more taxes.
2018: Assuming they live together in the same house, in 2018 they would no longer itemize. Assuming their total itemized deductions are still $18,000, that is less than the $24,000 standard deduction they can take when married filing joint. $24,000 standard deduction in 2018 is still less than the $27,000 they got filing separately by $3,000. Again, less deductions usually means more taxes. The “Marriage Penalty” lives on!
A lot of people will still lose out on deductions in 2018 but the “Marriage Penalty” will hit less people because of the increase in the standard deduction. If Person 1 has itemized deductions of $10,000 in 2017, they would itemize if they filed single and possibly take the standard deduction of $12,700 filing joint. In 2018 however, Person 1 would take the standard deduction both as a single tax payer ($12,000) and married filing joint ($24,000) which takes away the “Marriage Penalty” related to the deduction.
The Why?
Why do tax brackets work this way? Like most taxes, I assume the idea was to generate more income for the government. Some may also argue that typical couples don't make the same salaries which seems like an archaic point of view.Was it all fixed with the new tax legislation? It doesn't appear so but it does look like less people will be struck by Cupid's Marriage Penalty.
About Rob.........
Hi, I’m Rob Mangold. I’m the Chief Operating Officer at Greenbush Financial Group and a contributor to the Money Smart Board blog. We created the blog to provide strategies that will help our readers personally , professionally, and financially. Our blog is meant to be a resource. If there are questions that you need answered, pleas feel free to join in on the discussion or contact me directly.


Tax Reform: At What Cost?
The Republicans are in a tough situation. There is a tremendous amount of pressure on them to get tax reform done by the end of the year. This type of pressure can have ugly side effects. It’s similar to the Hail Mary play at the end of a football game. Everyone, including the quarterback, has their eyes fixed on the end zone but nobody realizes that no
The Republicans are in a tough situation. There is a tremendous amount of pressure on them to get tax reform done by the end of the year. This type of pressure can have ugly side effects. It’s similar to the Hail Mary play at the end of a football game. Everyone, including the quarterback, has their eyes fixed on the end zone but nobody realizes that no one is covering one of the defensive lineman and he’s just waiting for the ball to be hiked. The game ends without the ball leaving the quarterback’s hands.
The Big Play
Tax reform is the big play. If it works, it could lead to an extension of the current economic rally and more. I’m a supporter of tax reform for the purpose of accelerating job growth both now and in the future. It’s not just about U.S. companies keeping jobs in the U.S. That has been the game for the past two decades. The new game is about attracting foreign companies to set up shop in the U.S. and then hire U.S. workers to run their plants, companies, subsidiaries, etc. Right now we have the highest corporate tax rate in the world which has not only prevented foreign companies from coming here but it has also caused U.S. companies to move jobs outside of the United States. If everyone wants more pie, you have to focus on making the pie bigger, otherwise we are all just going to sit around and fight over who’s piece is bigger.
Easier Said Than Done
How do we make the pie bigger? We have to lower the corporate tax rate which will entice foreign companies to come here to produce the goods and services that they are already selling in the U.S. Which is easy to do if the government has a big piggy bank of money to help offset the tax revenue that will be lost in the short term from these tax cuts. But we don’t.
$1.5 Trillion In Debt Approved
Tax reform made some headway in mid-October when the Senate passed the budget. Within that budget was a provision that would allow the national debt to increase by approximately $1.5 trillion dollars to help offset the short-term revenue loss cause by tax reform. While $1.5 trillion sounds like a lot of money, and don’t get me wrong, it is, let’s put that number in context with some of the proposals that are baked into the proposed tax reform.
Pass-Through Entities
One of the provisions in the proposed tax reform is that income from “pass-through” businesses would be taxed at a flat rate of 25%.
A little background on pass-through business income: sole proprietorships, S corporations, limited liability companies (LLCs), and partnerships are known as pass-through businesses. These entities are called pass-throughs, because the profits of these firms are passed directly through the business to the owners and are taxed on the owners’ individual income tax returns.
How many businesses in the U.S. are pass-through entities? The Tax Foundation states on its website that pass-through entities “make up the vast majority of businesses and more than 60 percent of net business income in America. In addition, pass-through businesses account for more than half of the private sector workforce and 37 percent of total private sector payroll.”
At a conference in D.C., the American Society of Pension Professionals and Actuaries (ASPPA), estimated that the “pass through 25% flat tax rate” will cost the government $6 trillion - $7 trillion in tax revenue. That is a far cry from the $1.5 trillion that was approved in the budget and remember that is just one of the many proposed tax cuts in the tax reform package.
Are Democrats Needed To Pass Tax Reform?
Since $1.5 trillion was approved in the budget by the senate, if the proposed tax reform is able to prove that it will add $1.5 trillion or less to the national debt, the Republicans can get tax reform passed through a “reconciliation package” which does not require any Democrats to step across the aisle. If the tax reform forecasts exceed that $1.5 trillion threshold, then they would need support from a handful of Democrats to get the tax reformed passed which is unlikely.
Revenue Hunting
To stay below that $1.5 trillion threshold, the Republicans are “revenue hunting”. For example, if the proposed tax reform package is expected to cost $5 trillion, they would need to find $3.5 trillion in new sources of tax revenue to get the net cost below the $1.5 trillion debt limit.
State & Local Tax Deductions – Gone?
One for those new revenue sources that is included in the tax reform is taking away the ability to deduct state and local income taxes. This provision has created a divide among Republicans. Since many southern states do not have state income tax, many Republicans representing southern states support this provision. Visa versa, Republicans representing states from the northeast are generally opposed to this provision since many of their states have high state and local incomes taxes. There are other provisions within the proposed tax reform that create the same “it depends on where you live” battle ground within the Republican party.
Obamacare
One of the main reasons why the Trump administration pushed so hard for the Repeal and Replace of Obamacare was “revenue hunting”. They needed the tax savings from the repeal and replace of Obamacare to carrry over to fill the hole that will be created by the proposed tax reform. Since that did not happen, they are now looking high and low for other revenue sources.
Retirement Accounts At Risk?
If the Republicans fail to get tax reform through they run the risk of losing face with their supporters since they have yet to get any of the major reforms through that they campaigned on. Tax reform was supposed to be a layup, not a Hail Mary and this is where the hazard lies. Republicans, out of the desperation to get tax reform through, may start making cuts where they shouldn’t. There are rumors that the Republican Party may consider making cuts to the 401(k) contribution limits and employers sponsored retirement plan. Even though Trump tweeted on October 23, 2017 that he would not touch 401(k)’s as part of tax reform, they are running out of the options for other places that they can find new sources of tax revenue. If it comes down to the 1 yard line and they have the make the decision between making deep cuts to 401(k) plans or passing the tax reform, retirement plans may end up being the sacrificial lamb. There are other consequences that retirement plans may face if the proposed tax reform is passed but it’s too broad to get into in this article. We will write a separate article on that topic.
Tax Reform May Be Delayed
Given all the variables in the mix, passing tax reform before December 31st is starting to look like a tall order to fill. If the Republicans are looking for new sources of revenue, they should probably look for sources that are uniform across state lines otherwise they risk splintering the Republican Party like we saw during the attempt to Repeal and Replace Obamacare. We are encouraging everyone to pay attention to the details buried in the tax reform. While I support tax reform to secure the country’s place in the world both now and in the future, if provisions that make up the tax reform are rushed just to get something done, we run the risk of repeating the short lived glory that tax reform saw during the Reagan Era. They passed sweeping tax cuts, the deficits spiked, and they were forced to raise tax rates a few years later.

About Michael……...
Hi, I’m Michael Ruger. I’m the managing partner of Greenbush Financial Group and the creator of the nationally recognized Money Smart Board blog . I created the blog because there are a lot of events in life that require important financial decisions. The goal is to help our readers avoid big financial missteps, discover financial solutions that they were not aware of, and to optimize their financial future.


Where Are We In The Market Cycle?
Before you can determine where you are going, you first have to know where you are now. Seems like a simple concept. A similar approach is taken when we are developing the investment strategy for our client portfolios. The question more specifically that we are trying to answer is “where are we at in the market cycle?” Is there more upside

Before you can determine where you are going, you first have to know where you are now. Seems like a simple concept. A similar approach is taken when we are developing the investment strategy for our client portfolios. The question more specifically that we are trying to answer is “where are we at in the market cycle?” Is there more upside to the market? Is there a downturn coming? No one knows for sure and there is no single market indicator that has proven to be an accurate predicator of future market trends. Instead, we have to collect data on multiple macroeconomic indicators and attempt to plot where we are in the current market cycle. Here is a snapshot of where we are at now:
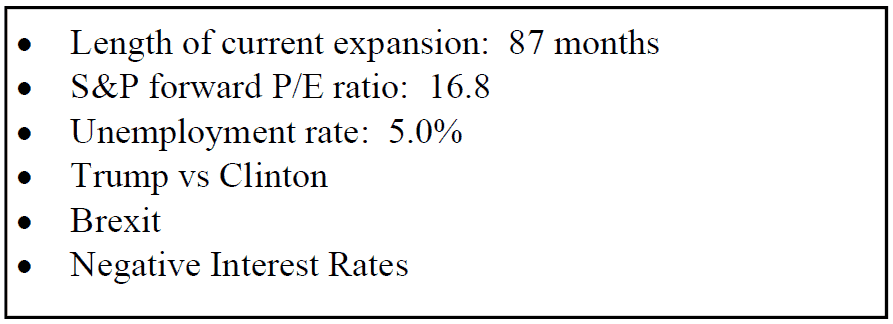
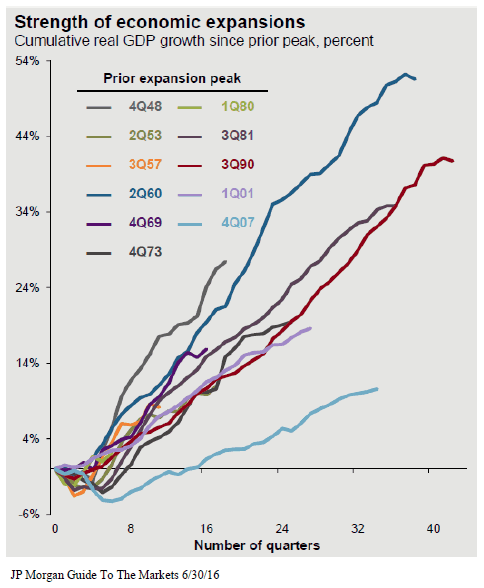
The length of the current bull market is starting to worry some investors. Living through the tech bubble and the 2008 recession, those were healthy reminders that markets do not always go up. We are currently in the 87th month of the expansion which is the 4th longest on record. Since 1900, the average economic expansion has lasted 46 months. This leaves many investors questioning, “is the bull market rally about to end?” We are actually less concerned about the “duration” of the expansion. We prefer to look at the “magnitude” of the expansion. This recovery has been different. In most economic recoveries the market grows rapidly following a recession. If you look at the magnitude of this expansion that started in the 4th quarter of 2007 versus previous expansions, it has been lackluster at best. See the chart on the next page. This may lead investors to conclude that there is more to the current economic expansion.
Next up, employment. Over the past 50 years, the unemployment rate has averaged 6.2%. We are currently sitting at an unemployment rate of 5.0%. Based on that number it may be reasonable to conclude that we are close to full employment. Once you get close to full employment you begin to lose that surge in growth that the economy receives from adding 250,000+ jobs per month. It may also imply that we are getting closer to the end of this market cycle.
Now let’s look at the valuation levels in the stock market. In other words, in general are the stocks in the S&P 500 Index cheap to buy, fairly valued, or expensive to buy at this point? We measure this by the forward price to earning ratio (P/E) of the S&P 500 index. The average P/E of the S&P 500 over the last 25 years is 15.9. Back in 2008, the P/E of the S&P 500 was around 9.0. From a valuation standpoint, back in 2008, stocks were very cheap to buy. When stocks are cheap, investors tend to hold them regardless of what’s happening in the global economy with the hopes that they will at least become “fairly valued” at some point in the future. Right now the P/E Ratio of the S&P 500 Index is about 16.8 which is above the 15.9 historic average. This may indicate that stock are starting to become “expensive” from a valuation standpoint and investors may be tempted to sell positions during periods of volatility.
Even though stocks may be perceived as “overvalued” that does not necessarily mean they are not going to become more overvalued from here. In fact, often times after long bull rallies “the plane will overshoot the runway”. However, it does typically mean that big gains are harder to come by since a large amount of the future earnings expectations of the S&P 500 companies are already baked into the stock price. It leaves the door open for more quarterly earning disappointments which could rise to higher levels of volatility in the markets.

The most popular question of the year goes to: “Trump or Hillary? And how will the outcome impact the stock market?” I try not to get too deep in the weeds of politics mainly because history has shown us that there is no clear evidence whether the economy fares better under a Republican president or a Democratic president. However, here is the key point. Markets do not like uncertainty and one of the candidates that is running (I will let you guess which one) represents a tremendous amount of uncertainty regarding the actions that they may take if elected president of the United States. Still, under these circumstances, it is very difficult to develop a sound investment strategy centered around political outcomes that may or may not happen. We really have to “wait and see” in this case.
Let’s travel over the Atlantic. Brexit was a shock to the stock market over the summer but the long term ramifications of the United Kingdom’s exit from the European Union is yet to be known. The exit process will most likely take a number of years as the EU and the UK negotiate terms. In our view, this does not pose an immediate threat to the global economy but it will represent an ongoing element of uncertainty as the EU continues to restart sustainable economic growth in the region.
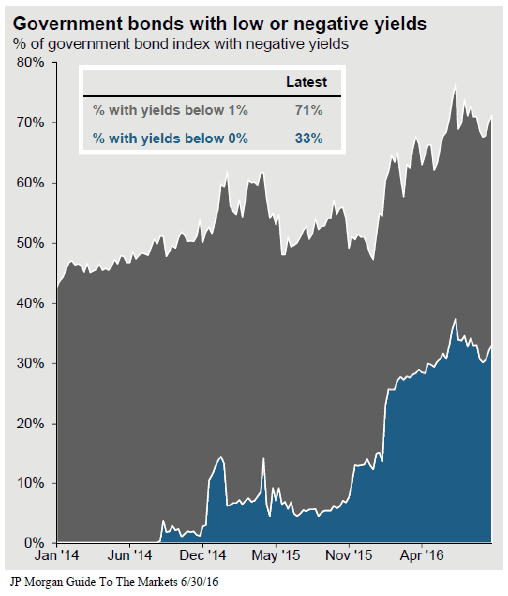
The chart below is one of the most important illustrations that allows us to gauge the overall level of risk that exists in the global economy. When a country wants to jump start its economy it will often lower the reserve rate (similar to our Fed Funds Rate) in an effort to encourage lending. An increase in borrowing hopefully leads to an increase in consumer spending and economic growth. Unfortunately, countries around the globed have taken this concept to an extreme level and have implemented “negative rates”. If you buy a 10 year government bond in Germany or Japan, you are guaranteed to lose money over that 10 year period. If you have a checking account at a bank in Japan, instead of receiving interest from the bank, the bank may charge you a fee to hold onto your own money. Crazy right? It’s happening. In fact, 33% of the countries around the world have a negative yield on their 10 year government bond. See the chart below. When you look around the globe 71% of the countries have a 10 year government bond yield below 1%. The U.S. 10 Year Treasury sits just above that at 1.7%.
So, what does that mean for the global economy? Basically, countries around the world are starving for economic growth and everyone is trying to jump start their economy at the same time. Possible outcomes? On the positive side, the stage is set for growth. There is “cheap money” and favorable interest rates at levels that we have never seen before in history. Meaning a little growth could go a long ways.
On the negative side, these central banks around the global are pretty much out of ammunition. They have fired every arrow that they have at this point to prevent their economy from contracting. If they cannot get their economy to grow and begin to normalize rates in the near future, when they get hit by the next recession they will have nothing to combat it with. It’s like the fire department showing up to a house fire with no water in the truck. The U.S. is not immune to this situation. Everyone wants the Fed to either not raise rates or raise rates slowly for the fear of the negative impact that it may have on the stock market or the value of the dollar. But would you rather take a little pain now or wait for the next recession to hit and have no way to stop the economy from contracting? It seems like a risky game.
When we look at all of these economic factors as a whole it suggests to us that the U.S. economy is continuing to grow but at a slower pace than a year ago. The data leads us to believe that we may be entering the later stages of the recent bull market rally and that now is a prudent time to revisit the level of exposure to risk assets in our client portfolios. At this point we are more concerned about entering a period of long term stagnation as opposed to a recession. With the rate of economic growth slowing here in the U.S. and the rich valuations already baked into the stock market, we could be entering a period of muted returns from both the stock and bond market. It is important that investors establish a realistic view of where we are in the economic cycle and adjust their return expectations accordingly.
As always, please feel free to contact me if you’d like to discuss your portfolio or our outlook for the economy.
About Michael……...
Hi, I’m Michael Ruger. I’m the managing partner of Greenbush Financial Group and the creator of the nationally recognized Money Smart Board blog . I created the blog because there are a lot of events in life that require important financial decisions. The goal is to help our readers avoid big financial missteps, discover financial solutions that they were not aware of, and to optimize their financial future.


What is a Bond?
A bond is a form of debt in which an investor serves as the lender. Think of a bond as a type of loan that a company or government would obtain from a bank but in this case the investor is serving as the bank. The issuer of the bond is typically looking to generate cash for a specific use such as general operations, a specific project, and staying current or

What is a Bond?
A bond is a form of debt in which an investor serves as the lender. Think of a bond as a type of loan that a company or government would obtain from a bank but in this case the investor is serving as the bank. The issuer of the bond is typically looking to generate cash for a specific use such as general operations, a specific project, and staying current or paying off other debt.
How do Investors Make Money on a Bond?
Your typical bonds will generate income for investors in one of two ways: periodic interest payments or purchasing the bond at a discount. There are also bonds where a combination of the two are applicable but we will explain each separately.
Interest Payments
There are interest rates associated with the bonds and interest payments are made periodically to the investor (i.e. semi-annual). When the bonds are issued, a promise to pay the interest over the life of the bond as well as the principal when the bond becomes due is made to the investor. For example, a $10,000 bond with a 5% interest rate would pay the investor $500 annually ($250 semi-annually). Typically tax would be due on the interest each year and when the bond comes due, the principal would be paid tax free as a return of cash basis.
Purchasing at a Discount
Another way to earn money on a bond would be to purchase the bond at a discount and at some time in the future get paid the face value of the bond. A simple example would be the purchase of a 10 year, $10,000 bond for a discounted price of $9,000. 10 years from the date of the purchase the investor would receive $10,000 (a $1,000 gain). Typically, the investor would be required to recognize $100 of income per year as “Original Issue Discount” (OID). At the end of the 10 year period, the gain will be recognized and the $10,000 would be paid but only $100, not $1,000, will have to be recognized as income in the final year.
Is There Risk in Bonds?
Investment grade bonds are often used to make a portfolio more conservative and less volatile. If an investor is less risk oriented or approaching retirement/in retirement they would be more likely to have a portfolio with a higher allocation to bonds than a young investor willing to take risk. This is due to the volatility in the stock market and impact a down market has on an account close to or in the distribution phase.
That being said, there are risks associated with bonds.
Interest Rate Risk – in an environment of rising interest rates, the value of a bond held by an investor will decline. If I purchased a 10 year bond two years ago with a 5% interest rate, that bond will lose value if an investor can purchase a bond with the same level of risk at a higher interest rate today. This will make the bond you hold less valuable and therefore will earn less if the bond is sold prior to maturity. If the bond is held to maturity it will earn the stated interest rate and will pay the investor face value but there is an opportunity cost with holding that bond if there are similar bonds available at higher interest rates.
Default Risk – most relevant with high risk bonds, default risk is the risk that the issuer will not be able to pay the face value of the bond. This is the same as someone defaulting on a loan. A bond held by an investor is only as good as the ability of the issuer to pay back the amount promised.
Call Risk – often times there are call features with a bond that will allow the issuer to pay off the bond earlier than the maturity date. In a declining interest rate environment, an issuer may issue new bonds at a lower interest rate and use the profits to pay off other outstanding bonds at higher interest rates. This would negatively impact the investor because if they were receiving 5% from a bond that gets called, they would likely use the proceeds to reinvest in a bond paying a lower rate or accept more risk to earn the same interest rate as the called bond.
Inflation Risk – a high inflation rate environment will negatively impact a bond because it is likely a time of rising interest rates and the purchasing power of the revenue earned on the bond will decline. For example, if an investor purchases a bond with a 3% interest rate but inflation is increasing at 5% the purchasing power of the return on that bond is eroded.
Below is a chart showing the risk spectrum of investing between asset classes and gives a visual on the different classes of bonds and their most susceptible risks.

2
Types of Bonds
Federal Government
Bonds issued by the federal government are backed by the full faith and credit of the U.S. Government and therefore are often referred to as “risk-free”. There are always risks associated with investing but in this case “risk-free” is referring to the idea that the U.S. Government is not likely to default on a bond and therefore the investor has a high likelihood of being paid the face value of the bond if held to maturity but like any investment there is risk.
There are a number of different federal bonds known as Treasuries and below we will touch on the more common:
Treasuries – Sold via auction in $1,000 increments. An investor will purchase the bond at a price below the face value and be paid the face value when the bond matures. You can bid on these bonds directly through www.treasurydirect.gov, or you can purchase the bonds through a broker or bank.
Treasury Bills – Short term investments sold in $1,000 increments. T-Bills are purchased at a discount with the promise to be paid the face value at maturity. These bonds have a period of less than a year and therefore, in a normal market environment, rates will be less than those of longer term bonds.
Treasury Notes – Sold in $1,000 increments and have terms of 2, 5, and 10 years. Treasury notes are often purchased at a discount and pay interest semi-annually. The 10 year Treasury note is most often used to discuss the U.S. government bond market and analyze the markets take on longer term macroeconomic trends.
Treasury Bonds – Similar to Treasury Notes but have periods of 30 years.
Treasury Inflation-Protected Securities (TIPS) – Sold in 5, 10, and 20 year terms. Not only will TIPS pay periodic interest, the face value of the bond will also increase with inflation each year. The increase in face value will be taxable income each year even though the principal is not paid until maturity. Interest rates on TIPS are usually lower than bonds with like terms because of the inflation protection.
Savings Bonds – There are two types of savings bonds still being issued, Series EE and Series I. The biggest difference between the two is that Series EE bonds have a fixed interest rate while Series I bonds have a fixed interest rate as well as a variable interest rate component. Savings bonds are purchased at a discount and accrue interest monthly. Typically these bonds mature in 20 years but can be cashed early and the cash basis plus accrued interest at the time of sale will be paid to the investor.
Municipal Bonds (Munis) – Bonds issued by states, cities, and local governments to fund specific projects. These bonds are exempt from federal tax and depending on where you live and where the bond was issued they may be tax free at the state level as well. There are two categories of Munis: Government Obligation Bonds and Revenue Bonds. Government Obligation Bonds are secured by the full faith and credit of the issuer’s taxing power (property/income/other). These bonds must be approved by voters. Revenue Bonds are secured by the revenues derived from specific activities the bonds were used to finance. These can be revenues from activities such as tolls, parking garages, or sports arenas.
Agency Bonds – These bonds are issued by government sponsored enterprises such as the Federal Home Loan Mortgage Association (Freddie Mac), the Federal Home Loan Mortgage Association (Fannie Mae), and the Federal Agricultural Mortgage Corporation (Farmer Mac). Agency bonds are used to stimulate activity such as increasing home ownership or agriculture production. Although they are not backed by the full faith and credit of the U.S. Government, they are viewed as less risky than corporate bonds.
Corporate Bonds – These bonds are issued by companies and although viewed as more risky than government bonds, the level of risk depends on the company issuing the bond. Bonds issued by a company like GE or Cisco may be viewed by investors as less of a default risk than a start-up company or company that operates in a volatile industry. The level of risk with the bond is directly related to the interest rate of the bond. Generally, the riskier the bond the higher the interest rate.
About Rob……...
Hi, I’m Rob Mangold. I’m the Chief Operating Officer at Greenbush Financial Group and a contributor to the Money Smart Board blog. We created the blog to provide strategies that will help our readers personally , professionally, and financially. Our blog is meant to be a resource. If there are questions that you need answered, pleas feel free to join in on the discussion or contact me directly.