

Volatility, Market Timing, and Long-Term Investing
For many savers, the objective of a retirement account is to accumulate assets while you are working and use those assets to pay for your expenses during retirement. While you are in the accumulation phase, assets are usually invested and hopefully earn a sufficient rate of return to meet your retirement goal. For the majority,
Volatility, Market Timing, and Long-Term Investing
For many savers, the objective of a retirement account is to accumulate assets while you are working and use those assets to pay for your expenses during retirement. While you are in the accumulation phase, assets are usually invested and hopefully earn a sufficient rate of return to meet your retirement goal. For the majority, these accounts are long-term investments and there are certain investing ideas that should be taken into consideration when managing portfolios. This article will discuss volatility, market timing and their role in long-term retirement accounts.
“Market timing is the act of moving in and out of the market or switching between asset classes based on using predictive methods such as technical indicators or economic data” (Investopedia). In other words, trying to sell investments when they are near their highest and buy investments when they are near their lowest. It is difficult, some argue impossible, to time the market successfully enough to generate higher returns. Especially over longer periods. That being said, by reallocating portfolios and not experiencing the full loss during market downturns, investors could see higher returns. When managing portfolios over longer periods, this should be done without the emotion of day to day volatility but by analyzing greater economic trends.
So far, the stock market in 2018 has been volatile; particularly when compared to 2017. Below are charts of the S&P 500 from 1/1/2018 – 10/21/2018 and the same period for 2017.
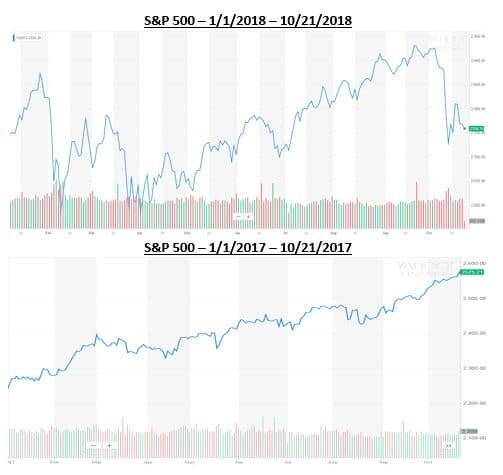
Source: Yahoo Finance. Information has been obtained from sources believed to be reliable and are subject to change without notification.
Based on the two charts above, one could conclude the majority of investors would prefer 2017 100% of the time. In reality, the market averages a correction of over 10% each year and there are years the market goes up and there are years the market goes down. Currently, the volatility in the market has a lot of investors on edge, but when comparing 2018 to the market historically, one could argue this year is more typical than a year like 2017 where the market had very little to no volatility.
Another note from the charts above are the red and green bars on the bottom of each year. The red represent down days in the market and the green represent up days. You can see that even though there is more volatility in 2018 compared to 2017 when the market just kept climbing, both years have a mixture of down days and up days.
A lot of investors become emotional when the market is volatile but even in the midst of volatility and downturns, there are days the market is up. The chart below shows what happens to long-term portfolio performance if investors miss the best days in the market during that period.
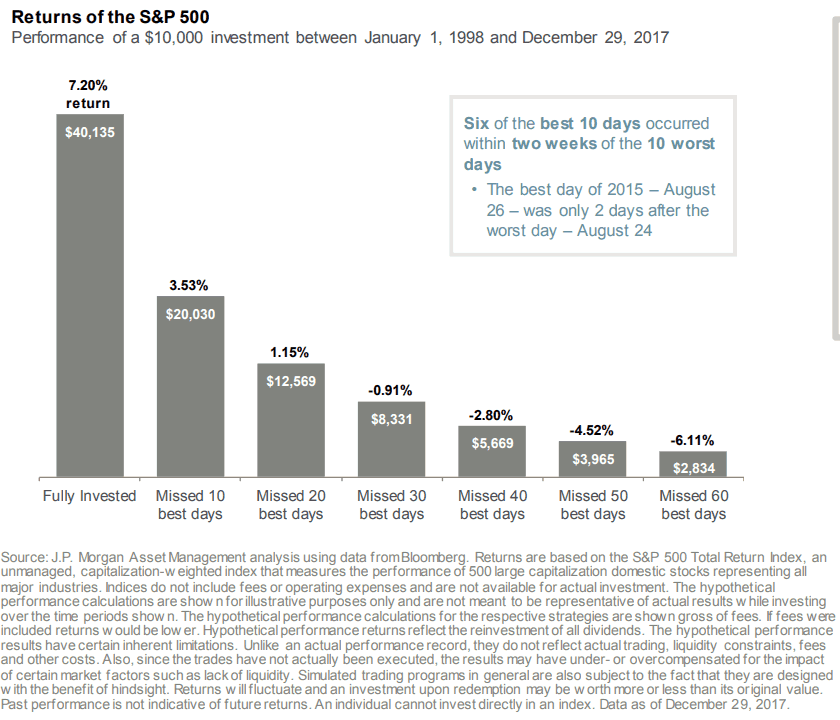
Source: JP Morgan. Information has been obtained from sources believed to be reliable and are subject to change without notification.
Two main takeaways from the illustration above are; 1) missing the best days over a period in the market could have a significant impact on a portfolios performance, and 2) some of the best days in the market over the period analyzed came shortly after the worst days. This means that if people reacted on the worst days and took their money from the market then they likely missed some of the best days.
Market timing is difficult over long periods of time and making drastic moves in asset allocation because of emotional reactions to volatility isn’t always the best strategy for long-term investing. Investors should align their portfolios taking both risk tolerance and time horizon into consideration and make sure the portfolio is updated as each of these change multiple times over longer periods.
When risk tolerance or time horizon do not change, most investors should focus on macro-economic trends rather than daily/weekly/monthly volatility of the market. Not experiencing the full weight of stock market declines could generate higher returns and if data shows the economy may be slowing, it could be a good time to take some “chips off the table”. That being said, looking at past down markets, some of the best days occur shortly after the worst days and staying invested enough to keep in line with your risk tolerance and time horizon could be the best strategy.
It is difficult to take the emotion out of investing when the money is meant to fund your future needs so speaking with your financial consultant to review your situation may be beneficial.
About Rob……...
Hi, I’m Rob Mangold. I’m the Chief Operating Officer at Greenbush Financial Group and a contributor to the Money Smart Board blog. We created the blog to provide strategies that will help our readers personally, professionally, and financially. Our blog is meant to be a resource. If there are questions that you need answered, please feel free to join in on the discussion or contact me directly.


Patience Should Reward Investors In 2018
Bottom line, the first half of 2018 was a tough pill to swallow for investors. They had to fight a constant rollercoaster. Volatility was high, returns were low, and the news was dominated with fears of trade wars. This environment has left investors questioning if we are on the eve of the next recession. Well I have good news. While trade wars have driven

Bottom line, the first half of 2018 was a tough pill to swallow for investors. They had to fight a constant rollercoaster. Volatility was high, returns were low, and the news was dominated with fears of trade wars. This environment has left investors questioning if we are on the eve of the next recession. Well I have good news. While trade wars have driven fear into the hearts of investors, during that same time period corporate earnings have been soaring and the U.S. economy has continued its growth path. For these reasons, disciplined investors may have good things waiting for them in the second half of 2018.
Coming Off A Big Year
As of the end of the second quarter, the S&P 500 Index was up 2.6% year to date. So why does 2018 seem like such a disappointment? You have to remember that 2017 was a huge year with the added benefit of very little volatility. It was a straight march up the entire year.
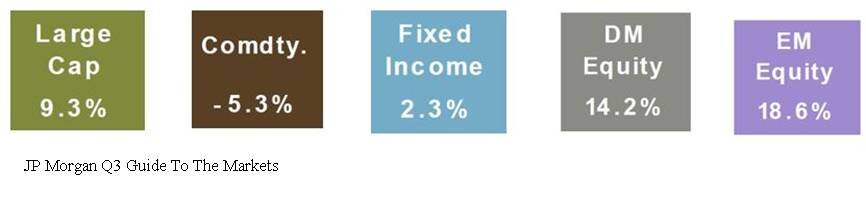
First, let’s compare the performance of the various asset classes in the first half of 2017 versus to first half of 2018. Below are the returns for the various assets classes in the first half of 2017:
Here are those same asset classes in the first half of 2018.
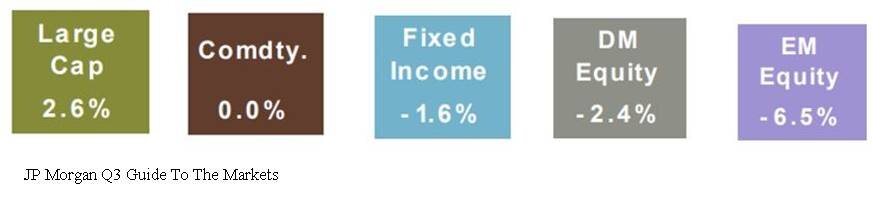
Obviously a huge difference. At this time last year, the S&P 500 Index was already up 9.3% for the year compared to 2.6% in 2018. International and emerging market equities were up over 14% in the first half of 2017. In 2018, those same international stocks were down over 2%. One might guess that bonds would preform better in a year with muted stock returns. Well, one would be wrong because the Barclay’s US Aggregate Bond Index was down 1.6% in the first 6 months of 2018.
Volatility Is Back
Not only has the first half of 2018 been a return drought but the level of volatility in the stock market has also spiked. In the first 6 months of 2017, the S&P 500 Index only had 2 trading days where the stock market moved plus or minus by more than 1% in a day. Guess how many trading days there were in the first half of 2018 where the S&P 500 Index moved up or down by more than 1% in a day.
The answer: 25 Days
That’s a 1,250% increase over 2017. No wonder everyone’s nerves are rattled. So the up 2% YTD in the stock market feels more like a down 10% because a lot has happened in a short period of time. Plus, the only big positive month for the stock market was in January which feels like forever ago.
Recency Bias
Investors are largely suffering for what we call in the investment industry as “recency bias”. In other words, what happened recently has now become the rule in the minds of investors. Investors are largely using 2017 as their measuring stick for 2018 performance and volatility. While it would seem that the dramatic increase in the level of volatility this year would classify 2018 as an abnormally volatile year, it’s actually 2017 that was the anomaly. Below is a chart that shows the annual return of the S&P 500 Index since 1980. The dots below each annual return are the market corrections that took place as some point during each calendar year.
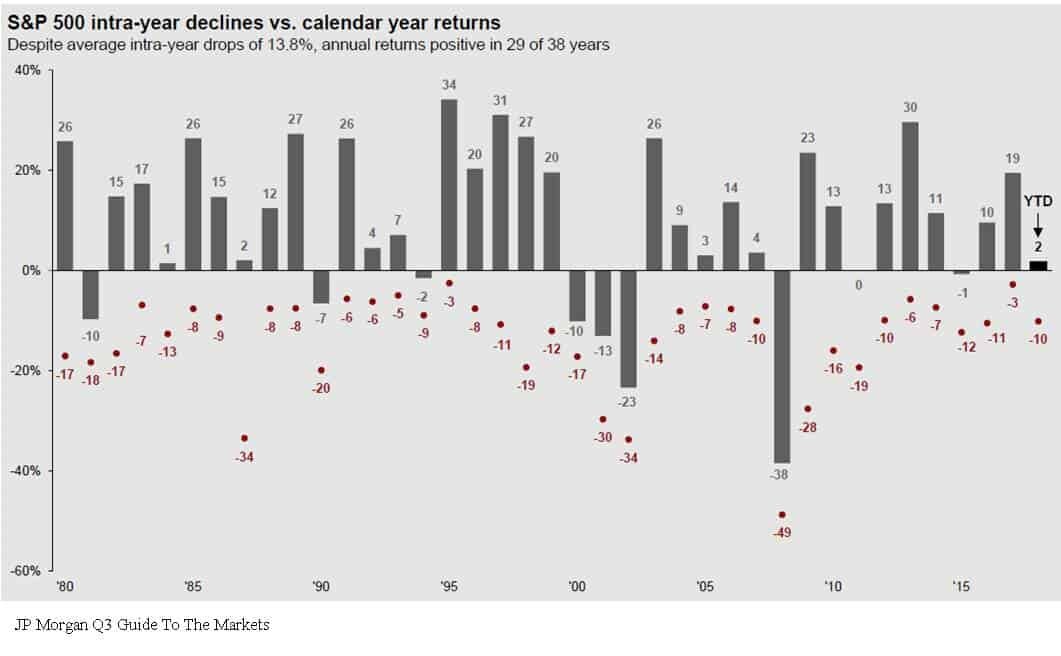
Based on historical data, it’s “normal” for the market to experience on average a 10% correction at some point during the year. Now look at 2017, the stock market was up 19% for the year but the largest correction during the year was 3%. That’s abnormal. By comparison, even though we are only half way through 2018, we have already experienced a 10% correction and as of June 30th, the S&P 500 Index is up 2% for the year.
Earnings Are King
Behind the dark clouds of the media headlines and the increased level of volatility this year is the dramatic increase in corporate earnings. Corporate earnings have not only increased but they have leaped forward. Take a look at the chart below:
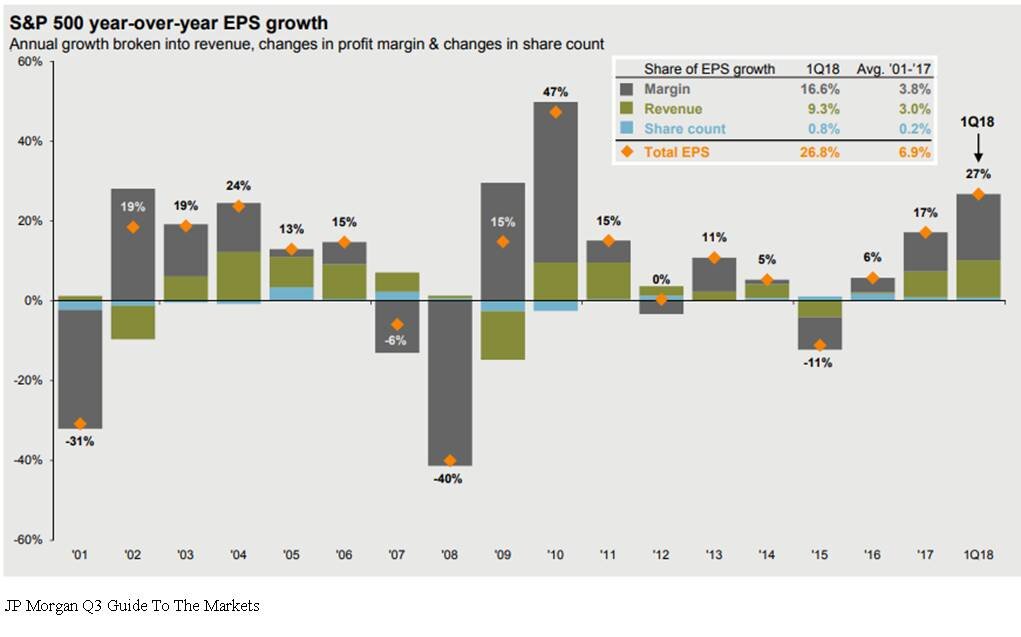
The market traditionally follows earnings. The earnings per share for the S&P 500 Index in 2017 was 17% which is a strong number historically. In the first quarterly of 2018, the year-over-year earnings per share growth was up 27%. That is a surge in corporate earnings. But you would have no idea looking at the meager 2% YTD return from the stock market this year. Pair that with the fact that the P/E of the S&P 500 is around 16 which is in line with its 20 year historic average. See the chart below:
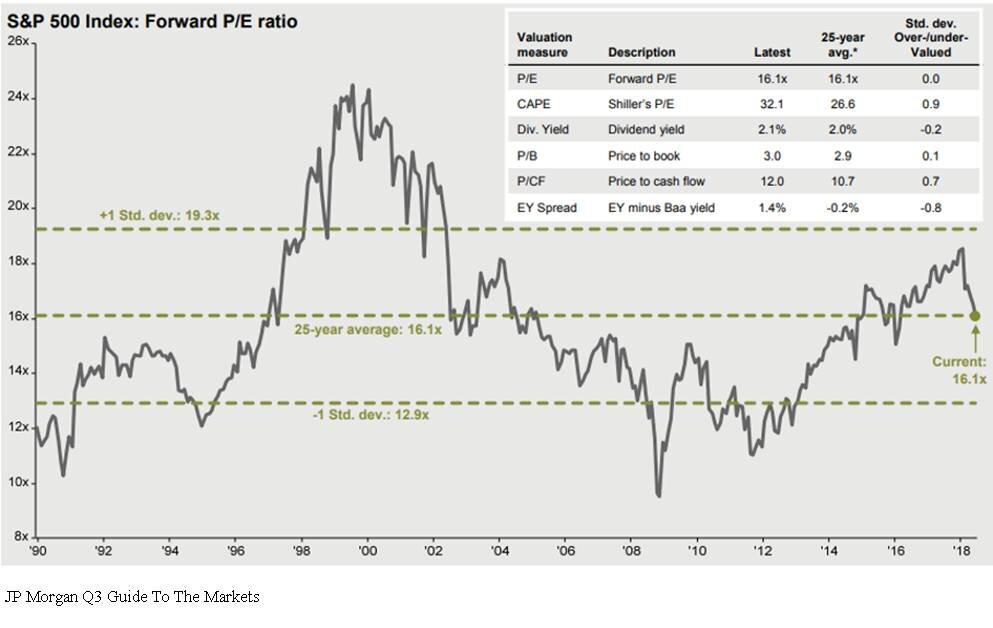
Even though it has been a long expansion, the market is not “over priced” by historic terms. If the stock market is fairly valued and corporate earnings are accelerating, one could make the case that the stock market has some catching up to do in the second half of the year.
The Chances Of A Recession Are Low
With the yield curve still positively sloped and the Composite Index of Leading Indicator, not only positive, but accelerating, a recession within the next 6 to 12 months seems unlikely. It’s like wandering through a jungle. When you are on the ground, the jungle is intimidating, there are plenty of things to be afraid of, and it’s tough to know which direction you should be walking. As investment advisors it’s our job to climb the tallest tree to get above the jungle to determine which way we should be walking.
In summary, 2018 has been an emotional roller coaster for investors. But making sound investment decision is about putting your emotions and gut feelings aside and looking at the hard economic data when making investment decisions. That data is telling us that we may very well be witnessing the soon to be longest economic expansion since 1900. The U.S. economy is strong, tax reform is boosting corporate earnings, interest rates are rising but are still at benign levels, and consumer sentiment is booming. In the later stages of an economic cycle, higher levels of volatility will be here to stay which will test the patience of investors. But overall the second half of the year could prove to be beneficial for investors that choose to climb the trees.

About Michael.........
Hi, I’m Michael Ruger. I’m the managing partner of Greenbush Financial Group and the creator of the nationally recognized Money Smart Board blog . I created the blog because there are a lot of events in life that require important financial decisions. The goal is to help our readers avoid big financial missteps, discover financial solutions that they were not aware of, and to optimize their financial future.


The Dow Dropped 362 Points Yesterday. Now What?
When you hear that the Dow Jones Industrial Average dropped by over 300 points it gets your attention. It triggers that automatic emotional response which leads you to ask, "Is the market rally ending?" I'm going to start this article by saying "I'm not a cheerleader for the stock market". As a cheerleader, it's your job to cheer whether your team is
When you hear that the Dow Jones Industrial Average dropped by over 300 points it gets your attention. It triggers that automatic emotional response which leads you to ask, "Is the market rally ending?" I'm going to start this article by saying "I'm not a cheerleader for the stock market". As a cheerleader, it's your job to cheer whether your team is winning or losing. Sometimes the general public views investment advisors that way. "Of course my advisor has a rosy outlook. He wants me to stay invested".
My view is when the cycle is ending it's ending. When the data tells us that we are headed toward the next recession, you just have to accept a lower expected rate of return and make the necessary allocation changes to preserve principal during the market downturn. The answer is not always "just hold through it" which is unfortunately the answer that some investors receive from their advisor regardless of what's happening in the markets and the economy.
What Has Changed?
Whenever you have a big down day in the market the first question you should ask yourself is "What changed?" I know the value of the stock market changed but the question I'm really asking is what fundamental change happened in the U.S. economy to trigger the selloff?
Did GDP growth rate pull back unexpectedly?
Did the monthly jobs report come up short? Did inflation increase by a large number that wasn't expected?
Are corporate earnings deteriorating?
Has the leading indicators index turned negative?
These are the real questions that you should be asking. Remember, the economy leads the stock market. The stock market does not lead the economy. Watching the fluctuations in the stock market and using that as a tool to make investment decisions is a recipe for disaster. You are much more likely to find success in your investments if you use a trading app uk that is able to help you track prices and automate your trading.
A growing economy typically means higher corporate earnings
Higher corporate earnings often results in higher stock prices
With that said, sometimes the market is down because it's reacting to poor economic data. In those cases, the market downturn may be warranted. However, that is not what I think happened yesterday. We did not get a bad jobs number or shortfall in GDP growth. In short, as of yesterday, nothing has changed from an economic standpoint. Days like yesterday are just a reminder of what volatility in the markets feels like.
Higher Volatility Ahead
If you asked me if I expect more or less days like yesterday in 2018, my guess would be more. We are all suffering from "recency bias". 2017 was this nice smooth ride higher with very few interruptions. When you get used to sailing in smooth waters, a small wave can seem like a tsunami. Below is a chart of the CBEO Vix Index from January 2002 – January 2018 which is used to gauge the level of volatility in the U.S. stock market:
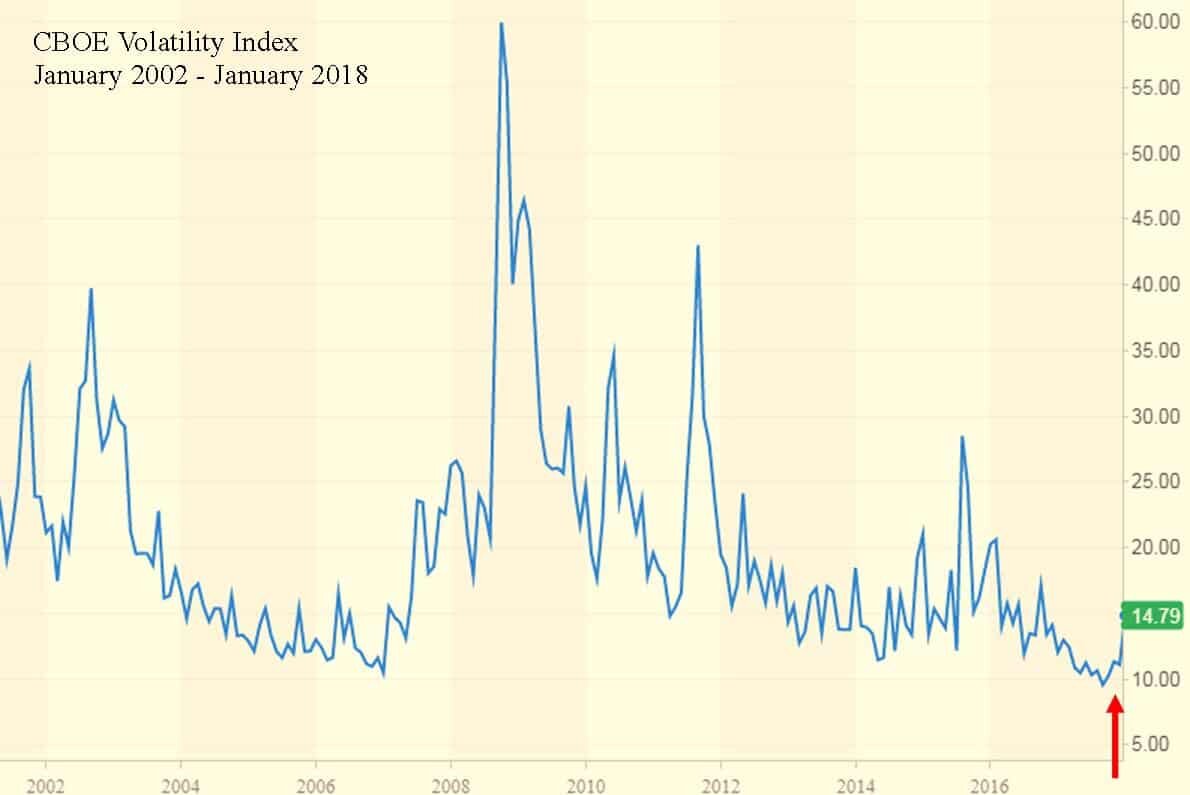
As you can see, we are coming off of historically low levels of volatility and we have to remember that volatility is normal. Every down tick in the stock market is not necessarily a signal that a recession is coming.
The Math Is Different
What if I told you that the market was only down 177 points yesterday? It probably does not trigger the same fear reaction as being down over 350 points. The reason why I ask this question is you have to remember that the price level of the Dow has doubled over the last 6 years. So a 300 point drop in the Dow Jones Industrial Average today does not mean the same thing as a 300 point drop in 2012. On February 17, 2012, the Dow Jones Industrial Average closed at 12,949. Today it sits just above 26,000. In percentage terms, a 300 drop in 2012 equaled a 2.3% drop in the stock market. If you translate that to where the stock market is today, you would need a 598 point drop in a single day to get that same 2.3% drop. It's just math but we have to remember this when the headlines in the media read:
"The Dow Dropped By 300 Points Today. Traders Are Worried That This Could Be The End Of The Rally?"
Never Hesitate
While I write these articles to help our clients and readers to become better investors and to put important market events into perspective, I have a special note that I want to leave off on for our clients. When you have that feeling of uncertainty, never hesitate to contact me. That quick phone call just to ask, "Mike, should I be worried?" That's what I'm here for. Have a great week everyone!!
About Michael.........
Hi, I’m Michael Ruger. I’m the managing partner of Greenbush Financial Group and the creator of the nationally recognized Money Smart Board blog . I created the blog because there are a lot of events in life that require important financial decisions. The goal is to help our readers avoid big financial missteps, discover financial solutions that they were not aware of, and to optimize their financial future.


A New Year: Should I Make Changes To My Retirement Account?
A simple and easy answer to this question would be…..Maybe? Not only would that answer make this article extremely short, it wouldn’t explain some important items that participants should take into consideration when making decisions about their retirement plan.Every time the calendar adds a year we get a sense of reset. A lot of the same tasks on the

A simple and easy answer to this question would be…..Maybe? Not only would that answer make this article extremely short, it wouldn’t explain some important items that participants should take into consideration when making decisions about their retirement plan.Every time the calendar adds a year we get a sense of reset. A lot of the same tasks on the to do list get added each January and hopefully this article helps you focus on matters to consider regarding your retirement plan.
Should I Consult With The Advisor On My Plan?
At our firm we make an effort to meet with participants at least annually. Saving in company retirement plans is about longevity so many times the individual meetings are brief and no allocation changes are made. Even if this is the result, an overview of your account, at least annually, is a good way to keep retirement savings fresh in your mind and add a sense of comfort that you’re investing appropriately based on your time horizon and risk tolerance.
These individual meetings are also a good time to discuss other financial questions you may have. Your retirement plan is only a piece of your financial plan and we encourage participants to use the resources available to them. Often times these meetings start off as a simple account overview but turn into lengthy conversations about various financial decisions the participant has been weighing.
How Much Should I Be Contributing This Year?
This answer is not the same for everyone because, among other things, people have different retirement goals, financial situations, and time horizon. That being said, if the company has a match component in their plan, the first milestone would be to contribute enough to receive the most the company is willing to give you. For example, if the company will match 100% of your contributions up to 3% of pay, any amount you contribute less than 3% will leave you missing out on retirement savings the company is willing to provide you.
Again, the amount that should be saved is dependent on the individual but saving anywhere from 10% to 15% of your compensation is a good benchmark. In the previous example, if the company will match 3%, that means you would have to contribute 7% to achieve the lower end of that benchmark. This may seem like a difficult task so starting at an amount you are comfortable with and working your way to your ultimate goal is important.
Should You Be Making Allocation Changes?
The initial allocation you choose for your retirement account is important. Selecting the appropriate portfolio from the start based on your risk tolerance and time until retirement can satisfy your investment needs for a number of years. The chart below shows that over longer periods of time historical annual returns tend to be less volatile.
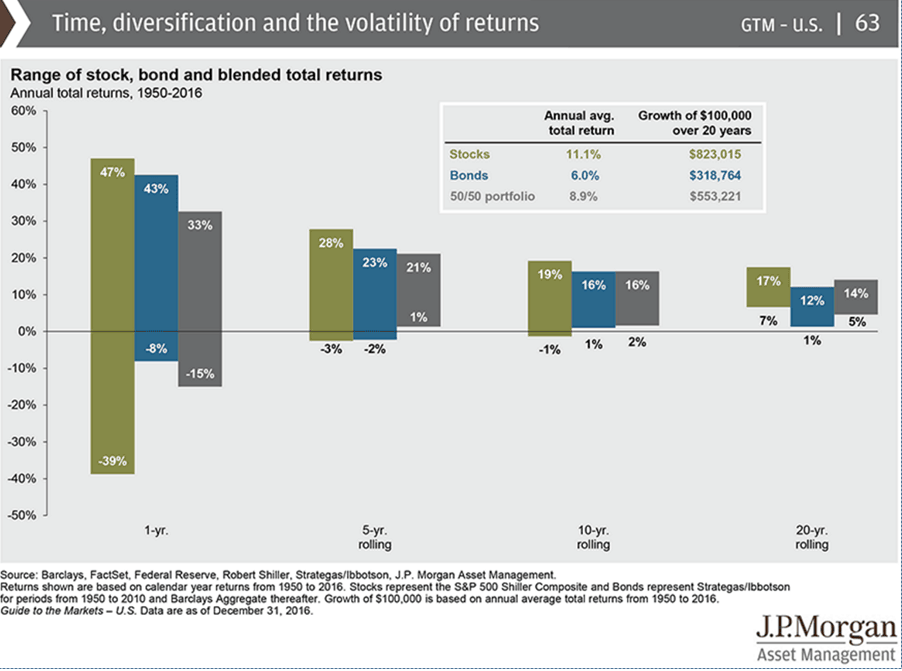
When you have over 10 years until retirement, reviewing the account at least annually is important as there are a number of reasons you would want to change your allocation. Lifestyle changes, different retirement goals, or specific investment performance to name a few. Participants tend to lose out on investment return when they try to time the market and are forced to sell low and buy high. This chart shows that even though there may be volatility in the short term, as long as you have time and an appropriate allocation from the start, you should see returns that will help you achieve your retirement goals.
About Rob……...
Hi, I’m Rob Mangold. I’m the Chief Operating Officer at Greenbush Financial Group and a contributor to the Money Smart Board blog. We created the blog to provide strategies that will help our readers personally , professionally, and financially. Our blog is meant to be a resource. If there are questions that you need answered, pleas feel free to join in on the discussion or contact me directly.
