

Volatility, Market Timing, and Long-Term Investing
For many savers, the objective of a retirement account is to accumulate assets while you are working and use those assets to pay for your expenses during retirement. While you are in the accumulation phase, assets are usually invested and hopefully earn a sufficient rate of return to meet your retirement goal. For the majority,
Volatility, Market Timing, and Long-Term Investing
For many savers, the objective of a retirement account is to accumulate assets while you are working and use those assets to pay for your expenses during retirement. While you are in the accumulation phase, assets are usually invested and hopefully earn a sufficient rate of return to meet your retirement goal. For the majority, these accounts are long-term investments and there are certain investing ideas that should be taken into consideration when managing portfolios. This article will discuss volatility, market timing and their role in long-term retirement accounts.
“Market timing is the act of moving in and out of the market or switching between asset classes based on using predictive methods such as technical indicators or economic data” (Investopedia). In other words, trying to sell investments when they are near their highest and buy investments when they are near their lowest. It is difficult, some argue impossible, to time the market successfully enough to generate higher returns. Especially over longer periods. That being said, by reallocating portfolios and not experiencing the full loss during market downturns, investors could see higher returns. When managing portfolios over longer periods, this should be done without the emotion of day to day volatility but by analyzing greater economic trends.
So far, the stock market in 2018 has been volatile; particularly when compared to 2017. Below are charts of the S&P 500 from 1/1/2018 – 10/21/2018 and the same period for 2017.
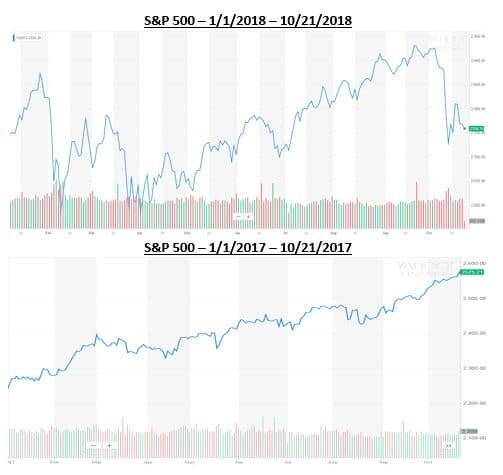
Source: Yahoo Finance. Information has been obtained from sources believed to be reliable and are subject to change without notification.
Based on the two charts above, one could conclude the majority of investors would prefer 2017 100% of the time. In reality, the market averages a correction of over 10% each year and there are years the market goes up and there are years the market goes down. Currently, the volatility in the market has a lot of investors on edge, but when comparing 2018 to the market historically, one could argue this year is more typical than a year like 2017 where the market had very little to no volatility.
Another note from the charts above are the red and green bars on the bottom of each year. The red represent down days in the market and the green represent up days. You can see that even though there is more volatility in 2018 compared to 2017 when the market just kept climbing, both years have a mixture of down days and up days.
A lot of investors become emotional when the market is volatile but even in the midst of volatility and downturns, there are days the market is up. The chart below shows what happens to long-term portfolio performance if investors miss the best days in the market during that period.
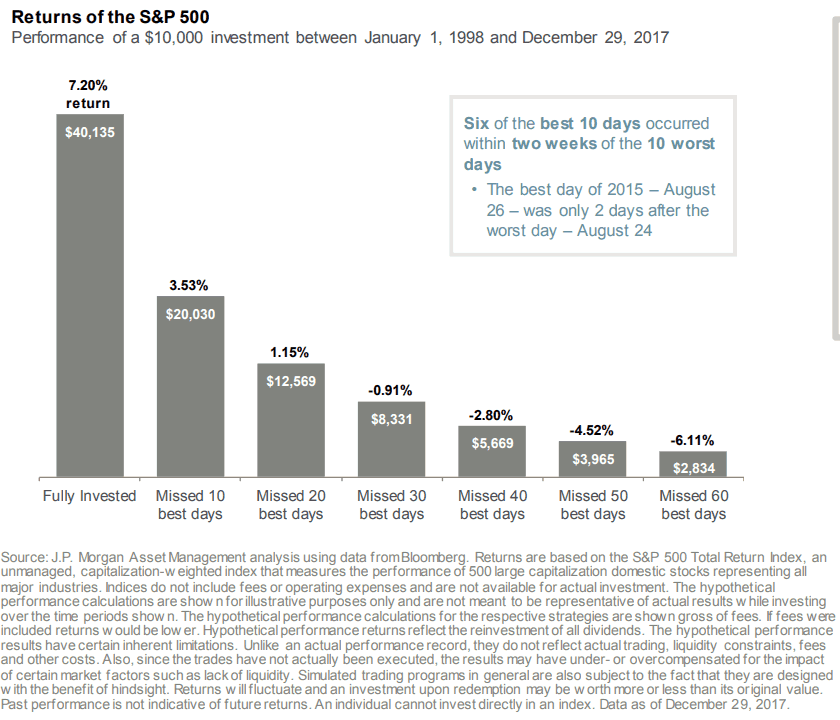
Source: JP Morgan. Information has been obtained from sources believed to be reliable and are subject to change without notification.
Two main takeaways from the illustration above are; 1) missing the best days over a period in the market could have a significant impact on a portfolios performance, and 2) some of the best days in the market over the period analyzed came shortly after the worst days. This means that if people reacted on the worst days and took their money from the market then they likely missed some of the best days.
Market timing is difficult over long periods of time and making drastic moves in asset allocation because of emotional reactions to volatility isn’t always the best strategy for long-term investing. Investors should align their portfolios taking both risk tolerance and time horizon into consideration and make sure the portfolio is updated as each of these change multiple times over longer periods.
When risk tolerance or time horizon do not change, most investors should focus on macro-economic trends rather than daily/weekly/monthly volatility of the market. Not experiencing the full weight of stock market declines could generate higher returns and if data shows the economy may be slowing, it could be a good time to take some “chips off the table”. That being said, looking at past down markets, some of the best days occur shortly after the worst days and staying invested enough to keep in line with your risk tolerance and time horizon could be the best strategy.
It is difficult to take the emotion out of investing when the money is meant to fund your future needs so speaking with your financial consultant to review your situation may be beneficial.
About Rob……...
Hi, I’m Rob Mangold. I’m the Chief Operating Officer at Greenbush Financial Group and a contributor to the Money Smart Board blog. We created the blog to provide strategies that will help our readers personally, professionally, and financially. Our blog is meant to be a resource. If there are questions that you need answered, please feel free to join in on the discussion or contact me directly.


What Happened The Last Time The Dow Dropped By More Than 4% In A Day?
Yesterday was an “ouch”. The Dow Jones Industrial average dropped by more than 1000 points resulting in a 4.60% drop in the value of the index. While yesterday marked the largest “point” decline in the history of the Dow Jones Index, it was not anywhere near the largest percentage decline which is the metric that we care about.

Yesterday was an “ouch”. The Dow Jones Industrial average dropped by more than 1000 points resulting in a 4.60% drop in the value of the index. While yesterday marked the largest “point” decline in the history of the Dow Jones Index, it was not anywhere near the largest percentage decline which is the metric that we care about.
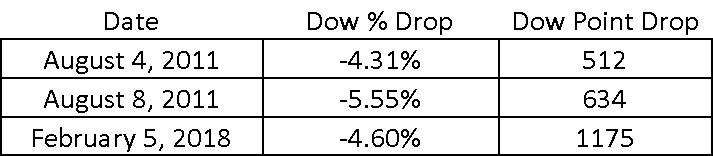
Below is a chart that shows the largest daily “point” losses in the history of the Dow Jones Industrial Index:
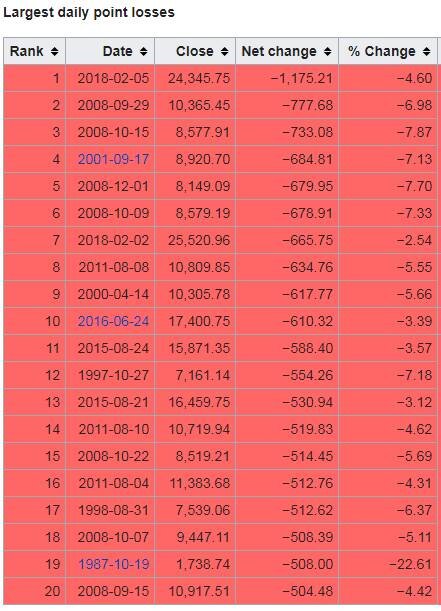
You will find yesterday at the top of the chart. Now look at the column all the way to the right labelled “% change”. You will notice that while yesterday topped the chart from a point decline, it does not come anywhere near the largest percentage decline that we have seen. In fact, it does not even make it in the top 20 worse days for the Dow. See the chart below that shows the largest daily percentage declines in the Dow’s history:

What Happened Last Time?
Whenever there is a big drop in the stock market, I immediately start looking back in history to find market events that are similar to the current one. So when was the last time the market dropped by more than 4% in a single day?
The answer: August 8, 2011
If you remember, 2011 was the start of the European Sovereign Debt Crisis. That was when Greece, Portugal, Spain, and Ireland announced that they were unable to repay their government debt and needed a bailout package from the European Union to survive. There were two single day declines in the month of August that rivaled what we saw yesterday.
How Long Did It Take The Market To Come Back?
If we are looking to history as a guide, how long did it take for the market to recoup the losses after these large single day declines? On July 31, 2011 the Dow Jones Industrial closed at 11,444, the Europe debt crisis hit, and the market experienced those two 4%+ decline days on August 4th and August 8th. By September 11, 2011, the Dow Jones closed at 11,509, recouping all of its losses from the beginning of August. Thus making the answer to the question: 38 days. The market took 38 days to recoup all of the losses from not one but two 4%+ decline days in 2011.
We Don’t Have A Crisis
The main difference between 2011 and now is we don’t have a global economic crisis. In my opinion, the market correction in 2011 was warranted. There was a real problem in Europe. We were not sure how and if those struggling Eurozone countries could be saved so the market dropped.
The only trigger that I hear analysts pointing to in an effort to explain the selloff yesterday is the 2.9% wage growth number that we got on Friday. This in turn has sparked inflation fears and in reaction, the Fed may decide to hike rates four times this year instead of three. Hardly a “crisis”. Outside of that nothing else meaningful has happened to trigger the volatility that we are seeing in the stock market. OK……so what should you do in reaction to this? Sometimes the right answer is “nothing”. It’s difficult to hear that because emotionally you want to pull money out of the market and run to cash or bonds but absent a sound economic reason for making that move, at this point, the best investment decision may be to just stay the course.
We Have Forgotten What Volatility Feels Like
When you are in a market environment like 2017, you very quickly forget what normal market volatility feels like. In 2017, the stock market just gradually climbed throughout the year without any hiccups. That’s not normal. Below is a chart that shows the magnitude of market corrections each year going back to 1990. As you will see, on average, when the economy is not in a recession, the market averages an 11.56% correction at some point during the year. In 2017, we only experienced a 3% correction.

intra year drops in the S&P 500 Index
Now the next chart shows you the big picture. Not only does it illustrate the amount of the largest market correction during the year but it also shows the return of the S&P 500 for the year.

Look at 2016. In 2016, at some point in the year the S&P 500 Index dropped by 11%. If you just held through it, the S&P 500 returned 10% for the year.
In 2011, the S&P 500 dropped by 19% during the year!! If you didn’t sell and just held through the volatility, you would have had a breakeven year.
Easier Said Than Done
Every big market correction feels like a new world ending crisis. It’s not. We have been fortunate enough to have a nice easy ride for the past 12 months but it seems like we are returning to more historical levels of volatility. Days like February 5, 2018 will test your patience and make you feel compelled to react. It’s easy to look back and confess that “yes, I should have just held through it” but it’s easier said than done.
It’s important to understand the catalysts that are driving the volatility in the markets. Sometimes the markets are dropping for a good reason and other times it’s just plain old fashion volatility. Based on what we have seen over the past few days and absent the emergence of a new economic, political, or global crisis, we expect it to be the later of the two.

About Michael……...
Hi, I’m Michael Ruger. I’m the managing partner of Greenbush Financial Group and the creator of the nationally recognized Money Smart Board blog . I created the blog because there are a lot of events in life that require important financial decisions. The goal is to help our readers avoid big financial missteps, discover financial solutions that they were not aware of, and to optimize their financial future.


The Dow Dropped 362 Points Yesterday. Now What?
When you hear that the Dow Jones Industrial Average dropped by over 300 points it gets your attention. It triggers that automatic emotional response which leads you to ask, "Is the market rally ending?" I'm going to start this article by saying "I'm not a cheerleader for the stock market". As a cheerleader, it's your job to cheer whether your team is
When you hear that the Dow Jones Industrial Average dropped by over 300 points it gets your attention. It triggers that automatic emotional response which leads you to ask, "Is the market rally ending?" I'm going to start this article by saying "I'm not a cheerleader for the stock market". As a cheerleader, it's your job to cheer whether your team is winning or losing. Sometimes the general public views investment advisors that way. "Of course my advisor has a rosy outlook. He wants me to stay invested".
My view is when the cycle is ending it's ending. When the data tells us that we are headed toward the next recession, you just have to accept a lower expected rate of return and make the necessary allocation changes to preserve principal during the market downturn. The answer is not always "just hold through it" which is unfortunately the answer that some investors receive from their advisor regardless of what's happening in the markets and the economy.
What Has Changed?
Whenever you have a big down day in the market the first question you should ask yourself is "What changed?" I know the value of the stock market changed but the question I'm really asking is what fundamental change happened in the U.S. economy to trigger the selloff?
Did GDP growth rate pull back unexpectedly?
Did the monthly jobs report come up short? Did inflation increase by a large number that wasn't expected?
Are corporate earnings deteriorating?
Has the leading indicators index turned negative?
These are the real questions that you should be asking. Remember, the economy leads the stock market. The stock market does not lead the economy. Watching the fluctuations in the stock market and using that as a tool to make investment decisions is a recipe for disaster. You are much more likely to find success in your investments if you use a trading app uk that is able to help you track prices and automate your trading.
A growing economy typically means higher corporate earnings
Higher corporate earnings often results in higher stock prices
With that said, sometimes the market is down because it's reacting to poor economic data. In those cases, the market downturn may be warranted. However, that is not what I think happened yesterday. We did not get a bad jobs number or shortfall in GDP growth. In short, as of yesterday, nothing has changed from an economic standpoint. Days like yesterday are just a reminder of what volatility in the markets feels like.
Higher Volatility Ahead
If you asked me if I expect more or less days like yesterday in 2018, my guess would be more. We are all suffering from "recency bias". 2017 was this nice smooth ride higher with very few interruptions. When you get used to sailing in smooth waters, a small wave can seem like a tsunami. Below is a chart of the CBEO Vix Index from January 2002 – January 2018 which is used to gauge the level of volatility in the U.S. stock market:
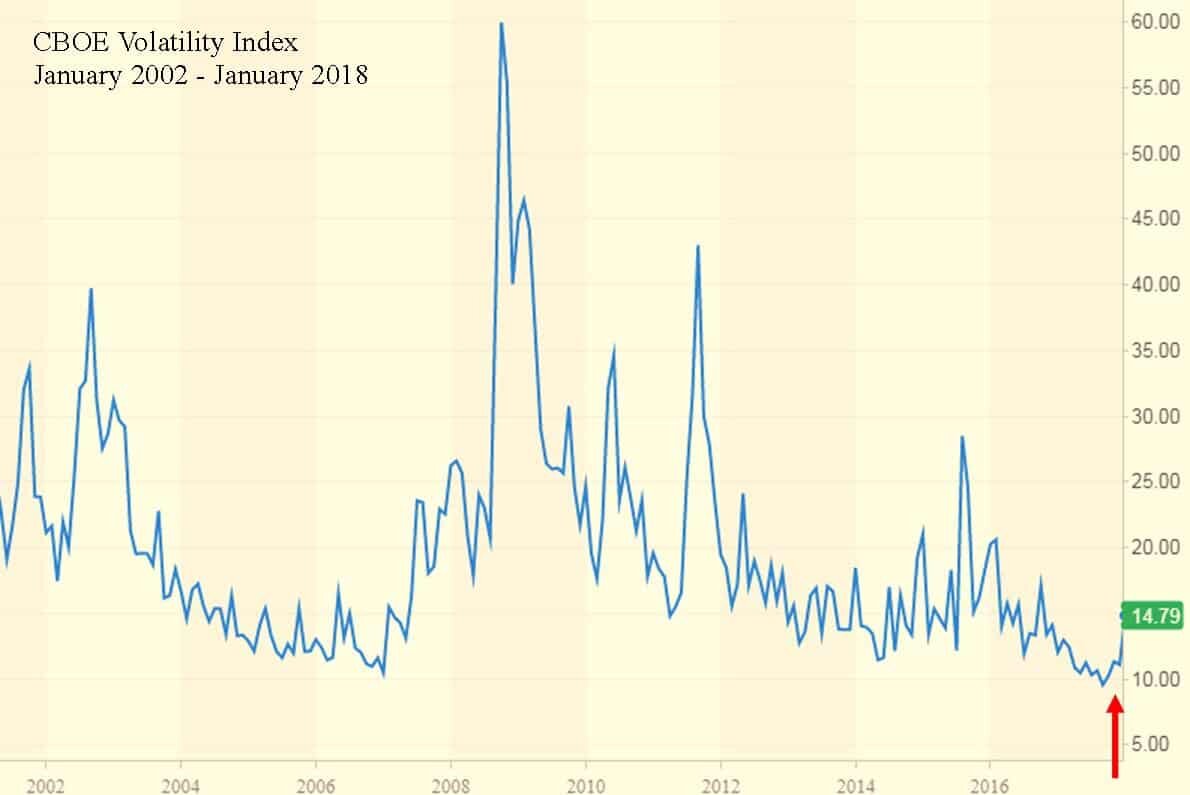
As you can see, we are coming off of historically low levels of volatility and we have to remember that volatility is normal. Every down tick in the stock market is not necessarily a signal that a recession is coming.
The Math Is Different
What if I told you that the market was only down 177 points yesterday? It probably does not trigger the same fear reaction as being down over 350 points. The reason why I ask this question is you have to remember that the price level of the Dow has doubled over the last 6 years. So a 300 point drop in the Dow Jones Industrial Average today does not mean the same thing as a 300 point drop in 2012. On February 17, 2012, the Dow Jones Industrial Average closed at 12,949. Today it sits just above 26,000. In percentage terms, a 300 drop in 2012 equaled a 2.3% drop in the stock market. If you translate that to where the stock market is today, you would need a 598 point drop in a single day to get that same 2.3% drop. It's just math but we have to remember this when the headlines in the media read:
"The Dow Dropped By 300 Points Today. Traders Are Worried That This Could Be The End Of The Rally?"
Never Hesitate
While I write these articles to help our clients and readers to become better investors and to put important market events into perspective, I have a special note that I want to leave off on for our clients. When you have that feeling of uncertainty, never hesitate to contact me. That quick phone call just to ask, "Mike, should I be worried?" That's what I'm here for. Have a great week everyone!!
About Michael.........
Hi, I’m Michael Ruger. I’m the managing partner of Greenbush Financial Group and the creator of the nationally recognized Money Smart Board blog . I created the blog because there are a lot of events in life that require important financial decisions. The goal is to help our readers avoid big financial missteps, discover financial solutions that they were not aware of, and to optimize their financial future.


What Does Tax Reform Mean For The Markets In 2018?
2017 ended up being a huge year for the U.S. stock market. The rally in the stock market was unmistakably driven by the anticipated passing of tax reform and Congress delivered. However, the sheer magnitude of the stock market rally has presented investors with a moment of pause and a lot of unanswered questions as we enter into the first quarter

2017 ended up being a huge year for the U.S. stock market. The rally in the stock market was unmistakably driven by the anticipated passing of tax reform and Congress delivered. However, the sheer magnitude of the stock market rally has presented investors with a moment of pause and a lot of unanswered questions as we enter into the first quarter of 2018. The two main questions being:
What does tax reform mean for the markets in 2018?
We are now in the second longest economic expansion of ALL TIME!!! I know what goes up, eventually comes down. Are we overdue for a major correction in the stock market?
Without a crystal ball, no one knows for sure. However, the purpose of this article is to identify indicators in the economy and the financial markets that may help us gauge the direction of the U.S. economy and equity markets as we progress through 2018.
Tax Reform: Uncharted Waters
While tax reform is a welcome friend for corporate America, we have to acknowledge that this also puts us in uncharted waters. Looking back, there has never been a time in history where the U.S. has injected fiscal stimulus (tax reform) into an economy that is already healthy. The last major tax reform was in the early 1980’s when the U.S. economy was trying to dig itself out of the long 1970’s recession.
When the economy is in a recession, the U.S. can either inject fiscal stimulus or monetary stimulus to get the economy growing again. The U.S. used monetary stimulus to dig us out of the Great Recession of 2008 – 2009. They lowered interest rates to basically 0%, pumped cash into the economy in the form of bond buying, and provided a financial back stop for the U.S. banking system.
These economic stimulus tools are similar to the concept of giving a patient in a hospital a shot of adrenaline. If a patient is flat lining, it provides that patient with a huge surge of energy. The patient’s body goes from 0% to 60%+ in under a minute. So what happens when you give someone who is completely healthy a shot of adrenaline? Do they go from 100% to 110%? My point is a healthy patient does not go from 100% to 160%. Both patients get a boost but the boost to the healthy patient is much lower as a percentage of where they started.
While we have never given the U.S. economy an adrenaline shot after a long economic expansion, I think it’s reasonable to apply the same general concept as our two hospital patients. Tax reform may very well lead to another year of positive returns for the stock market in 2018 but I think it’s very important for investors to set a reasonable expectation of return for the U.S. equity markets given the fact that we are injecting growth into an economy that is already at “full employment”.
Not Enough Workers
One of the greatest challenges that the U.S. economy may face in 2018 is a shortage of qualified workers. Prior to tax reform being passed, companies both large and small, have had plenty of job openings but have not been able to find the employees with the skills necessary to fill those positions.
For example, if Apple had 1000 job openings in November 2017 just to meet the current demand for their goods and services but in 2018, due to tax reform, consumers have more money to spend, and the demand for Apple products increases further, Apple may need to find another 2000 employee to meet the increase in demand. They are having trouble now finding the 1000 employees to meet their current demand, how are they going to find another 2000 quick enough in 2018 to meet the increase in demand? If they can’t make the phones, they can’t sell the phones. Fewer sales equals less revenue, which equals less net profit, which may lead to a lower appreciation rate of the stock price. For disclosure purposes, I’m not picking on Apple. I’m just highlighting an issue that may be common among the companies that make up the S&P 500 Index if tax reform leads to a spike in demand in 2018. If Wall Street is expecting accelerated earnings, how are the companies expected to deliver those enhanced earnings without the employees that they need to increase supply?
The unemployment rate in the U.S. is currently 4.1%. You have to go all the way back to the late 1960’s to find an employment rate below 4%. So we are essentially at “full employment”.
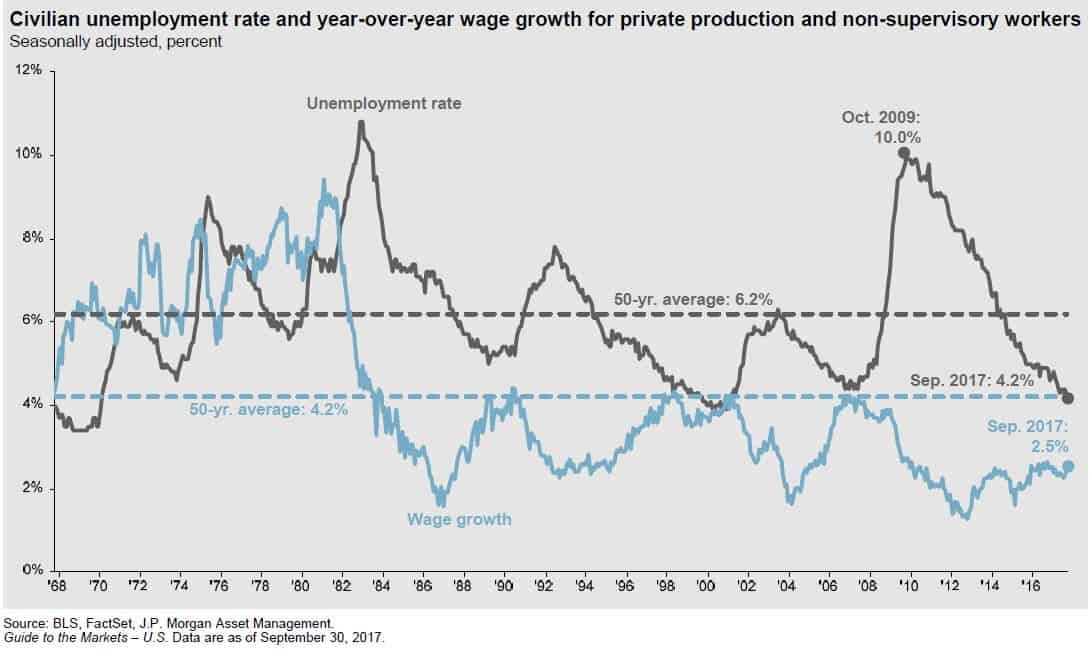
Rising Wages
The blue line in the chart above is also very important. The blue line represents wage growth. This answers the question: "Are people making more for doing the same amount of work?" If you look back historically on the chart, when the unemployment rate was falling, typically wage growth was increasing. It makes sense. When the economy is good and the job market is healthy, companies have to pay their employees more to keep them. Otherwise they will go work for a competitor, who has 10 job openings, and they get paid more. Wage growth is good for employees but it's bad for companies. For companies, employee wages are usually their largest expense. If you increase wages, you are increasing expenses, which decreases profits. Lower profits typically results in lower stock prices. Companies in 2017 had the luxury of strong demand but limited wage growth. My guess is you will begin to see meaningful wage growth in 2018 as companies see an increase in demand as a result of tax reform and end up having to raise wages to retain and attract employees. This is just another reason why 2018 may be a good year for the stock market but not a great one.
What Fuels GDP Growth?
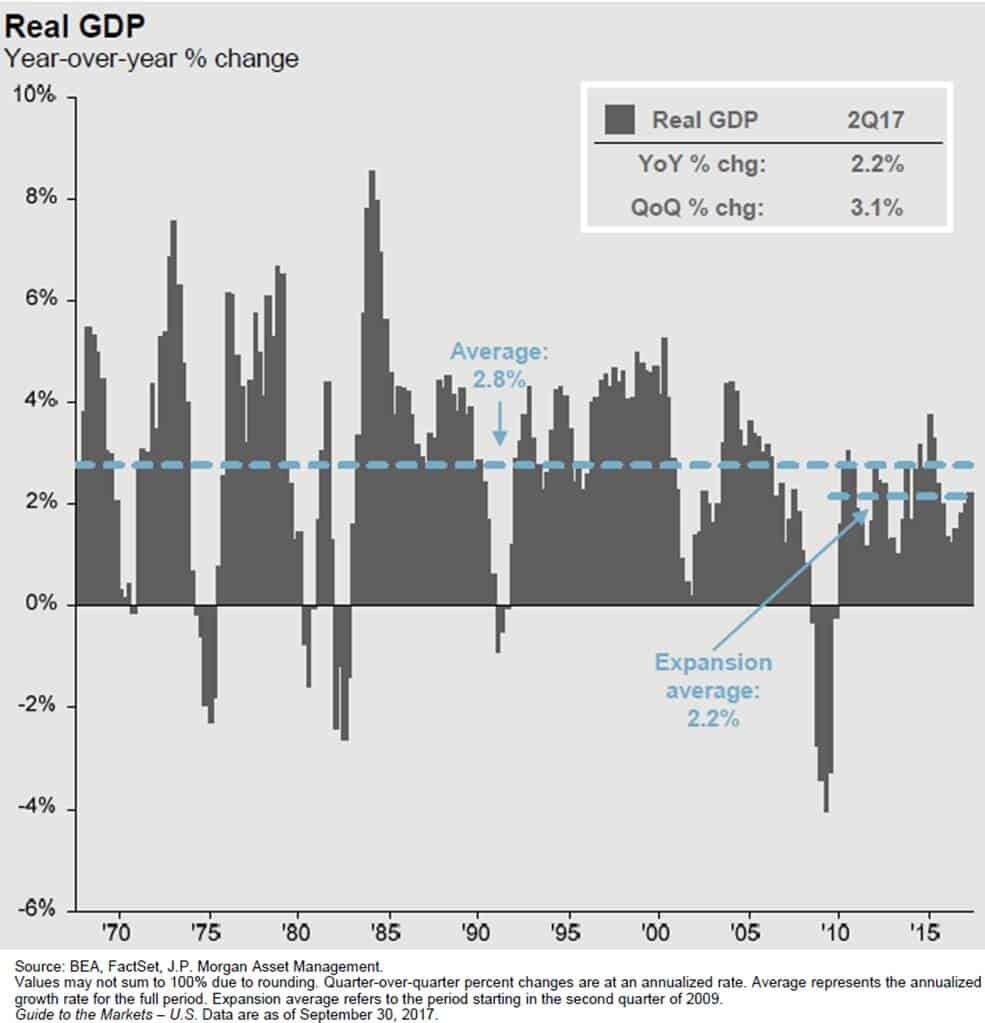
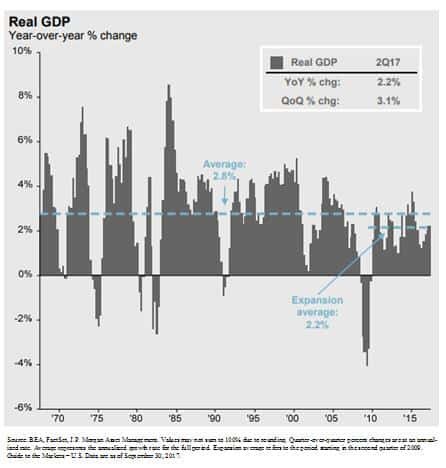
Gross Domestic Product ("GDP") is the economic indicator that is used to measure how much the U.S. economy produces in a year. It's how we gauge whether our economy is growing or contracting. Since March 2009, the GDP growth rate has averaged about 2.2% per year. This is subpar by historic standards. In most economic expansions, GDP is growing at an annual rate of 4%+.
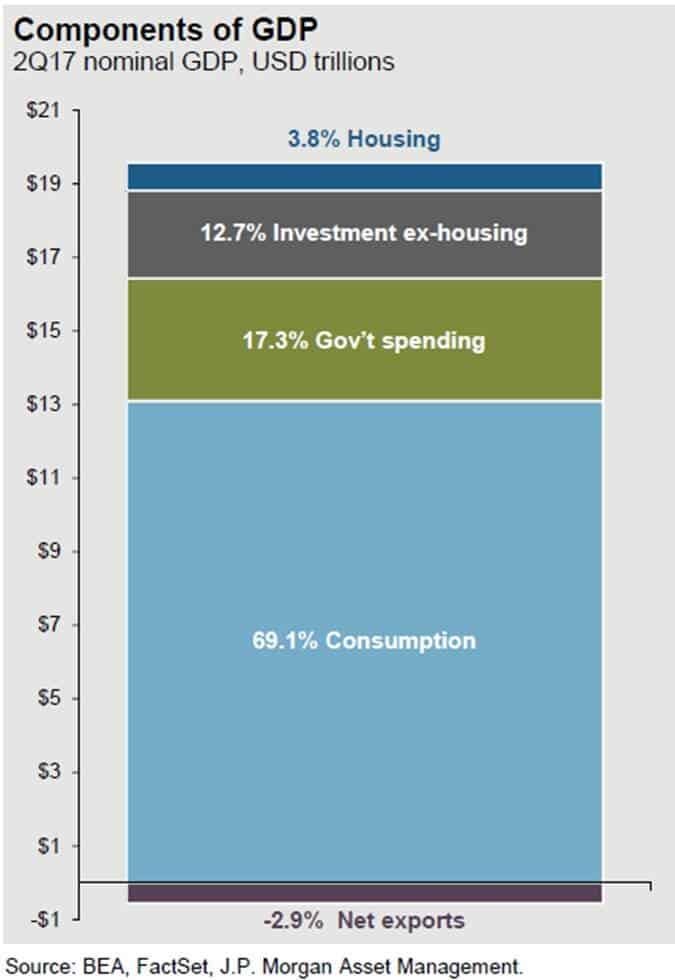
Before we get into what pieces of tax reform may help to increase the GDP growth rate, let us first look at what GDP is made of. Our GDP is comprised of 5 categories (for my fellow econ nerds that assign 4 categories to GDP, we split capital spending into two separate categories):
Consumption or "Consumer Spending" 69.1%
Government Spending (includes defense) 17.3%
Investment (ex-housing) – "Business Spending 12.7%
Housing 3.8%
Net Exports -2.9%
Consumer Spending (+)
Consumer spending which makes up 69.1% of our GDP should increase as a result of tax reform in 2018. In general, if people have more discretionary income, they will spend all or a portion of it. Tax reform will lower the tax bill, for not all, but many U.S. households, increasing their disposable income. Also, if we see an increase in wage growth in 2018, people will be taking home more in their paychecks, allowing them to spend more.
Dr James Kelly, the chief economist of JP Morgan, made a very interesting observation about the evolution of the tax bill. When the tax bills were in their proposed state, one for the Senate and a separate bill for the House, each bill to stay under the $1.5 Trillion 10 year debt cap reduced taxes by about $150 Billion dollars per year. 50% of the annual tax reduction was going to businesses with the other 50% going to individual tax payers.
In order to get the bill passed before the end of the year, Congress was forced to shift a larger proportion of the $150 billion in tax brakes per year to individual taxpayers. In the tax bill’s final form, Dr Kelly estimated that approximately 75% of the tax reductions were now being retained by individual taxpayers with only 25% going to businesses. With a larger proportion of the tax breaks going to individual taxpayers that could increase the amount of discretionary income available to the U.S. consumer.
Government Spending (Push)
The anticipated increase in government spending really stems from the Trump agenda that has been communicated. One of the items that he campaigned on was increasing government spending on infrastructure. At this point we do not have many details as to when the infrastructure spending will begin or how much will be spent. Whatever ends up happening, we are not forecasting a dramatic increase or decrease in government spending in 2018.
Investment - Business Spending (+)
Even though business spending only represents 12.7% of our GDP, we could see a sizable increase in spending by businesses in 2018 for the following reasons:
Corporate tax rate is reduced from 35% to 21%
The repatriation tax will allow companies to bring cash back from overseas at a low tax rate
Prior to tax reform, companies already had historically high levels of cash on their balance sheet. What are they going to do with more cash? (See the chart below)
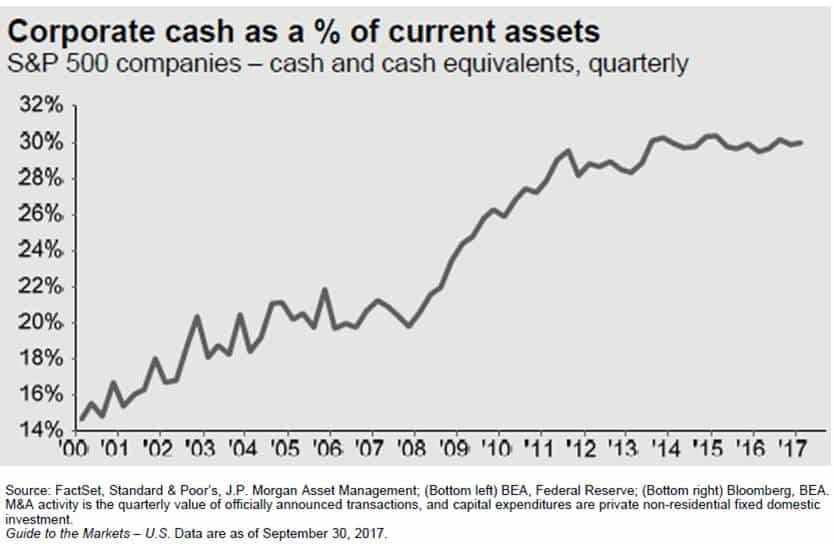
If having more cash was not a large enough incentive by itself for companies to spend money, the new tax rules allowing immediate expensing of the full cost of most assets purchased for the next five years should be. Under the current tax rules, when a business purchases a new piece of equipment, a fleet of trucks, office furniture, whatever it is, the IRS does not allow them to deduct 100% of purchase price in the year that they buy it. They have to follow a "depreciation schedule" and they can only realize a piece of that expense each year. The current tax rules put companies at a tax disadvantage because companies are always trying to shelter as much income as possible from taxation. If Company XYZ buys a piece of equipment that cost $1,000,000, the IRS may require Company XYZ to depreciate that expense over a 10 year period. Meaning they can only realize $100,000 in expenses each year over that 10 year period, even though they already paid the full $1,000,000 for that new piece of equipment.Under the new tax reform, if Company XYZ buys that same new piece of equipment for $1,000,000, they can deduct the full $1,000,000 expense against their income in 2018. Whoa!!! That's huge!! Yes it is and it's a big incentive for companies to spend money over the next five years.
Housing & Net Exports (Push)
We do not expect any significant change from either of these two categories and they represent the smallest portion of our total GDP.
Watch GDP In 2018
The GDP growth rate in 2018 may give us the first indication as to how many "extra innings" we have left in this already long bull market rally. If we do not see a meaningful acceleration in the annual growth rate of GDP above its 2.2% average rate, the rally could be very short lived. On the flip side, if due to tax reform consumer spending and business spending leaps forward in 2018 and 2019, we may be witnessing the longest economic expansion of all time. Time will tell.
Share Buybacks
You will undoubtedly hear a lot about “Share Buybacks” in 2018. Remember, U.S. corporations will most likely have piles of cash on their balance sheets. Instead of spending that money on hiring new employees, buying new equipment, or building a new plant, what else might they do with the cash? The answer, share buybacks.
If a public company like Nike has extra cash, they can go into the market, purchase their own stock, and then get rid of those outstanding shares. Basically it increases the earnings per share for the remaining shareholders.
Example: Let’s assume there are only 4 shares of Nike owned by 4 different people and Nike is worth $100,000. That means that each shareholder is entitled to 25% of that $100,000 or $25,000 each. Now because of tax reform, Nike has $50,000 of extra cash just sitting in its coffers that it otherwise would have paid to the government in taxes. Nike can go into the market with $50,000, purchase 2 shares back from 2 of the shareholders (assuming they would be willing to sell), and then “retire” those two outstanding shares. After that is done, there are 2 outstanding shares remaining but the value of Nike did not change. So the two remaining shareholders, without paying anything extra, now own 50% of Nike, and their shares are worth $50,000 each.
Share buyback may push stock prices higher from a simple math standpoint. If the formula is the value of the company divided by the number of shares outstanding, the fewer shares there are, assuming the value of the company stays the same, the price per share will go up. The incentive for these share buybacks will most likely be there in 2018. Not only will companies have the cash but share buybacks are a way that public companies can reward their current shareholders..
Is The Stock Market Too Expensive?
The P/E ratio of the S&P 500 Index is another barometer that investors will need to keep a close eye on in 2018. P/E ratios help us to answer the questions: “Is the stock market cheap, fairly valued, or expensive at this point?” The “Forward P/E Ratio” divides the price of a stock by the estimated future 12 months of earnings. The average Forward P/E ratio for the S&P 500 Index between December 1989 – September 30, 2017 was 16.0. As of December 22, 2017, the Forward P/E ratio of the S&P 500 Index is 19.99. In other words, it’s running at 25% above its 25 year historic average. See the chart below:
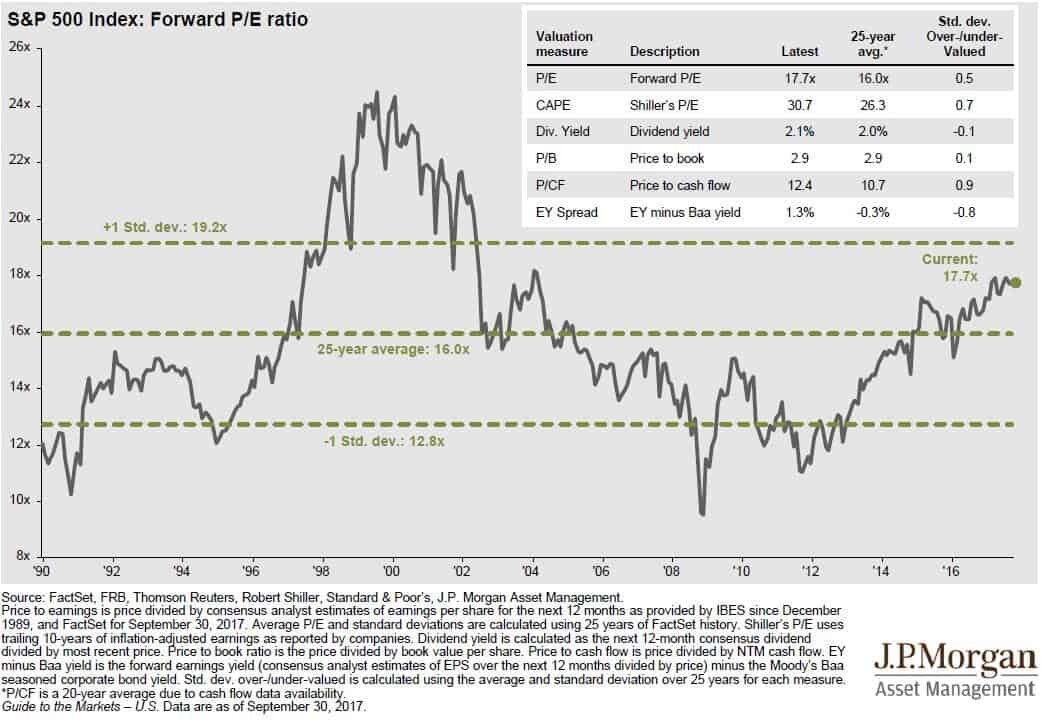
Conclusion, the U.S. stock market is not “cheap” and it’s a stretch to even classify it as “fairly valued”. I think we are well into what I would consider “expensive territory”. What does that mean for investors? You have to stay on your toes!!
Now, we have an anomaly in the mix with tax reform and history does not speak to how this could play out. If tax reform leads to an acceleration in corporate earnings, that in turn could slow the steady climb in the P/E ratio of the S&P 500 because earnings are the denominator in the formula. If stock prices and earnings are accelerating at the same pace, the stock market can go up without a further acceleration of the P/E ratio. Thus, keeping the stock market from becoming more overpriced and further increasing the risk of owning stocks in the S&P 500.
Summary
In 2018, investors should keep a close eye on the U.S. GDP growth rate, the level of spending by corporations and consumers, the volume of share buybacks by U.S. companies, and the P/E ratio of the S&P 500 Index.
About Michael.........
Hi, I’m Michael Ruger. I’m the managing partner of Greenbush Financial Group and the creator of the nationally recognized Money Smart Board blog . I created the blog because there are a lot of events in life that require important financial decisions. The goal is to help our readers avoid big financial missteps, discover financial solutions that they were not aware of, and to optimize their financial future.
Attention Middle Class: The End Is Near
I'm not a fan of conspiracy theories and I'm not a fan of "doom and gloom" articles. However, I feel compelled to write this article because I want people to be aware of a trend that is unfolding right now in our economy. This trend will strengthen over time, we will cheer for it as it's happening, but like many great things in history, it may have an

I'm not a fan of conspiracy theories and I'm not a fan of "doom and gloom" articles. However, I feel compelled to write this article because I want people to be aware of a trend that is unfolding right now in our economy. This trend will strengthen over time, we will cheer for it as it's happening, but like many great things in history, it may have an unintended consequence. I fear that the unintended consequence of this new trend will be the elimination of the U.S. middle class.
More Profits
I’m an investment advisor so I naturally love a strong bull market that results in large investment gains for our clients. The stock market generally goes up when companies are more profitable than the consensus expects. Higher profits equal higher stock prices which equal more wealth for investors. Corporations have become laser-focused on findings new ways to increase profits. This is important because businesses that struggle to make profits and have constant losses are not so successful and will probably end up shutting down in the near future, according to websites like https://www.laraedo.com/signs-that-my-business-is-ripe-for-a-shutdown/. The equation for net profit is easy:
Revenue – Expenses = Net Profit
Let me ask you this question: What is typically a company’s largest expense?
Answer: Payroll. Said another way, the employees. Salaries, benefits, the building to house the employees, training, workers comp, payroll taxes, and the list goes on and on. If you are the owner of a company that makes cell phones and I told you that I have a way that you can make TWICE as many cell phones with HALF the number of employees, what do you think is going to happen to profits? Up!!! In a big way.
The scenario that I just described is not something that might happen in the future, it’s something that is happening right now. Here is the data to support it.
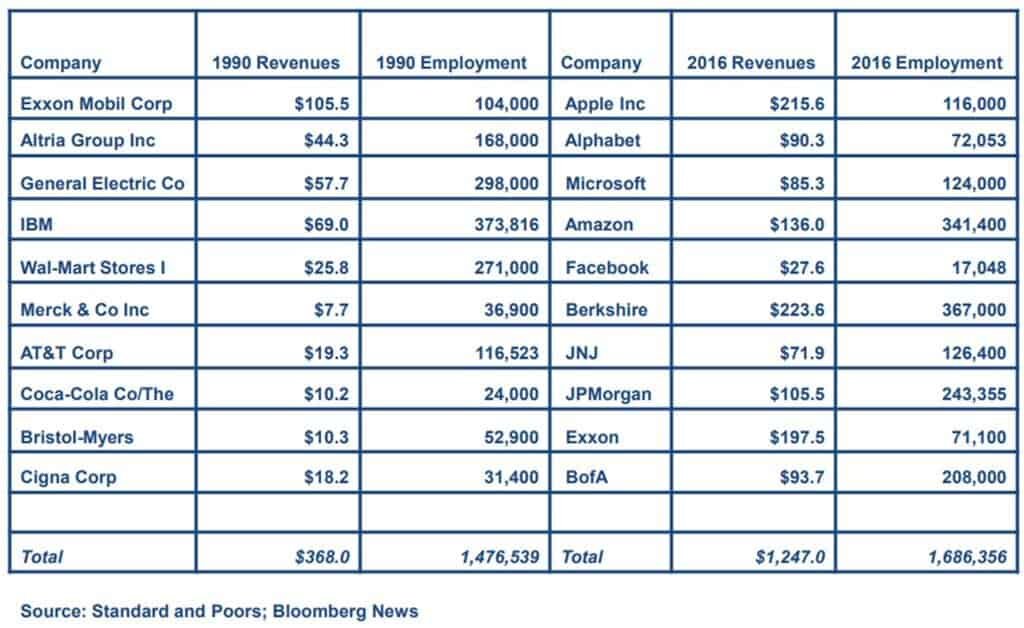
The chart below compares the 10 largest companies in the S&P 500 Index in 1990 to the 10 largest companies in the S&P 500 in 2016. First, you may notice that none of the companies that were the largest in 1990 remained on the list in 2016. But here is the trend that I want to point out. When you look at the 10 largest companies in 1990, they produced $368 Billion dollars of revenue and employed 1.4 Million workers. Fast forward to 2016, the top 10 largest companies produced $1.2 Trillion dollars in revenue and employed about 1.6 Million workers. Now let’s do some quick math, between 1990 and 2016 the gross revenue of the largest 10 companies in the S&P 500 increased by 239% but the number of workers employed by those companies only increased by 14%. Companies are already doing more with less people.
Just when you thought things were going good for the company, I now come to you, the owner of the company, and tell you I have a way to make profits double within the next 3 years. Are you interested? Of course you are. All we have to do is buy these three machines that will replace another 50% of the employees. These machines work 24 hours a day, don’t need health insurance, don’t get sick, and we can move to a smaller building which will reduce rent by 60%. How is that possible? Welcome to the party…..artificial intelligence.
Not A Terminator Movie
What do we think of when we hear the words “artificial intelligence”? Terminators!! Fortunately for us that’s not the artificial intelligence that I’m referring too. But a machine that thinks and learns from its mistakes? The human mind is not as unique as we would like to think it is. Just take a Myers Briggs personality test. You answer 100 questions and then it tells you how you react to things, what annoys you, what your strengths are, how you communicate, and what you have difficulties with. It’s kind of scary as you read the results and realize “Yup. That’s me”
Think about it. Google may know more about you than your spouse. What do you want for Christmas? Your spouse may not know but Google knows all of the items that you looked at over the past 3 months, what items you spent the most time looking at, did you click on the description to read more, and what other items did you look at after you click on the initial item. It tells Google how you search for information. Also Google acknowledges that we all search for things differently and what we are searching for tells Google more about us. Essentially Google learns at little bit more about you every time you search for something via their website.
What about a machine that can respond to questions and it sounds just like a person when it speaks? Oh and it speaks perfect English. No more overseas call centers with people you can’t understand. With most call centers, there are probably 20 questions that represent 80% of all the questions asked. If the machine is unable to answer the question, it automatically routes that call to a living, breathing person. The programmers of the machines are notified when a question triggers a transfer to a live person, they listen to the call, and then update the software to be able to answer the question the next time it is asked. The easy math, this could reduce the number of customer service representatives that the company needs to employ by 80%. Oh and the number of employees will continue to decrease as the machines learn to answer more questions and the software gets more sophisticated.
While a company may go this direction to reduce expenses, we as the consumer will also champion this change. Think about how painful it is to call the cable company. What if I told you that when you call you won’t have to wait on hold, the “person” that you are speaking to will know how to resolve your problem, and you will be off the phone in less than 2 minutes. Time is a valuable commodity to us. Fix my problem and fix it quickly. If a machine can do that better than a real person, be my guest. If companies want it and we as the consumer want it, how fast do you think it’s going to happen?
I Can't Be Replaced By A Machine.....Wrong
While we will cheer how the new A.I. technology saves us time and makes life easier, many of us will have the hubris that “a machine can’t do what I do?”. While a machine may not be able to replace 100% of what you do, could it replace 50%? It’s going to be presented like this, “you know all of those daily tasks that you don’t like to do: paperwork, scanning forms, payroll, and preparing financial reports for the weekly managers meeting. Well you don’t have to do those anymore.” Yes!!!! Oh and more good news you don’t have to train a new employee to complete those tasks and wonder if they are going to leave a year from now and have to train someone else.
Programming a machine to complete a task is not too different from training a new employee. When you hire a new employee many of them may know very little about your industry, they have no idea how your company operates, how to answer tough questions from prospects, etc. You have to train them or “program” them. Then they learn on the job from there. The value of having 20 years of experience is you have seen many difficult situations throughout your career and you learned from your past experiences. The next time the same or similar problem surfaces you know how to react. Normally what you do is you teach those lessons to each new manager and employee over and over again. That takes time. What if you only had to teach that lesson one more time and every new employee already knew how to react in the same tough situation? That’s artificial intelligence.
My point, this trend will not be limited to just manufacturing or customer services. This new technology will eventually impact each of our careers in some way, shape, or form.
3 Stages
I expect this to happen in three stages.
Stage 1: Companies do MORE with only a FEW MORE employees
Stage 2: Companies do MORE with the SAME number of employees
Stage 3: Companies do MORE with LESS employees
We are already through Stage 1 and we are entering Stage 2. How long will it be before we reach stage 3? That’s anyone’s guess. But with most evolution, Stage 1 takes the longest and the following stages evolve more rapidly. If Stage 1 took 16 years, my guess would be that stage 3 will be here a lot sooner than we think.
So What Happens To All Of The Employees?
The million dollar question and I don't know the answer. If I had to guess, the current middle class is going to be divided into two. Half of the middle class is going move up into the "upper class" and the other half will be "unemployed". The level of education will be the dividing line. Companies will continue to do more with less people. The only way to stop it is to tell companies that need to stop trying to be more profitable. Good luck. Our entire economy is built on the premise that you should accumulate as much as you can as fast as you can.
War and Conflict
When I look back in history, major conflicts arise when there is a large deviation between the “Have’s” and the “Have Not’s”. The fancy name that is used today is “income inequality”. When you have a robust middle class, everyone has something to lose if a conflict arises because that conflict generally disrupts the current system, uncertainty prevails, the economy goes into a recession, people lose their job, and they in turn cannot make their mortgage payment.
If instead, a majority of the population is unemployed and they can’t find a job because the jobs don’t exist anymore, that group of individuals has nothing to lose by burning the current system to the ground and rebuilding a new one from the ashes. I know that sounds dark but there is no arguing the gap between the Have’s and the Have Not’s is getting larger. Just look at the labor participation rate:
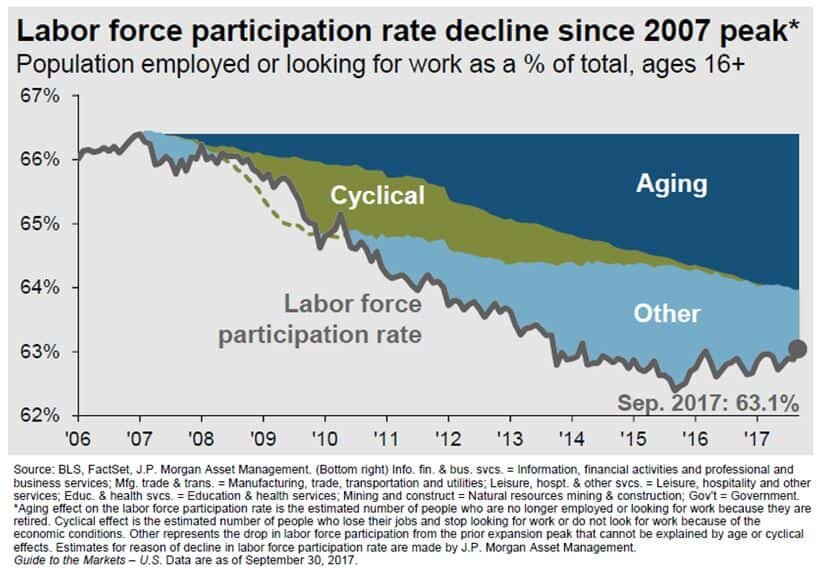
The Labor Participation Rate answers the question, how many people in the U.S. that could be working either are working or are looking for work? If there are individuals who could work, don’t have a job, and stop looking for work, they drop out of the labor force which decrease the labor participation rate because there are less citizens participating on the work force. As you can see in the chart above, in 2006 the labor participation rate was around 66%, and while we continue to experience one of the longest economic expansions of all time, the labor participation rate is still lower now than it was prior to the beginning of the economic recovery. Remember we are in an expansion and it has dropped by about 3%. What do you think will happen when we hit the next recession? While the baby boomer generation has had an impact on these numbers as you can see based on the large percentage of that decrease attributed to an “aging population”. Traditionally when someone retires, the company will promote the person below them and then hire another person to fill there spot. As many of us know, that’s not how it works anymore. Now that key employee retires, the company promotes one person into their role, but instead of hiring a new employee they just redistribute the work to the current staff. If anything, the baby boomer generation moving into retirement has made this transition to “do more with less people” easier on companies because they don’t have to fire anyone.
Tax Reform Will Accelerate The Trend
If you combine tax reform with the current 4.1% employment rate, I would expect this to accelerate the development of artificial intelligence. Companies are going to have cash from the tax savings to reinvest into new technologies which includes artificial intelligence. If the economy continues to grow at its current 2% pace or accelerates, one would expect consumption to increase which increases the demand for products and services. With the unemployment rate at 4.1%, we are already at "full employment". There are not enough qualified workers for companies to hire to meet the increase in demand for their product or service. The answer, let's accelerate the development of artificial intelligence that will allow the company to enter Phase 2 which is "Do MORE with the SAME number of workers".
People Will Cheer
These advances in technology are potentially setting the stage for levels of profitability that companies have only dreamed of. Higher profits traditionally equal higher stock prices. Investors will cheer this!! It may even lead us to the longest economic expansion of all time. In the short term, investors may have a lot to be excited about but we may look back years from now and realize that we were unintentionally cheering for the end of the middle class as we know it.
Again, this article is not meant to be a “dark cloud” or a new conspiracy theory but rather to keep our readers aware of the world that is changing rapidly around us. Like many of the economic challenges that the U.S. economy has experienced in the past, the hazard was in plain view, but investors failed to see it because they got caught up in the moment. When investing, it’s ok to take advantage of short term gains but never lose sight of the big picture.
About Michael.........
Hi, I’m Michael Ruger. I’m the managing partner of Greenbush Financial Group and the creator of the nationally recognized Money Smart Board blog . I created the blog because there are a lot of events in life that require important financial decisions. The goal is to help our readers avoid big financial missteps, discover financial solutions that they were not aware of, and to optimize their financial future.
Watch These Two Market Indicators
While a roaring economy typically rewards equity investors, the GDP growth rate in the U.S. has continued to grow at that same 2.2% pace that we have seen since the recovery began in March 2009. When you compare that to the GDP growth rates of past economic expansions, some may classify the current growth rate as “sub par”. As in the tale of the
While a roaring economy typically rewards equity investors, the GDP growth rate in the U.S. has continued to grow at that same 2.2% pace that we have seen since the recovery began in March 2009. When you compare that to the GDP growth rates of past economic expansions, some may classify the current growth rate as “sub par”. As in the tale of the tortoise and the hare, sometimes slow and steady wins the race.
The number one questions on investor’s minds: “It’s been a great rally but are we close to the end?” Referencing the chart below, if you look at the length of the current economic expansion, going back to 1900 we are now witnessing the 3rd longest economic expansion on record which is making investors nervous because as we all know that markets work in cycles.
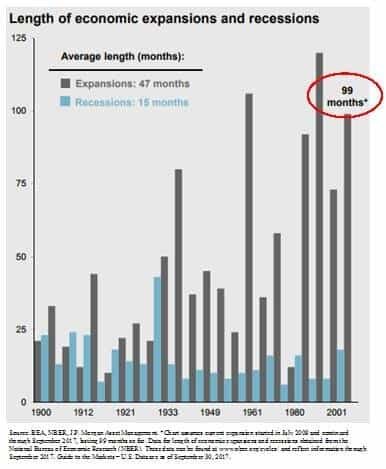
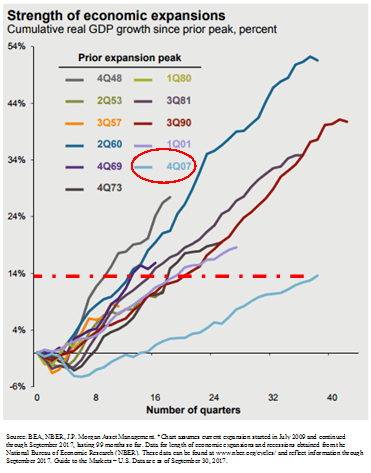
However, if you ignore the “length” of the rally for a moment and look at the “magnitude” of the rally it would seem that total GDP growth of the current economic expansion has been relatively tame compared to some of the economic recoveries in the past. See the chart below. The chart shows evidence that there have been economic rallies in the past that were shorter in duration but greater in magnitude. This may indicate that we still have further to go in the current economic expansion.
What causes big rallies to end?
Looking back at strong economic rallies in the past, the rallies did not die of old age but rather there was an event that triggered the next recession. So we have to be able identify trends within the economic data that would suggest that the economic expansion has ended and it will lead to the next recession.
Watch these two indicators
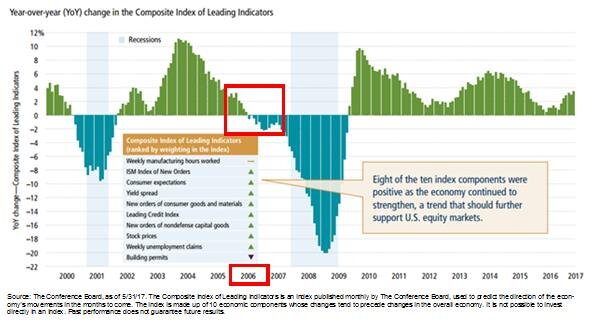
Two of the main indicators that we monitor to determine where we are in the current economic cycle are the Leading Indicators Index and the Yield Curve. History rarely repeats itself but it does rhyme. Look at the chart of the leading indicators index below. The leading indicators index is comprised of multiple economic indicators that are considered “forward looking”, like housing permits. If there are a lot of housing permits being issues, then demand for housing must be strong, and a strong housing market could lead to further economic growth. Look specifically at 2006. The leading indicators went negative in 2006, over a year before the stock market peaked in 2007. This indicator was telling us there was a problem before a majority of investors realized that we were on the doorstep of the recession.
Let’s look at the second key indicator, the yield curve. You will hear a lot about the “slope of the yield curve” in the media. In a healthy economy, long term interest rates are typically higher than short term rates which results in a “positively slopped” yield curve. In other words, when you go to the bank and you have the choice of buying a 2 year CD or a 10 year CD, you would expect to receive a higher interest rate on the 10 year CD because they are locking up your money for 10 years instead of 2.
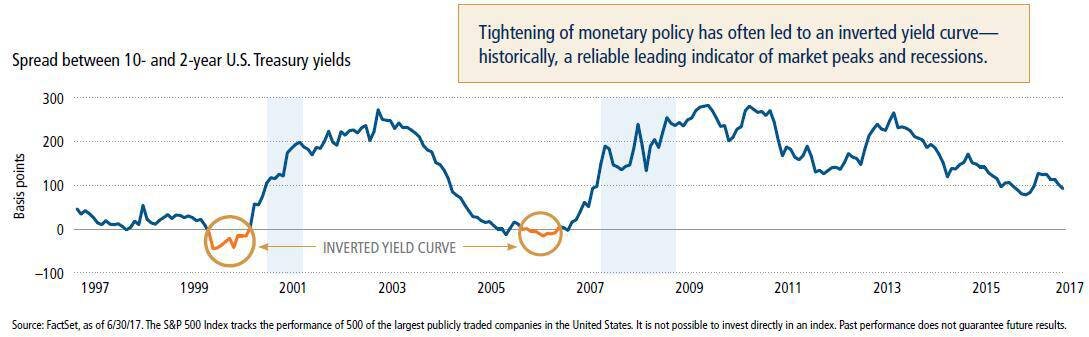
There are periods of time where the interest rate on a 10 year government bond will drop below the interest rate on a 2 year government bond which is considered an “inverted yield curve”. Why does this happen and why would investors by that 10 year bond that is yielding less than the 2 year bond? This happens because bond investors are predicting an economic slowdown in the foreseeable future. They want to lock in the current 10 year interest rate knowing that if the economy goes into a recession that the Fed may begin to lower the Fed Funds Rate which has a more rapid impact on short term rates. It’s a bet that the 2 year bond rate will drop below the 10 year bond rate within the next few years.
If you look at the historical chart of the yield curve above, the yield curve inverted prior to the recession in the early 2000’s and prior to the 2008 recession.
Looking at where we sit today, within the last 6 months the leading indicators index has not only been positive but it’s accelerating and the yield curve is still positively sloped. While we realize that there is not a single indicator that accurately predicts the end of a market cycle, these particular economic indicators have historically been helpful in predicting danger ahead.
There will always be uncertainty in the world. Currently it has taken the form of U.S, politics, tax reforms, geopolitical events, and global monetary policy but it would seem that based on the hard economic data here in the U.S. that our economic expansion that began in March 2009 may still have further to go.
About Michael.........
Hi, I’m Michael Ruger. I’m the managing partner of Greenbush Financial Group and the creator of the nationally recognized Money Smart Board blog . I created the blog because there are a lot of events in life that require important financial decisions. The goal is to help our readers avoid big financial missteps, discover financial solutions that they were not aware of, and to optimize their financial future.
The #1 Question To Ask Yourself Before Selling A Stock
When is the right time to sell an investment? It's a tough decision that individuals have a difficult time making but it's one of the most important decisions that you will have to make as an investor. Often time the decision to "buy" an investment is much easier. You gather information on a given investment, look at the trends in the market acting on

When is the right time to sell an investment? It's a tough decision that individuals have a difficult time making but it's one of the most important decisions that you will have to make as an investor. Often time the decision to "buy" an investment is much easier. You gather information on a given investment, look at the trends in the market acting on that investment, assess the risk versus reward trade off, and you put your strategy to work. Deciding to sell has a lot more emotions involved which frequently causes investors to make the wrong decision.
When do I sell a big winner?
First scenario is "the rocket ship". You purchased a stock and the stock price has gone through the roof. It's made you a ton of money on paper, you proudly boast to your friends and co-workers about the price that you bought it at, and in certain instances it has been a life changing financial event. The mistake investors make here is they get into what we call "the teddy bear syndrome".
Teddy bear syndrome.....
Have you ever tried to take a teddy bear away from a five year old......good luck. As adults, we often fall into the same behavioral pattern with very successful investments. Individuals typically have a strong emotional attachment to their most successful investments. But you will frequently hear many legendary investment managers make comments like: "Investment decisions are not emotional decisions. You have to remove your emotions from the decision-making process." Let's say you bought $10,000 of XYZ stock at $10 per share and five years later it's now selling at $890 per share turning your $10,000 into $890,000. Do you sell some of it, maybe all of it?
Here is the key question........
"If you had that $890,000 in cash in your hand today, would you invest all of it back into XYZ stock at $890 per share?"
Most people would say "No!! That's crazy. I would diversify that $890,000 across a number of holdings and the stock has already gone up so much". Continuing to hold a stock is the same decision as buying a stock. But doing nothing is easier because we feel like we are not making a decision, we are just "continuing to hold". Remember, it's easy to sell a stock that has lost money. It's much more difficult to sell a stock that produced a gain. Of course, this brings up the question of how do you find the right stocks to invest in?
"If I sell the stock, I'll have to pay tax on the gain."
Question: Would you rather pay taxes on a gain or lose money? Usually if you are paying taxes it means that you are making money. If I sold the stock holding in the example above, I would have an $880,000 long term capital gain at a minimum would pay around $132,000 in long term capital gains tax at 15%. This would leave me with $758,000 cash in hand from a $748,000 gain plus $10,000 original investment. What if instead of selling I continue to hold the stock and to no fault of company XYZ the economy goes into a recession? The stock goes from $890 a share to $500 a share. Now my total investment is worth $500,000 instead of $890,000. It's still a good investment because I bought it at $10,000 and it's still worth $500,000 but if I sold it at $500 per share I would still pay tax on the gain, now a smaller amount of gain, and be left with around $425,000. That poor decision cost me $333,000 after tax.
The fallen star
Most investors have been here at one point or another. You purchased a stock that rose in value dramatically but for whatever reason the stock lost all of its early investment gains and your investment is now underwater. Many investors will say “It’s a good long term holding so I’m just going to wait for it to come back.” While we are all familiar with the buy and hold strategy, there is a risk and opportunity cost with this strategy. The risk being that it may never come back to its original value. The opportunity cost is the money invested in that underperforming company could be growing somewhere else instead of just “waiting for it to come back”.
You must ask yourself the same key question that was listed above: “If I had that money in my hand today, would I invest all of it in that stock?” If the answer is “no”, you should probably sell some or all of it. Do not hold a stock solely based on a target share price. I will hear people say, “Well I bought it at $55 per share so I’m going to wait until it at least gets back to that price.” That is not an investment strategy. You must look at the fundamentals of the company, their competitors, global market conditions, company management, the company’s strategy, and their financials to really come up with a price target for the stock.
The inherited gem
It's a common occurrence that individuals will inherit stock from a family member and they know that family member had a strong emotional attachment to the stock because they either work for the company or they never sold a single share during their lifetime. It's easy to feel that selling the stock is in some way selling the memory of that family member. I will often hear comments like: "My dad worked for the company and held that stock for 40 years. He would be rolling in his grave right now if he knew I was thinking about selling his stock." This frequently happens because the generation before us had pension plans to support them in retirement and did not have to sell stock to supplement their income or they came from a generation that was very frugal about spending money. Your needs and circumstances are probably very different from the person that you inherited the stock from so you need to look at that investment holding from your financial standpoint.
I work for the company........
If you work for a publicly traded company then there is a good chance that you own shares of that company in an employee stock purchase plan, retirement plan, options plan, or brokerage account. Since you work for the company it usually means that you have "drank the kool-aide" and believe in the company's mission, vision, and you feel like you have more control over the fate of your investment. Remember, even though you work for that company it's still one company and attaching too much for your net worth to one investment is very risky. It's even more risky for employees because if something negatively impacts the company not only is your employment at risk but so is your total net worth if a large portion of your investment portfolio is tied to the company that you work for. Make sure you periodically calculate a total of all your investment holdings and compare that to the amount invested in your company's stocks to make sure you stay balanced in your overall investment approach.
Ask yourself the easy question.......
While making the decision to buy, sell, or hold an investment is not always an easy one. Finding the right answer may be as easy as asking yourself: "If the amount invested in that stock was in cash and in my hand today, would I invest 100% of it back into that stock holding?"
About Michael.........
Hi, I’m Michael Ruger. I’m the managing partner of Greenbush Financial Group and the creator of the nationally recognized Money Smart Board blog . I created the blog because there are a lot of events in life that require important financial decisions. The goal is to help our readers avoid big financial missteps, discover financial solutions that they were not aware of, and to optimize their financial future.

Tax Deductions For College Savings
Did you know that if you are resident of New York State there are tax deductions waiting for you in the form of a college savings account? As a resident of NYS you are allowed to take a NYS tax deduction for contributions to a NYS 529 Plan up to $5,000 for a single filer or $10,000 for married filing joint. These limits are hard dollar thresholds so it

Did you know that if you are resident of New York State there are tax deductions waiting for you in the form of a college savings account? As a resident of NYS you are allowed to take a NYS tax deduction for contributions to a NYS 529 Plan up to $5,000 for a single filer or $10,000 for married filing joint. These limits are hard dollar thresholds so it does not matter how many kids or grandchildren you have.
529 Accounts
529 accounts are one of the most tax efficient ways to save for college. You receive a state income tax deduction for contributions and all of the earnings are withdrawn tax free if used for a qualified education expense. These accounts can only be used for a college degree but they can be used toward an associate’s degree, bachelor’s degree, masters, or doctorate. You can name whoever you want as a beneficiary including yourself. More commonly, we see parents set these accounts up for their children or grandparents for the grandchildren.
Can they go to college in any state?
If you setup a NYS 529 account, the beneficiary can go to college anywhere in the United States. It’s not limited to just colleges in New York. As the owner of the account you can change the beneficiary on the account whenever you choose or close the account at your discretion.
What if they don't go to college?
The question we usually get is “what if they don’t go to college?” If you have a 529 account for a beneficiary that does not end up going to college you have a few choices. You can change the beneficiary listed on the account to another child or even yourself. You can also decide to just liquidate the account and receive a check. If the account is closed and the balance is not used for a qualified college expense then you as the owner receive your contributions back tax and penalty free. However, you will pay ordinary income tax and a 10% penalty on just the earnings portion of the account.
What if my child receives a scholarship?
There is a special withdrawal exception for scholarship awards. They do not want to penalize you because the beneficiary did well in high school or is a star athlete so they allow you to make a withdrawal from the 529 account equal to the amount of the scholarship. You receive your contributions tax free, you pay ordinary income tax on the earnings, but you avoid the 10% penalty for not using the account toward a qualified college expense.
Don't make this mistake.............
We often see individuals making the mistake of setting up a 529 account in another state because “their advisor told them to do so”. You are completely missing out on a good size NYS tax deduction because you only get credit for NYS 529 contributions. A little-known fact is that you can rollover a 529 with another state into a NYS 529 account and that rollover amount will count toward your $5,000 / $10,000 deduction limit for the year. If a client has $30,000 in a 529 account outside of NYS we typically advise them to roll it over in $10,000 pieces over a three year period to maximize the $10,000 per year NYS tax deduction.
About Michael……...
Hi, I’m Michael Ruger. I’m the managing partner of Greenbush Financial Group and the creator of the nationally recognized Money Smart Board blog . I created the blog because there are a lot of events in life that require important financial decisions. The goal is to help our readers avoid big financial missteps, discover financial solutions that they were not aware of, and to optimize their financial future.


Should I Gift A Stock To My Kids Or Just Let Them Inherit It?
Many of our clients own individual stocks that they either bought a long time ago or inherited from a family member. If they do not need to liquidate the stock in retirement to supplement their income, the question comes up “should I just gift the stock to my kids while I’m still alive or should I just let them inherit it after I pass away?” The right answer is

Many of our clients own individual stocks that they either bought a long time ago or inherited from a family member. If they do not need to liquidate the stock in retirement to supplement their income, the question comes up “should I just gift the stock to my kids while I’m still alive or should I just let them inherit it after I pass away?” The right answer is largely influenced by the amount of appreciation or depreciation in the stock.
Gifting Stock
When you make a non-cash gift such as a stock, house, or even a business, the person receiving the gift assumes your cost basis in the assets. They do not receive a “step-up” in basis at the time the gift is made. Example, I buy XYZ Corp stock in 1995 for $10,000. In 2017, those shares of XYZ are now worth $100,000. If I gift them to my kids, no one owes tax on the gift at the time that the gift is made but my kids carry over my cost basis in the stock. If my kids hold the stock for 10 more years and sell it for $150,000, their basis in the stock is $10,000, and they owe capital gains tax on the $140,000 gain. Thus, creating an adverse tax consequence for my kids.
Inheriting Stock
Instead, let’s say I continue to hold XYZ stock and when I pass away my kids inherited the stock. If I pass away in 10 years and the stock is worth $150,000 then my kids receive a “step-up” in basis which means that their cost basis in the stock is the value of the stock as of the date of my death. They inherit the stock at $150,000 value, sell it the next day, and they owe $0 in taxes due to the step-up in basis upon my death.
In general, if you have assets that have low cost basis it is usually better for your heirs to inherit the assets as opposed to gifting it to them.
The concept is often times reversed for assets that have depreciated in value…..with an important twist. If I purchase XYZ Corp stock in 1995 for $10,000 but in 2017 it’s only worth $5,000, if I sold the stock myself I would capture the realized investment loss and could use it to offset investment gains or reduce my income by $3,000 for the IRS realized loss allowance.
Here is a very important rule......
In most cases, do not gift a depreciated asset to someone else. Why? When you gift an asset that has depreciated in value the carry over basis rules change. For an asset that has depreciated in value, the carry over basis for the person receiving the gift is the higher of the fair market value of the asset or the cost basis of the person making the gift. In other words, the loss evaporates when I gift the asset to someone else and no one gets the tax advantage of using the realized loss for tax purposes. It would be better if I sold the stock, captured the investment loss, and then gifted the cash.
If they inherit the stock that has lost value there is no value to the step-up in basis because the stock has not appreciated in value.
About Michael……...
Hi, I’m Michael Ruger. I’m the managing partner of Greenbush Financial Group and the creator of the nationally recognized Money Smart Board blog . I created the blog because there are a lot of events in life that require important financial decisions. The goal is to help our readers avoid big financial missteps, discover financial solutions that they were not aware of, and to optimize their financial future.


A New Year: Should I Make Changes To My Retirement Account?
A simple and easy answer to this question would be…..Maybe? Not only would that answer make this article extremely short, it wouldn’t explain some important items that participants should take into consideration when making decisions about their retirement plan.Every time the calendar adds a year we get a sense of reset. A lot of the same tasks on the

A simple and easy answer to this question would be…..Maybe? Not only would that answer make this article extremely short, it wouldn’t explain some important items that participants should take into consideration when making decisions about their retirement plan.Every time the calendar adds a year we get a sense of reset. A lot of the same tasks on the to do list get added each January and hopefully this article helps you focus on matters to consider regarding your retirement plan.
Should I Consult With The Advisor On My Plan?
At our firm we make an effort to meet with participants at least annually. Saving in company retirement plans is about longevity so many times the individual meetings are brief and no allocation changes are made. Even if this is the result, an overview of your account, at least annually, is a good way to keep retirement savings fresh in your mind and add a sense of comfort that you’re investing appropriately based on your time horizon and risk tolerance.
These individual meetings are also a good time to discuss other financial questions you may have. Your retirement plan is only a piece of your financial plan and we encourage participants to use the resources available to them. Often times these meetings start off as a simple account overview but turn into lengthy conversations about various financial decisions the participant has been weighing.
How Much Should I Be Contributing This Year?
This answer is not the same for everyone because, among other things, people have different retirement goals, financial situations, and time horizon. That being said, if the company has a match component in their plan, the first milestone would be to contribute enough to receive the most the company is willing to give you. For example, if the company will match 100% of your contributions up to 3% of pay, any amount you contribute less than 3% will leave you missing out on retirement savings the company is willing to provide you.
Again, the amount that should be saved is dependent on the individual but saving anywhere from 10% to 15% of your compensation is a good benchmark. In the previous example, if the company will match 3%, that means you would have to contribute 7% to achieve the lower end of that benchmark. This may seem like a difficult task so starting at an amount you are comfortable with and working your way to your ultimate goal is important.
Should You Be Making Allocation Changes?
The initial allocation you choose for your retirement account is important. Selecting the appropriate portfolio from the start based on your risk tolerance and time until retirement can satisfy your investment needs for a number of years. The chart below shows that over longer periods of time historical annual returns tend to be less volatile.
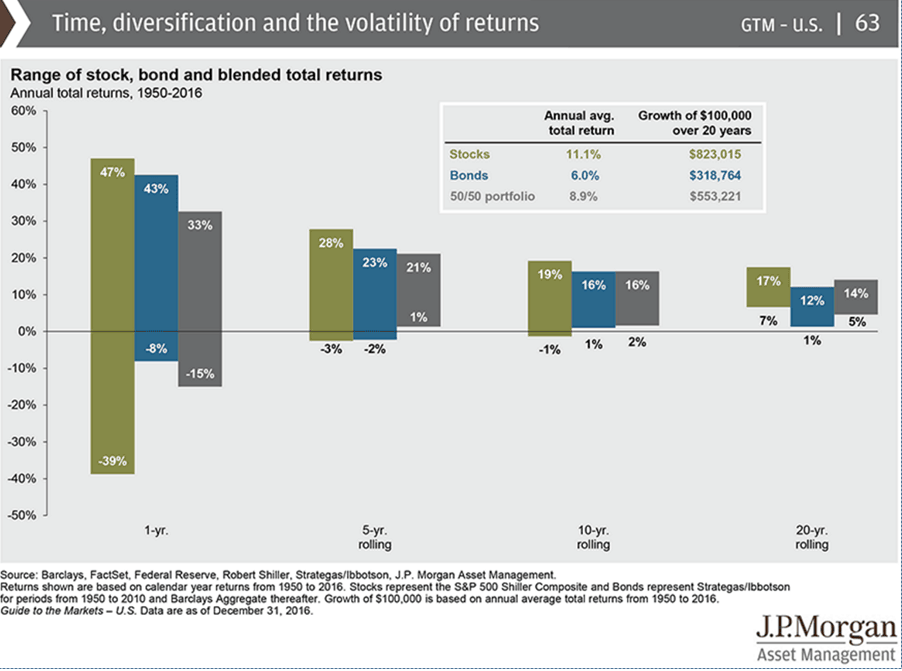
When you have over 10 years until retirement, reviewing the account at least annually is important as there are a number of reasons you would want to change your allocation. Lifestyle changes, different retirement goals, or specific investment performance to name a few. Participants tend to lose out on investment return when they try to time the market and are forced to sell low and buy high. This chart shows that even though there may be volatility in the short term, as long as you have time and an appropriate allocation from the start, you should see returns that will help you achieve your retirement goals.
About Rob……...
Hi, I’m Rob Mangold. I’m the Chief Operating Officer at Greenbush Financial Group and a contributor to the Money Smart Board blog. We created the blog to provide strategies that will help our readers personally , professionally, and financially. Our blog is meant to be a resource. If there are questions that you need answered, pleas feel free to join in on the discussion or contact me directly.
