By Michael Ruger, CFP®
Partner and Chief Investment Officer at Greenbush Financial Group
What history tells us about a Democratic-controlled Congress, a Republican president, and the outlook for the S&P 500 over the next two years.
The results of the November 3, 2026, midterm elections are in, and Democrats have won control of both the House of Representatives and the Senate, while Republican President Donald Trump remains in the White House. This creates a political environment commonly referred to as divided government.
With one political party controlling Congress and the other controlling the presidency, investors may be wondering what this means for the stock market over the next two years. Will political disagreements in Washington create more market volatility? Could legislative gridlock prevent important economic policies from moving forward? Or could having both parties involved in the decision-making process actually be a positive for investors?
The good news is that while this particular political arrangement may seem unusual, it has happened several times before. More importantly, history suggests that the stock market can perform reasonably well under this type of divided government.
In this article, we'll look at:
How the S&P 500 has historically performed when Democrats controlled both chambers of Congress and a Republican occupied the White House.
Why the 2007–2008 financial crisis has an outsized impact on the historical performance data.
Why political gridlock isn't necessarily bad news for the stock market.
What other economic factors could influence investment returns in 2027 and 2028.
The goal isn't to predict whether one political party will be better or worse for the stock market. It's to take the politics out of the conversation, look at the historical numbers, and understand what those numbers may tell us about the next two years.
Has a Democratic Congress and Republican President Happened Before?
Yes. In fact, since 1955, there have been 22 calendar years in which Democrats controlled both the House and Senate while a Republican served as president. This arrangement occurred under Presidents Dwight Eisenhower, Richard Nixon, Gerald Ford, Ronald Reagan, George H. W. Bush, and George W. Bush.
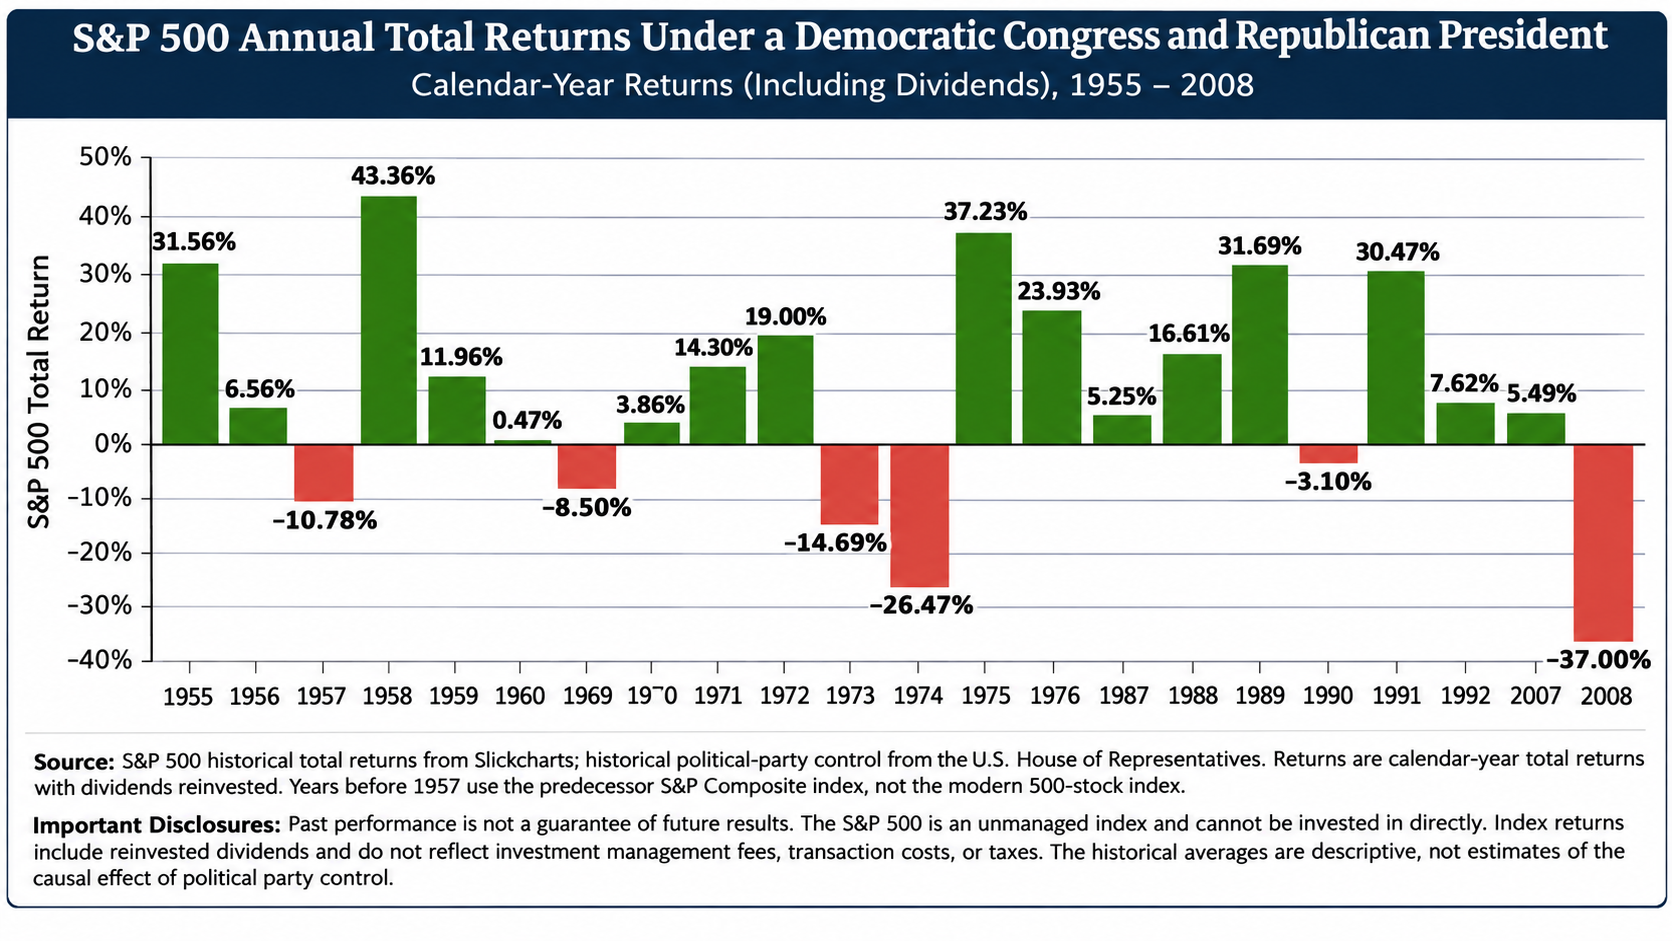
That gives us a meaningful amount of historical data to evaluate how stocks performed under the same political configuration we'll have beginning in January 2027. The chart below shows the S&P 500's annual total return, including reinvested dividends, during each of those years.
Source: S&P 500 historical total returns from Slickcharts; historical political-party control from the U.S. House of Representatives. Returns are calendar-year total returns with dividends reinvested. Years before 1957 use the predecessor S&P Composite index, not the modern 500-stock index.
Historical S&P 500 Returns With a Democratic House, Democratic Senate, and Republican President
S&P 500 Annual Total Returns Under a Democratic Congress and Republican President
Calendar-year returns, including dividends, 1955–2008
Source: S&P 500 Website
When we look at the numbers, a few interesting patterns emerge.
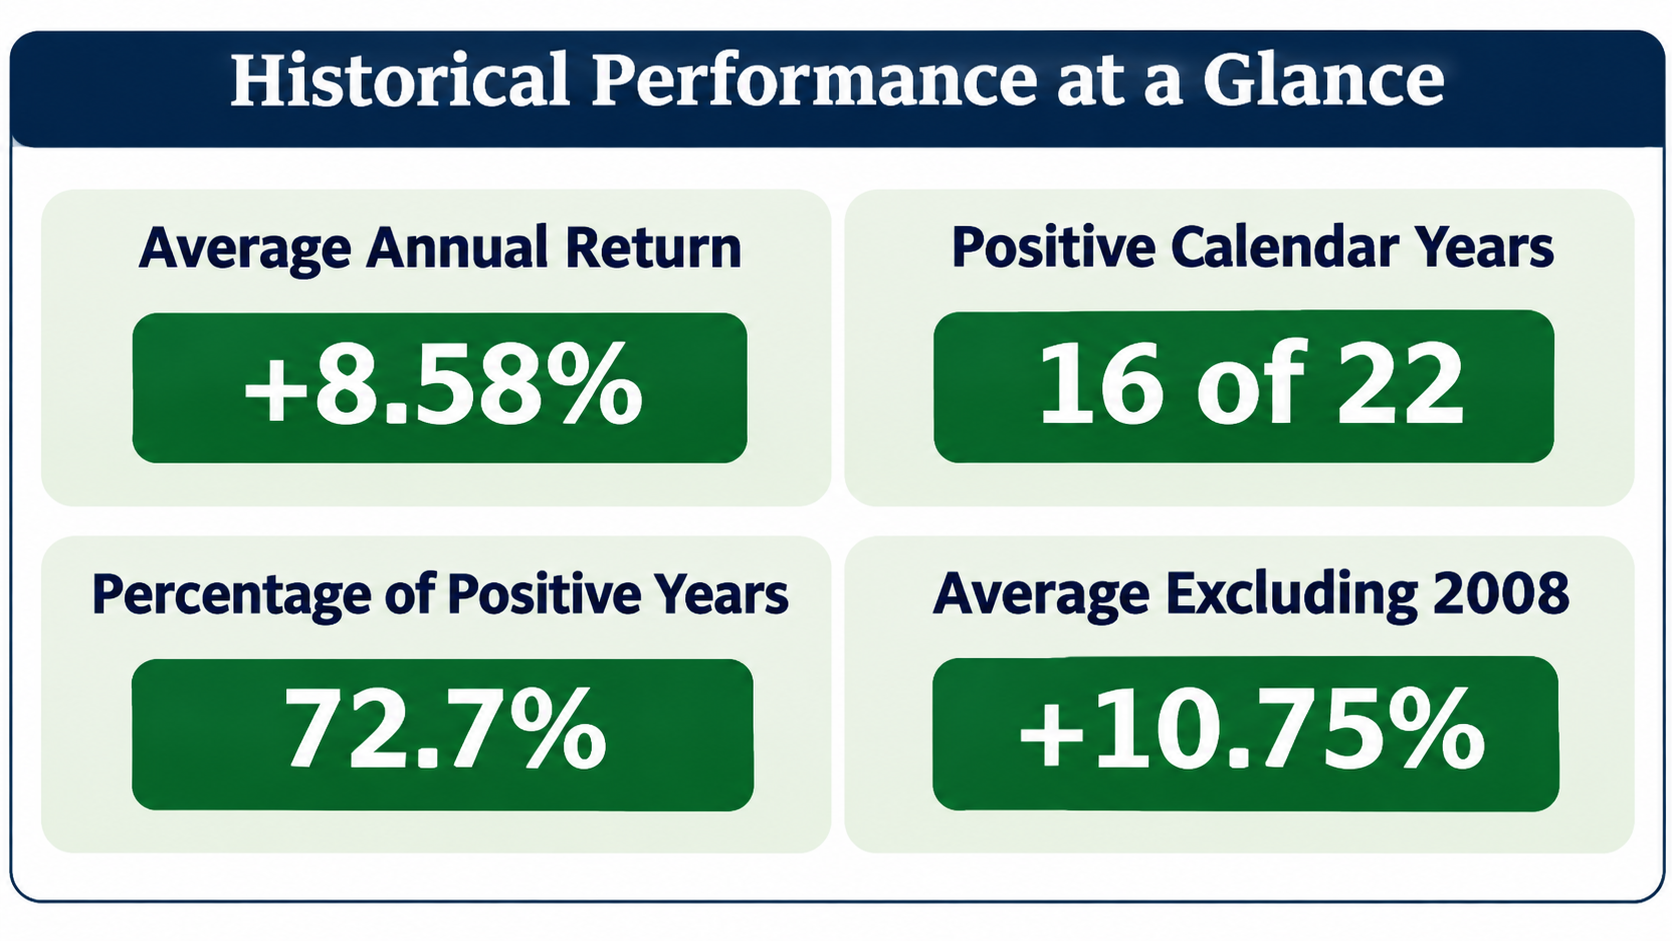
First, the S&P 500 generated positive returns in 16 of the 22 calendar years when Democrats controlled both chambers of Congress and a Republican was president. That's approximately 73% of the time.
Second, the average annual total return during these periods was approximately 8.6%. While that's not a guarantee of what stocks will do going forward, it certainly doesn't suggest that this particular political arrangement is inherently bad for the stock market.
Third, there were some remarkably strong years under this political configuration. In 1958, the S&P 500 returned 43.36%. In 1975, it returned 37.23%. And in 1989, during President George H. W. Bush's first year in office, the index gained 31.69%.
Of course, there were also negative years, including some significant declines. And one of those years deserves a closer look.
Why the 2008 Financial Crisis Skews the Historical Average
One of the most important considerations when analyzing this historical data is what happened during the presidency of George W. Bush.
In 2007 and 2008, Democrats controlled both the House and Senate while President Bush, a Republican, occupied the White House. During those two calendar years, the S&P 500 generated the following returns:
2007: +5.49%
2008: -37.00%
Taken together, those two years had a significant negative impact on the historical average.
But it's important to remember what else was happening during that period.
The United States was experiencing the collapse of the housing bubble, a subprime mortgage crisis, widespread financial institution failures, and what eventually became known as the Great Recession. The financial crisis was driven by problems that had been developing in the housing and banking systems for years, not simply by which political party controlled Congress or the presidency. That distinction matters because when we're attempting to understand how politics influence stock market returns, we have to be careful not to attribute every market movement to Washington.
How 2008 Changes the Historical Average
DISCLOSURE: Calculations based on historical S&P 500 calendar-year total returns. The averages are arithmetic averages, not compound annual growth rates. Excluding a period provides context, but it does not make the remaining sample a more reliable prediction
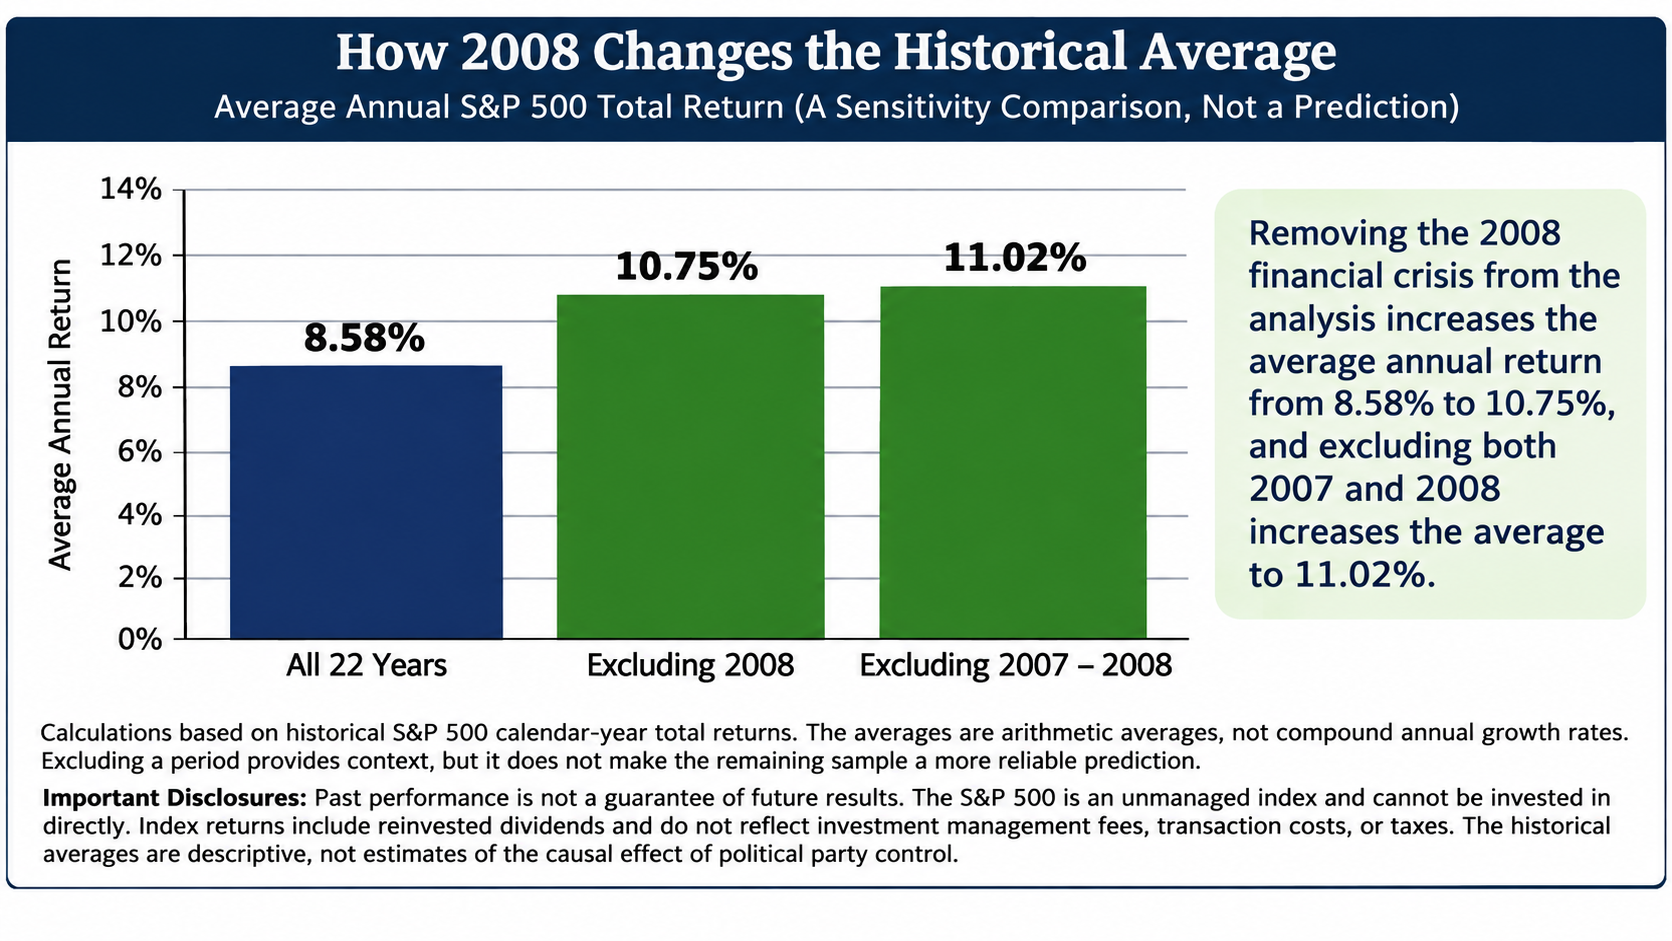
If we remove just 2008 from the calculation, the average annual S&P 500 return during these periods increases from approximately 8.6% to 10.8%.
If we exclude both 2007 and 2008, the average increases to approximately 11.0%.
This doesn't mean we should pretend that 2008 never happened. Investors have to account for the possibility of major economic shocks, regardless of which party is in power. The point is that the negative return in 2008 was influenced heavily by a financial crisis that extended well beyond the political makeup of Washington.
It's also worth noting that 2008 wasn't the only period influenced by extraordinary circumstances. The stock market declines in 1973 and 1974 occurred during a period of high inflation, an oil crisis, recession, and substantial political uncertainty.
These examples help illustrate an important lesson: The stock market responds to much more than election results.
Why Political Gridlock Can Actually Be Good for the Stock Market
When investors hear the term political gridlock, they tend to associate it with something negative. The assumption is that if Congress and the president can't agree on legislation, very little gets accomplished in Washington.
But from the stock market's perspective, that isn't necessarily a bad thing.
One characteristic of financial markets is that investors value predictability. Businesses make investment decisions, hire employees, establish budgets, and develop long-term strategies based partly on what they expect the economic environment to look like in the future.
When major changes to tax laws, regulations, or government spending programs are introduced, businesses and investors have to evaluate how those changes could affect future profitability.
With divided government, major legislative changes can become more difficult to pass because they generally require some level of cooperation between the two political parties.
For example, suppose a company is considering building a new $100 million manufacturing facility. Before making that investment, management needs to consider future tax rates, regulatory requirements, and the overall business environment. If those rules are changing frequently, it can create additional uncertainty. If the company expects the rules to remain relatively stable for the next two years, management may have more confidence in its long-term planning assumptions.
That's one reason political gridlock can sometimes create a favorable environment for financial markets. It can reduce the likelihood of unexpected legislative changes and provide businesses with greater visibility into the future.
That doesn't mean divided government eliminates uncertainty. Presidents still have executive authority, Congress still controls important spending decisions, and disagreements over budgets or the federal debt ceiling can introduce their own market risks. Major bipartisan legislation can also pass under divided government.
However, from an investment standpoint, a period of relative legislative stability can be preferable to an environment where major policies are constantly changing.
Expect Plenty of Political Headlines Over the Next Two Years
With Democrats controlling both chambers of Congress and a Republican in the White House, investors should expect no shortage of political headlines during 2027 and 2028. There will likely be disagreements over government spending, tax policy, immigration, healthcare, foreign policy, and other important issues. Congress may advance legislation that the president opposes, and the president may propose policies that face resistance in Congress.
There could also be heightened attention surrounding congressional investigations, legislative stalemates, and negotiations over federal government funding. If history is any indication, the political news cycle could make it feel as though Washington is constantly in a state of conflict. But it's important for investors to distinguish between political headlines and events that materially change the outlook for corporate earnings or the economy.
For example, a disagreement between Congress and the president over a proposed piece of legislation may dominate news coverage for several days. But if the legislation has little chance of becoming law, the actual long-term financial impact on publicly traded companies could be limited. The stock market may react to uncertainty in the short term, but over longer periods, factors such as corporate earnings, economic growth, interest rates, and inflation tend to be much more important drivers of performance.
In other words, a significant amount of political activity doesn't necessarily translate into a significant impact on your investments.
Other Factors Could Have a Much Bigger Impact on Markets in 2027 and 2028
While historical stock market returns under divided government provide useful context, we also have to recognize that the economic environment in 2026 is different from the environments we've experienced during previous midterm election cycles.
Several major developments could have a much greater influence on stock market performance over the next two years than which political party controls Congress.
1. The Iran Conflict and Oil Prices Near $100 Per Barrel
The ongoing conflict involving Iran has created significant uncertainty in global energy markets. As of November 3, 2026, Brent crude oil was trading at approximately $104 per barrel. (Reuters)
Higher oil prices can have broad implications for the U.S. economy. They increase transportation and manufacturing costs, can put upward pressure on inflation, and leave consumers with less disposable income to spend elsewhere. If energy prices remain elevated for an extended period, they could weigh on corporate profit margins and influence decisions made by the Federal Reserve.
On the other hand, a resolution to the conflict and a meaningful decline in oil prices could provide relief to both businesses and consumers. These developments could influence the S&P 500 regardless of whether Democrats or Republicans control Congress.
2. The Artificial Intelligence Investment Boom
Another major factor is the enormous amount of investment taking place in artificial intelligence.
Companies are spending substantial amounts of money on data centers, advanced computer chips, infrastructure, software, and other technologies designed to support the growth of AI. This investment has the potential to create new business opportunities, improve productivity, and drive future corporate earnings growth. At the same time, investors have to consider whether the companies making these investments will generate enough additional profits to justify the spending and the valuations being assigned to AI-related stocks.
If the AI boom continues to translate into higher earnings and productivity, it could support stock market performance over the next two years. If expectations get ahead of actual financial results, however, investors could experience periods of volatility. Neither of those outcomes will be determined exclusively by the political makeup of Washington.
3. Inflation, Interest Rates, and Economic Growth
The Federal Reserve's decisions regarding interest rates will also play an important role in how markets perform in 2027 and 2028.
If inflation continues to moderate, the Federal Reserve could have more flexibility to reduce interest rates, depending on the broader economic outlook. Lower borrowing costs can support business investment, consumer spending, and certain stock valuations.
If inflation remains elevated, particularly because of higher energy prices or other supply pressures, interest rates could remain higher than investors would prefer. There is also the question of whether the U.S. economy can continue expanding or whether growth will begin to slow.
These are the types of economic variables that can ultimately have a much more direct impact on corporate earnings and stock market returns than the outcome of a congressional election.
What Does History Suggest for the S&P 500 Over the Next Two Years?
When we combine the historical data with the political environment following the November 2026 midterm elections, the overall message is reasonably encouraging. The specific combination of a Democratic-controlled House, Democratic-controlled Senate, and Republican president has produced positive S&P 500 returns in approximately 73% of the calendar years in our historical sample.
The average annual total return was approximately 8.6%, increasing to roughly 10.8% when the extraordinary market decline of 2008 is excluded. Of course, those averages shouldn't be interpreted as a forecast that the S&P 500 will earn 8%, 10%, or any other particular return over the next two years.
There are only 22 annual observations in this historical sample, and those years are concentrated within a relatively small number of presidential administrations. The returns are also influenced by economic cycles, inflation, monetary policy, international events, and many other factors unrelated to political party control.
There's another distinction worth emphasizing: our chart measures full calendar-year returns during periods when this political configuration was in place. It does not measure returns for the precise two-year period immediately following each midterm election. Nevertheless, the historical data helps address a concern that often arises following elections: whether a particular political outcome should cause investors to become more cautious about the stock market.
There is little in this historical sample to suggest that a Democratic Congress and Republican president, by itself, should be viewed as a reason to expect poor stock market returns.
If anything, the numbers demonstrate that markets have navigated this political arrangement successfully many times before.
Should Investors Change Their Portfolios Because of the 2026 Midterm Election Results?
For most long-term investors, the election results alone are unlikely to justify a significant change in investment strategy. One of the common mistakes investors can make is allowing their personal opinions about politics to influence their investment decisions.
For example, an investor who strongly favors one political party may become more optimistic when that party wins an election. Conversely, someone who favors the opposing party may become concerned that the economy or stock market is headed for trouble. But the historical performance of the stock market doesn't always align with those expectations.
Businesses continue to innovate, consumers continue to spend, and companies continue working to grow their earnings under both Democratic and Republican administrations. Rather than attempting to predict how every disagreement in Washington will influence the S&P 500, investors are generally better served by focusing on the factors they can control: maintaining an appropriate asset allocation, diversifying their investments, managing risk, and making sure their portfolio remains aligned with their financial goals.
For someone who has another 15 or 20 years until retirement, the political environment over the next two years is likely to represent a relatively small portion of their overall investment timeline.
For someone who is already retired and drawing income from their investment portfolio, market volatility may require closer attention. But even in that situation, investment decisions should be driven primarily by income needs, risk tolerance, and the overall financial plan rather than assumptions about which political party will be better for stocks.
The Bottom Line: Divided Government Doesn't Have to Be Bad for Stocks
The November 3, 2026, midterm elections have created an interesting political landscape, with Democrats controlling both the House and Senate while a Republican remains president.
Although this particular arrangement doesn't occur after every election, it certainly isn't unprecedented. Looking back at the historical data, the S&P 500 has generated positive annual returns during most of the years when this same political configuration existed. And while some periods produced significant market declines, many of those declines coincided with major economic developments that extended far beyond politics.
Over the next two years, we should expect plenty of political disagreements, congressional debates, and attention-grabbing headlines. But the possibility of legislative gridlock may also mean fewer sweeping policy changes and a greater degree of continuity in the rules under which businesses operate.
Meanwhile, the direction of oil prices, developments involving Iran, corporate investment in artificial intelligence, Federal Reserve policy, and the overall health of the U.S. economy may have a much greater influence on investment returns. The biggest takeaway for investors is that election results may change the political environment, but they don't necessarily change the long-term fundamentals of investing.
And based on what history tells us, the market impact of the November 2026 midterm elections could ultimately be much more muted than the headlines might lead investors to believe.

About Michael……...
Hi, I’m Michael Ruger. I’m the managing partner of Greenbush Financial Group and the creator of the nationally recognized Money Smart Board blog . I created the blog because there are a lot of events in life that require important financial decisions. The goal is to help our readers avoid big financial missteps, discover financial solutions that they were not aware of, and to optimize their financial future.
Frequently Asked Questions About the 2026 Midterm Elections and the Stock Market
-
How will the 2026 midterm election results affect the stock market?The 2026 midterm elections resulted in Democratic control of both chambers of Congress while Republican President Donald Trump remains in office. This creates divided government, which can make major legislative changes more difficult to pass. Historical S&P 500 returns suggest this political arrangement has not consistently been negative for stocks, although economic conditions will ultimately play an important role.
-
Does the stock market perform better under divided government?The stock market has experienced many positive years under divided government, but the historical evidence doesn't establish that divided government consistently outperforms unified government. In the specific scenario involving a Democratic House, Democratic Senate, and Republican president, the S&P 500 averaged approximately 8.6% annually across 22 historical calendar years since 1955.
-
What is the average S&P 500 return with a Democratic Congress and Republican president?Since 1955, the S&P 500 has generated an average annual total return of approximately 8.58% during calendar years when Democrats controlled both the House and Senate and a Republican served as president. Excluding 2008, when the financial crisis caused a substantial market decline, the average increases to approximately 10.75%.
-
How often has the S&P 500 increased under a Democratic Congress and Republican president?The S&P 500 produced positive annual total returns in 16 out of 22 calendar years between 1955 and 2008 when Democrats controlled both chambers of Congress and a Republican occupied the White House. That represents a positive-return frequency of approximately 72.7%.
-
Is political gridlock good or bad for the stock market?Political gridlock can have both advantages and disadvantages for investors. It may reduce the likelihood of unexpected changes to taxes, regulations, and other economic policies, providing businesses with greater predictability. However, gridlock can also create risks involving government funding, debt-ceiling negotiations, and delayed responses to economic problems.
-
Should I sell stocks after the 2026 midterm elections?The midterm election results alone generally should not be the deciding factor in whether an investor sells stocks. Investment decisions should consider financial goals, time horizon, diversification, and risk tolerance. Historical returns do not provide strong support for selling stocks simply because Democrats control Congress while a Republican is president.
-
How did the stock market perform when Democrats controlled Congress under George W. Bush?During 2007 and 2008, the final two calendar years of President George W. Bush's administration, Democrats controlled the House and Senate. The S&P 500 returned 5.49% in 2007 and -37.00% in 2008. The severe decline in 2008 was closely associated with the housing market collapse and global financial crisis.
-
Could the Iran conflict and higher oil prices impact the S&P 500 in 2027?Yes. Higher oil prices can increase business expenses, put upward pressure on inflation, and reduce consumer spending power. These developments may affect corporate earnings and Federal Reserve policy. The outcome of the Iran conflict and the direction of energy prices could be important influences on stock market performance in 2027.
-
Will artificial intelligence have a bigger impact on stocks than the midterm elections?It's possible. Artificial intelligence is driving substantial capital investment and influencing earnings expectations across major technology companies. If AI-related investments produce meaningful productivity improvements and profit growth, they could influence S&P 500 returns substantially. However, disappointing earnings or overly optimistic valuations could also create market volatility.
-
What is the S&P 500 outlook for 2027 and 2028 following the midterm elections?Historically, the S&P 500 has performed reasonably well under the specific combination of a Democratic Congress and Republican president. However, historical averages cannot reliably predict returns for 2027 and 2028. Inflation, interest rates, economic growth, corporate earnings, energy prices, and geopolitical developments are likely to be important factors in determining actual market performance.