Volatility, Market Timing, and Long-Term Investing
For many savers, the objective of a retirement account is to accumulate assets while you are working and use those assets to pay for your expenses during retirement. While you are in the accumulation phase, assets are usually invested and hopefully earn a sufficient rate of return to meet your retirement goal. For the majority,
Volatility, Market Timing, and Long-Term Investing
For many savers, the objective of a retirement account is to accumulate assets while you are working and use those assets to pay for your expenses during retirement. While you are in the accumulation phase, assets are usually invested and hopefully earn a sufficient rate of return to meet your retirement goal. For the majority, these accounts are long-term investments and there are certain investing ideas that should be taken into consideration when managing portfolios. This article will discuss volatility, market timing and their role in long-term retirement accounts.
“Market timing is the act of moving in and out of the market or switching between asset classes based on using predictive methods such as technical indicators or economic data” (Investopedia). In other words, trying to sell investments when they are near their highest and buy investments when they are near their lowest. It is difficult, some argue impossible, to time the market successfully enough to generate higher returns. Especially over longer periods. That being said, by reallocating portfolios and not experiencing the full loss during market downturns, investors could see higher returns. When managing portfolios over longer periods, this should be done without the emotion of day to day volatility but by analyzing greater economic trends.
So far, the stock market in 2018 has been volatile; particularly when compared to 2017. Below are charts of the S&P 500 from 1/1/2018 – 10/21/2018 and the same period for 2017.
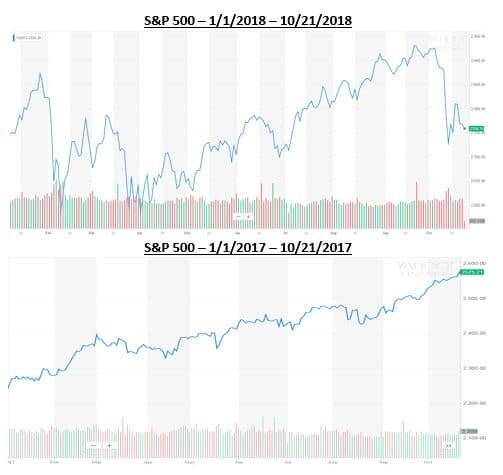
Source: Yahoo Finance. Information has been obtained from sources believed to be reliable and are subject to change without notification.
Based on the two charts above, one could conclude the majority of investors would prefer 2017 100% of the time. In reality, the market averages a correction of over 10% each year and there are years the market goes up and there are years the market goes down. Currently, the volatility in the market has a lot of investors on edge, but when comparing 2018 to the market historically, one could argue this year is more typical than a year like 2017 where the market had very little to no volatility.
Another note from the charts above are the red and green bars on the bottom of each year. The red represent down days in the market and the green represent up days. You can see that even though there is more volatility in 2018 compared to 2017 when the market just kept climbing, both years have a mixture of down days and up days.
A lot of investors become emotional when the market is volatile but even in the midst of volatility and downturns, there are days the market is up. The chart below shows what happens to long-term portfolio performance if investors miss the best days in the market during that period.
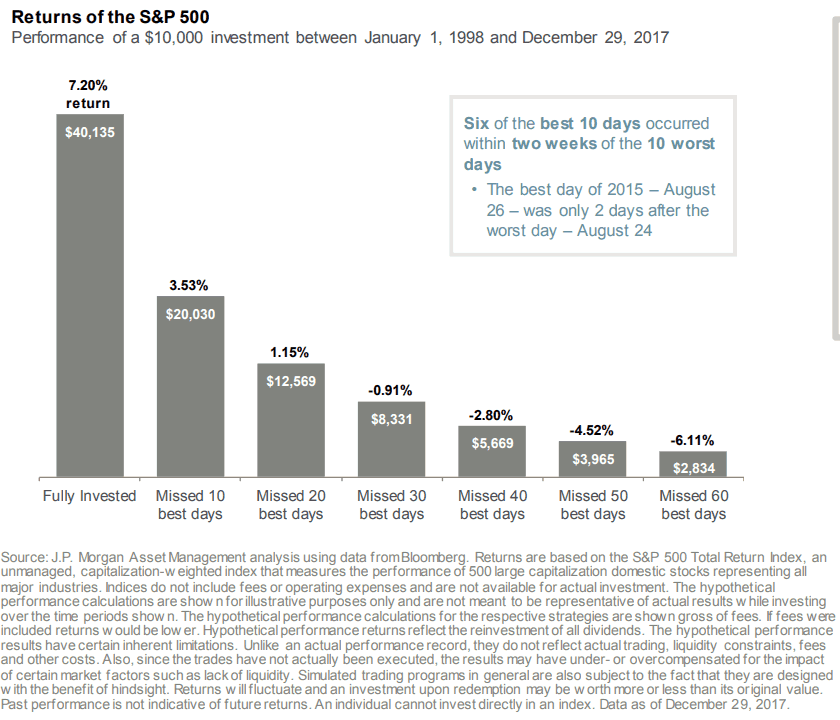
Source: JP Morgan. Information has been obtained from sources believed to be reliable and are subject to change without notification.
Two main takeaways from the illustration above are; 1) missing the best days over a period in the market could have a significant impact on a portfolios performance, and 2) some of the best days in the market over the period analyzed came shortly after the worst days. This means that if people reacted on the worst days and took their money from the market then they likely missed some of the best days.
Market timing is difficult over long periods of time and making drastic moves in asset allocation because of emotional reactions to volatility isn’t always the best strategy for long-term investing. Investors should align their portfolios taking both risk tolerance and time horizon into consideration and make sure the portfolio is updated as each of these change multiple times over longer periods.
When risk tolerance or time horizon do not change, most investors should focus on macro-economic trends rather than daily/weekly/monthly volatility of the market. Not experiencing the full weight of stock market declines could generate higher returns and if data shows the economy may be slowing, it could be a good time to take some “chips off the table”. That being said, looking at past down markets, some of the best days occur shortly after the worst days and staying invested enough to keep in line with your risk tolerance and time horizon could be the best strategy.
It is difficult to take the emotion out of investing when the money is meant to fund your future needs so speaking with your financial consultant to review your situation may be beneficial.
About Rob……...
Hi, I’m Rob Mangold. I’m the Chief Operating Officer at Greenbush Financial Group and a contributor to the Money Smart Board blog. We created the blog to provide strategies that will help our readers personally, professionally, and financially. Our blog is meant to be a resource. If there are questions that you need answered, please feel free to join in on the discussion or contact me directly.


What Does Tax Reform Mean For The Markets In 2018?
2017 ended up being a huge year for the U.S. stock market. The rally in the stock market was unmistakably driven by the anticipated passing of tax reform and Congress delivered. However, the sheer magnitude of the stock market rally has presented investors with a moment of pause and a lot of unanswered questions as we enter into the first quarter

2017 ended up being a huge year for the U.S. stock market. The rally in the stock market was unmistakably driven by the anticipated passing of tax reform and Congress delivered. However, the sheer magnitude of the stock market rally has presented investors with a moment of pause and a lot of unanswered questions as we enter into the first quarter of 2018. The two main questions being:
What does tax reform mean for the markets in 2018?
We are now in the second longest economic expansion of ALL TIME!!! I know what goes up, eventually comes down. Are we overdue for a major correction in the stock market?
Without a crystal ball, no one knows for sure. However, the purpose of this article is to identify indicators in the economy and the financial markets that may help us gauge the direction of the U.S. economy and equity markets as we progress through 2018.
Tax Reform: Uncharted Waters
While tax reform is a welcome friend for corporate America, we have to acknowledge that this also puts us in uncharted waters. Looking back, there has never been a time in history where the U.S. has injected fiscal stimulus (tax reform) into an economy that is already healthy. The last major tax reform was in the early 1980’s when the U.S. economy was trying to dig itself out of the long 1970’s recession.
When the economy is in a recession, the U.S. can either inject fiscal stimulus or monetary stimulus to get the economy growing again. The U.S. used monetary stimulus to dig us out of the Great Recession of 2008 – 2009. They lowered interest rates to basically 0%, pumped cash into the economy in the form of bond buying, and provided a financial back stop for the U.S. banking system.
These economic stimulus tools are similar to the concept of giving a patient in a hospital a shot of adrenaline. If a patient is flat lining, it provides that patient with a huge surge of energy. The patient’s body goes from 0% to 60%+ in under a minute. So what happens when you give someone who is completely healthy a shot of adrenaline? Do they go from 100% to 110%? My point is a healthy patient does not go from 100% to 160%. Both patients get a boost but the boost to the healthy patient is much lower as a percentage of where they started.
While we have never given the U.S. economy an adrenaline shot after a long economic expansion, I think it’s reasonable to apply the same general concept as our two hospital patients. Tax reform may very well lead to another year of positive returns for the stock market in 2018 but I think it’s very important for investors to set a reasonable expectation of return for the U.S. equity markets given the fact that we are injecting growth into an economy that is already at “full employment”.
Not Enough Workers
One of the greatest challenges that the U.S. economy may face in 2018 is a shortage of qualified workers. Prior to tax reform being passed, companies both large and small, have had plenty of job openings but have not been able to find the employees with the skills necessary to fill those positions.
For example, if Apple had 1000 job openings in November 2017 just to meet the current demand for their goods and services but in 2018, due to tax reform, consumers have more money to spend, and the demand for Apple products increases further, Apple may need to find another 2000 employee to meet the increase in demand. They are having trouble now finding the 1000 employees to meet their current demand, how are they going to find another 2000 quick enough in 2018 to meet the increase in demand? If they can’t make the phones, they can’t sell the phones. Fewer sales equals less revenue, which equals less net profit, which may lead to a lower appreciation rate of the stock price. For disclosure purposes, I’m not picking on Apple. I’m just highlighting an issue that may be common among the companies that make up the S&P 500 Index if tax reform leads to a spike in demand in 2018. If Wall Street is expecting accelerated earnings, how are the companies expected to deliver those enhanced earnings without the employees that they need to increase supply?
The unemployment rate in the U.S. is currently 4.1%. You have to go all the way back to the late 1960’s to find an employment rate below 4%. So we are essentially at “full employment”.
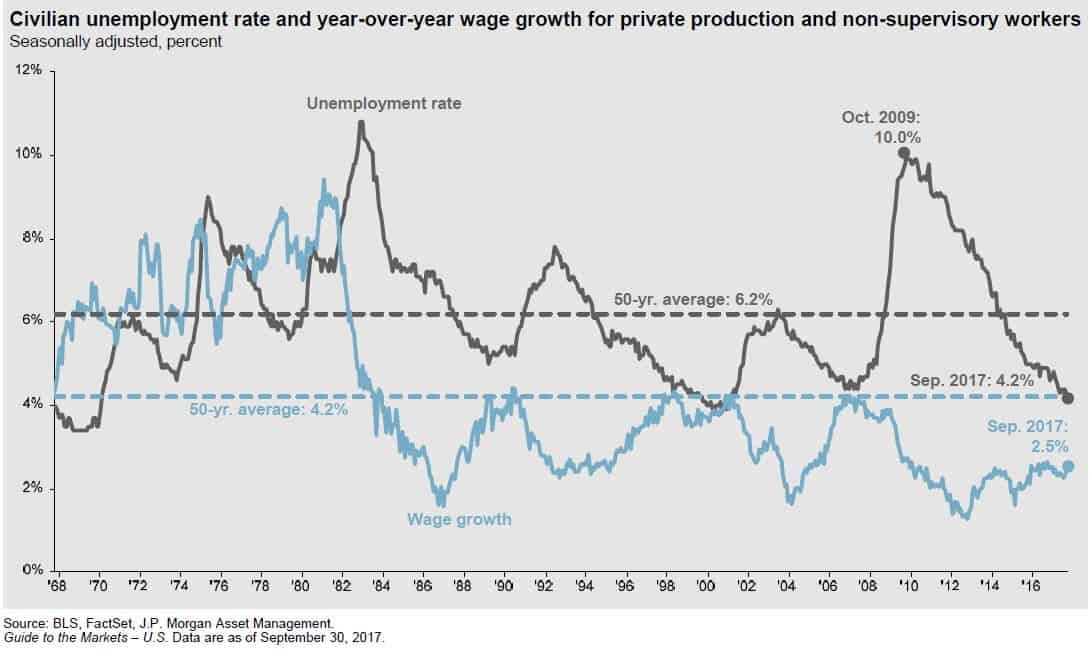
Rising Wages
The blue line in the chart above is also very important. The blue line represents wage growth. This answers the question: "Are people making more for doing the same amount of work?" If you look back historically on the chart, when the unemployment rate was falling, typically wage growth was increasing. It makes sense. When the economy is good and the job market is healthy, companies have to pay their employees more to keep them. Otherwise they will go work for a competitor, who has 10 job openings, and they get paid more. Wage growth is good for employees but it's bad for companies. For companies, employee wages are usually their largest expense. If you increase wages, you are increasing expenses, which decreases profits. Lower profits typically results in lower stock prices. Companies in 2017 had the luxury of strong demand but limited wage growth. My guess is you will begin to see meaningful wage growth in 2018 as companies see an increase in demand as a result of tax reform and end up having to raise wages to retain and attract employees. This is just another reason why 2018 may be a good year for the stock market but not a great one.
What Fuels GDP Growth?
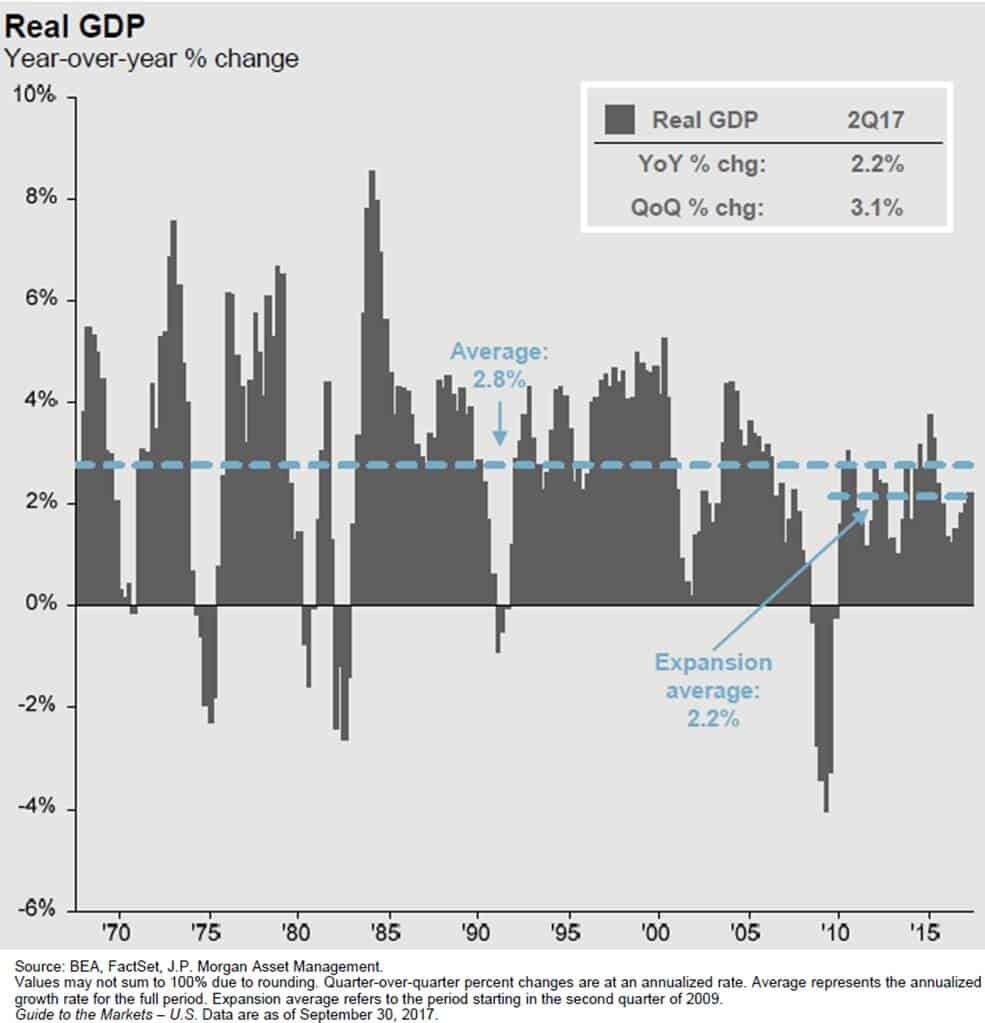
Gross Domestic Product ("GDP") is the economic indicator that is used to measure how much the U.S. economy produces in a year. It's how we gauge whether our economy is growing or contracting. Since March 2009, the GDP growth rate has averaged about 2.2% per year. This is subpar by historic standards. In most economic expansions, GDP is growing at an annual rate of 4%+.
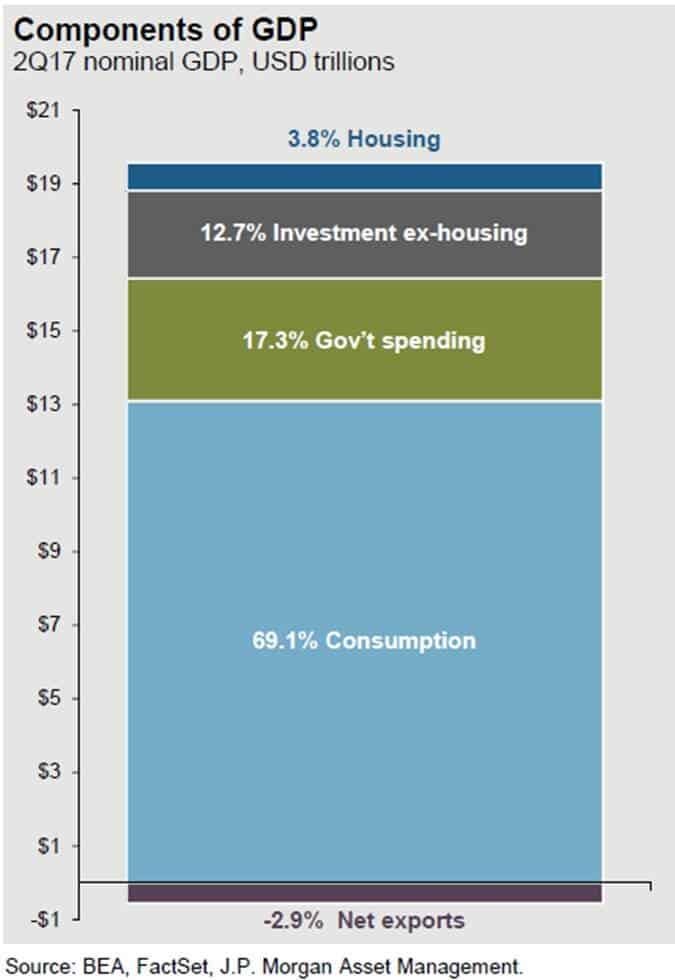
Before we get into what pieces of tax reform may help to increase the GDP growth rate, let us first look at what GDP is made of. Our GDP is comprised of 5 categories (for my fellow econ nerds that assign 4 categories to GDP, we split capital spending into two separate categories):
Consumption or "Consumer Spending" 69.1%
Government Spending (includes defense) 17.3%
Investment (ex-housing) – "Business Spending 12.7%
Housing 3.8%
Net Exports -2.9%
Consumer Spending (+)
Consumer spending which makes up 69.1% of our GDP should increase as a result of tax reform in 2018. In general, if people have more discretionary income, they will spend all or a portion of it. Tax reform will lower the tax bill, for not all, but many U.S. households, increasing their disposable income. Also, if we see an increase in wage growth in 2018, people will be taking home more in their paychecks, allowing them to spend more.
Dr James Kelly, the chief economist of JP Morgan, made a very interesting observation about the evolution of the tax bill. When the tax bills were in their proposed state, one for the Senate and a separate bill for the House, each bill to stay under the $1.5 Trillion 10 year debt cap reduced taxes by about $150 Billion dollars per year. 50% of the annual tax reduction was going to businesses with the other 50% going to individual tax payers.
In order to get the bill passed before the end of the year, Congress was forced to shift a larger proportion of the $150 billion in tax brakes per year to individual taxpayers. In the tax bill’s final form, Dr Kelly estimated that approximately 75% of the tax reductions were now being retained by individual taxpayers with only 25% going to businesses. With a larger proportion of the tax breaks going to individual taxpayers that could increase the amount of discretionary income available to the U.S. consumer.
Government Spending (Push)
The anticipated increase in government spending really stems from the Trump agenda that has been communicated. One of the items that he campaigned on was increasing government spending on infrastructure. At this point we do not have many details as to when the infrastructure spending will begin or how much will be spent. Whatever ends up happening, we are not forecasting a dramatic increase or decrease in government spending in 2018.
Investment - Business Spending (+)
Even though business spending only represents 12.7% of our GDP, we could see a sizable increase in spending by businesses in 2018 for the following reasons:
Corporate tax rate is reduced from 35% to 21%
The repatriation tax will allow companies to bring cash back from overseas at a low tax rate
Prior to tax reform, companies already had historically high levels of cash on their balance sheet. What are they going to do with more cash? (See the chart below)
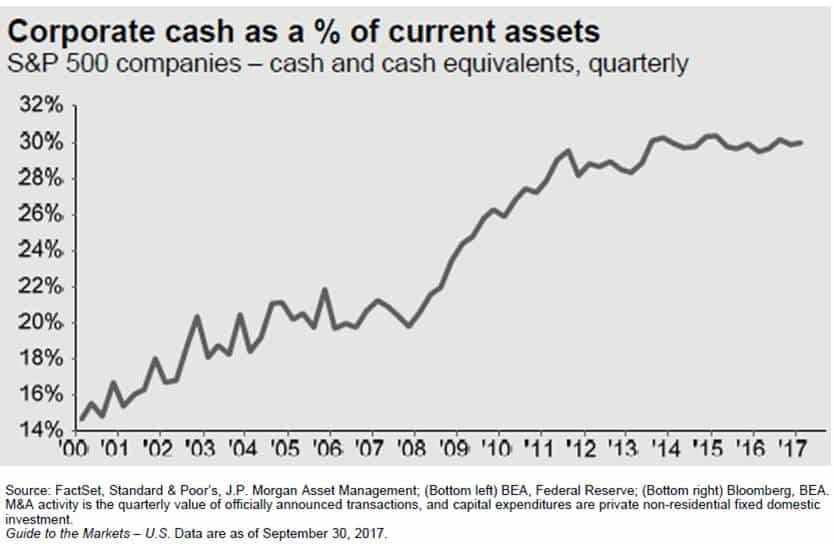
If having more cash was not a large enough incentive by itself for companies to spend money, the new tax rules allowing immediate expensing of the full cost of most assets purchased for the next five years should be. Under the current tax rules, when a business purchases a new piece of equipment, a fleet of trucks, office furniture, whatever it is, the IRS does not allow them to deduct 100% of purchase price in the year that they buy it. They have to follow a "depreciation schedule" and they can only realize a piece of that expense each year. The current tax rules put companies at a tax disadvantage because companies are always trying to shelter as much income as possible from taxation. If Company XYZ buys a piece of equipment that cost $1,000,000, the IRS may require Company XYZ to depreciate that expense over a 10 year period. Meaning they can only realize $100,000 in expenses each year over that 10 year period, even though they already paid the full $1,000,000 for that new piece of equipment.Under the new tax reform, if Company XYZ buys that same new piece of equipment for $1,000,000, they can deduct the full $1,000,000 expense against their income in 2018. Whoa!!! That's huge!! Yes it is and it's a big incentive for companies to spend money over the next five years.
Housing & Net Exports (Push)
We do not expect any significant change from either of these two categories and they represent the smallest portion of our total GDP.
Watch GDP In 2018
The GDP growth rate in 2018 may give us the first indication as to how many "extra innings" we have left in this already long bull market rally. If we do not see a meaningful acceleration in the annual growth rate of GDP above its 2.2% average rate, the rally could be very short lived. On the flip side, if due to tax reform consumer spending and business spending leaps forward in 2018 and 2019, we may be witnessing the longest economic expansion of all time. Time will tell.
Share Buybacks
You will undoubtedly hear a lot about “Share Buybacks” in 2018. Remember, U.S. corporations will most likely have piles of cash on their balance sheets. Instead of spending that money on hiring new employees, buying new equipment, or building a new plant, what else might they do with the cash? The answer, share buybacks.
If a public company like Nike has extra cash, they can go into the market, purchase their own stock, and then get rid of those outstanding shares. Basically it increases the earnings per share for the remaining shareholders.
Example: Let’s assume there are only 4 shares of Nike owned by 4 different people and Nike is worth $100,000. That means that each shareholder is entitled to 25% of that $100,000 or $25,000 each. Now because of tax reform, Nike has $50,000 of extra cash just sitting in its coffers that it otherwise would have paid to the government in taxes. Nike can go into the market with $50,000, purchase 2 shares back from 2 of the shareholders (assuming they would be willing to sell), and then “retire” those two outstanding shares. After that is done, there are 2 outstanding shares remaining but the value of Nike did not change. So the two remaining shareholders, without paying anything extra, now own 50% of Nike, and their shares are worth $50,000 each.
Share buyback may push stock prices higher from a simple math standpoint. If the formula is the value of the company divided by the number of shares outstanding, the fewer shares there are, assuming the value of the company stays the same, the price per share will go up. The incentive for these share buybacks will most likely be there in 2018. Not only will companies have the cash but share buybacks are a way that public companies can reward their current shareholders..
Is The Stock Market Too Expensive?
The P/E ratio of the S&P 500 Index is another barometer that investors will need to keep a close eye on in 2018. P/E ratios help us to answer the questions: “Is the stock market cheap, fairly valued, or expensive at this point?” The “Forward P/E Ratio” divides the price of a stock by the estimated future 12 months of earnings. The average Forward P/E ratio for the S&P 500 Index between December 1989 – September 30, 2017 was 16.0. As of December 22, 2017, the Forward P/E ratio of the S&P 500 Index is 19.99. In other words, it’s running at 25% above its 25 year historic average. See the chart below:
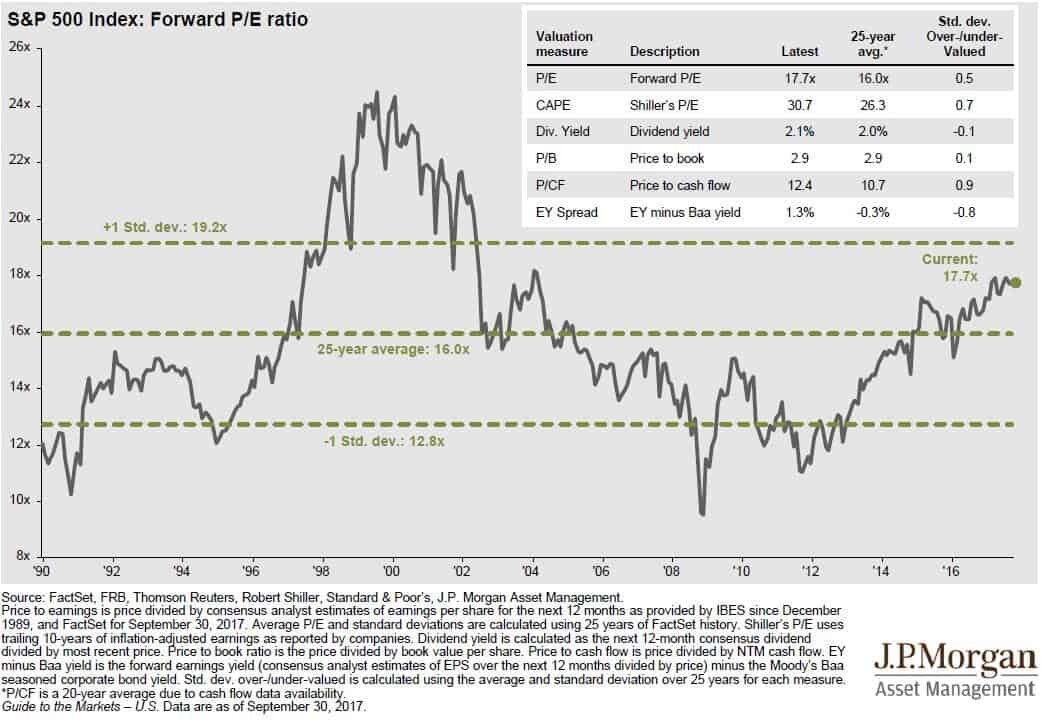
Conclusion, the U.S. stock market is not “cheap” and it’s a stretch to even classify it as “fairly valued”. I think we are well into what I would consider “expensive territory”. What does that mean for investors? You have to stay on your toes!!
Now, we have an anomaly in the mix with tax reform and history does not speak to how this could play out. If tax reform leads to an acceleration in corporate earnings, that in turn could slow the steady climb in the P/E ratio of the S&P 500 because earnings are the denominator in the formula. If stock prices and earnings are accelerating at the same pace, the stock market can go up without a further acceleration of the P/E ratio. Thus, keeping the stock market from becoming more overpriced and further increasing the risk of owning stocks in the S&P 500.
Summary
In 2018, investors should keep a close eye on the U.S. GDP growth rate, the level of spending by corporations and consumers, the volume of share buybacks by U.S. companies, and the P/E ratio of the S&P 500 Index.

About Michael.........
Hi, I’m Michael Ruger. I’m the managing partner of Greenbush Financial Group and the creator of the nationally recognized Money Smart Board blog . I created the blog because there are a lot of events in life that require important financial decisions. The goal is to help our readers avoid big financial missteps, discover financial solutions that they were not aware of, and to optimize their financial future.


Watch These Two Market Indicators
While a roaring economy typically rewards equity investors, the GDP growth rate in the U.S. has continued to grow at that same 2.2% pace that we have seen since the recovery began in March 2009. When you compare that to the GDP growth rates of past economic expansions, some may classify the current growth rate as “sub par”. As in the tale of the
While a roaring economy typically rewards equity investors, the GDP growth rate in the U.S. has continued to grow at that same 2.2% pace that we have seen since the recovery began in March 2009. When you compare that to the GDP growth rates of past economic expansions, some may classify the current growth rate as “sub par”. As in the tale of the tortoise and the hare, sometimes slow and steady wins the race.
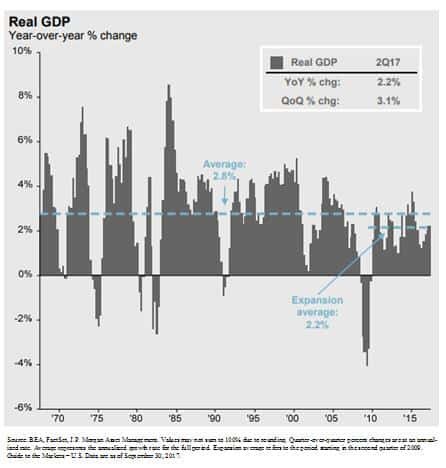
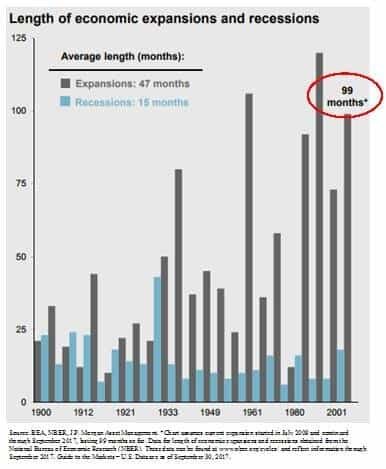
The number one questions on investor’s minds: “It’s been a great rally but are we close to the end?” Referencing the chart below, if you look at the length of the current economic expansion, going back to 1900 we are now witnessing the 3rd longest economic expansion on record which is making investors nervous because as we all know that markets work in cycles.
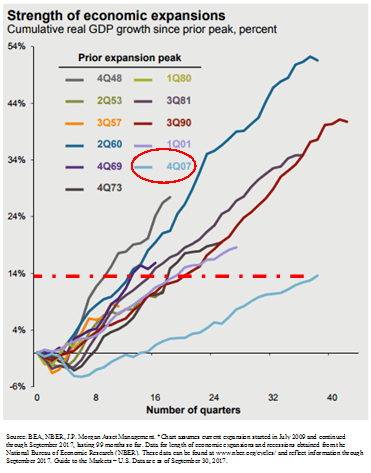
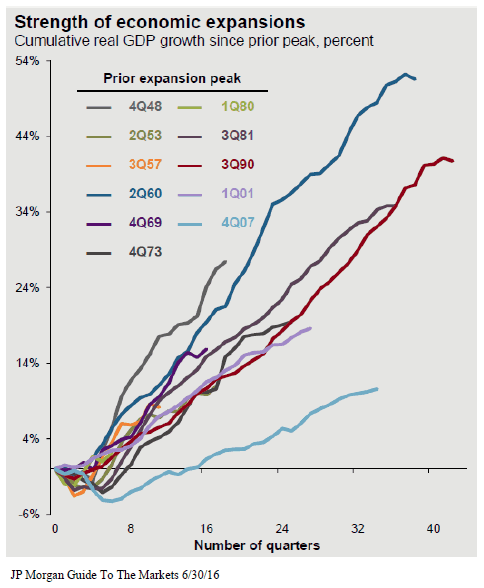
However, if you ignore the “length” of the rally for a moment and look at the “magnitude” of the rally it would seem that total GDP growth of the current economic expansion has been relatively tame compared to some of the economic recoveries in the past. See the chart below. The chart shows evidence that there have been economic rallies in the past that were shorter in duration but greater in magnitude. This may indicate that we still have further to go in the current economic expansion.
What causes big rallies to end?
Looking back at strong economic rallies in the past, the rallies did not die of old age but rather there was an event that triggered the next recession. So we have to be able identify trends within the economic data that would suggest that the economic expansion has ended and it will lead to the next recession.
Watch these two indicators
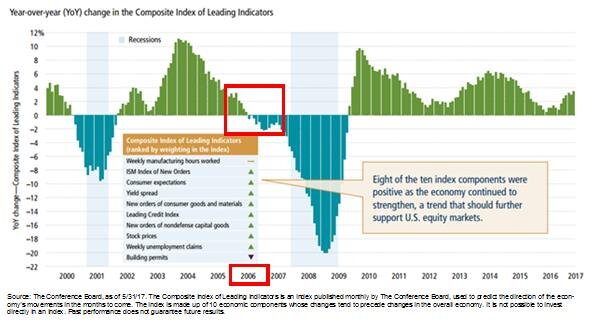
Two of the main indicators that we monitor to determine where we are in the current economic cycle are the Leading Indicators Index and the Yield Curve. History rarely repeats itself but it does rhyme. Look at the chart of the leading indicators index below. The leading indicators index is comprised of multiple economic indicators that are considered “forward looking”, like housing permits. If there are a lot of housing permits being issues, then demand for housing must be strong, and a strong housing market could lead to further economic growth. Look specifically at 2006. The leading indicators went negative in 2006, over a year before the stock market peaked in 2007. This indicator was telling us there was a problem before a majority of investors realized that we were on the doorstep of the recession.
Let’s look at the second key indicator, the yield curve. You will hear a lot about the “slope of the yield curve” in the media. In a healthy economy, long term interest rates are typically higher than short term rates which results in a “positively slopped” yield curve. In other words, when you go to the bank and you have the choice of buying a 2 year CD or a 10 year CD, you would expect to receive a higher interest rate on the 10 year CD because they are locking up your money for 10 years instead of 2.
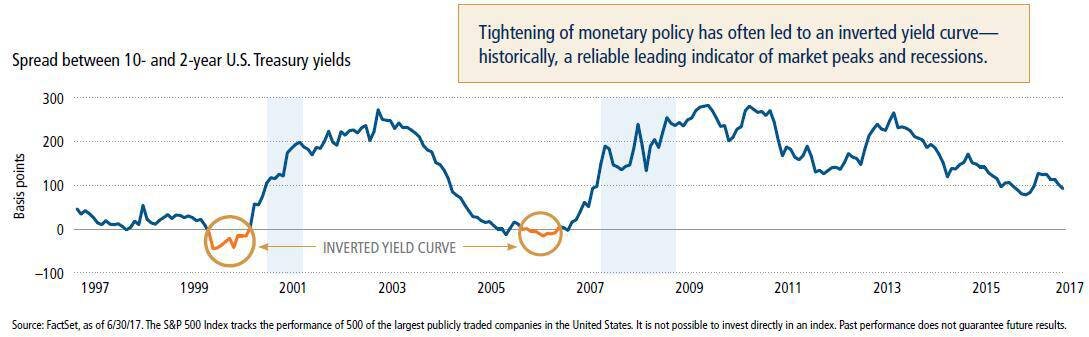
There are periods of time where the interest rate on a 10 year government bond will drop below the interest rate on a 2 year government bond which is considered an “inverted yield curve”. Why does this happen and why would investors by that 10 year bond that is yielding less than the 2 year bond? This happens because bond investors are predicting an economic slowdown in the foreseeable future. They want to lock in the current 10 year interest rate knowing that if the economy goes into a recession that the Fed may begin to lower the Fed Funds Rate which has a more rapid impact on short term rates. It’s a bet that the 2 year bond rate will drop below the 10 year bond rate within the next few years.
If you look at the historical chart of the yield curve above, the yield curve inverted prior to the recession in the early 2000’s and prior to the 2008 recession.
Looking at where we sit today, within the last 6 months the leading indicators index has not only been positive but it’s accelerating and the yield curve is still positively sloped. While we realize that there is not a single indicator that accurately predicts the end of a market cycle, these particular economic indicators have historically been helpful in predicting danger ahead.
There will always be uncertainty in the world. Currently it has taken the form of U.S, politics, tax reforms, geopolitical events, and global monetary policy but it would seem that based on the hard economic data here in the U.S. that our economic expansion that began in March 2009 may still have further to go.
About Michael.........
Hi, I’m Michael Ruger. I’m the managing partner of Greenbush Financial Group and the creator of the nationally recognized Money Smart Board blog . I created the blog because there are a lot of events in life that require important financial decisions. The goal is to help our readers avoid big financial missteps, discover financial solutions that they were not aware of, and to optimize their financial future.
The #1 Question To Ask Yourself Before Selling A Stock
When is the right time to sell an investment? It's a tough decision that individuals have a difficult time making but it's one of the most important decisions that you will have to make as an investor. Often time the decision to "buy" an investment is much easier. You gather information on a given investment, look at the trends in the market acting on

When is the right time to sell an investment? It's a tough decision that individuals have a difficult time making but it's one of the most important decisions that you will have to make as an investor. Often time the decision to "buy" an investment is much easier. You gather information on a given investment, look at the trends in the market acting on that investment, assess the risk versus reward trade off, and you put your strategy to work. Deciding to sell has a lot more emotions involved which frequently causes investors to make the wrong decision.
When do I sell a big winner?
First scenario is "the rocket ship". You purchased a stock and the stock price has gone through the roof. It's made you a ton of money on paper, you proudly boast to your friends and co-workers about the price that you bought it at, and in certain instances it has been a life changing financial event. The mistake investors make here is they get into what we call "the teddy bear syndrome".
Teddy bear syndrome.....
Have you ever tried to take a teddy bear away from a five year old......good luck. As adults, we often fall into the same behavioral pattern with very successful investments. Individuals typically have a strong emotional attachment to their most successful investments. But you will frequently hear many legendary investment managers make comments like: "Investment decisions are not emotional decisions. You have to remove your emotions from the decision-making process." Let's say you bought $10,000 of XYZ stock at $10 per share and five years later it's now selling at $890 per share turning your $10,000 into $890,000. Do you sell some of it, maybe all of it?
Here is the key question........
"If you had that $890,000 in cash in your hand today, would you invest all of it back into XYZ stock at $890 per share?"
Most people would say "No!! That's crazy. I would diversify that $890,000 across a number of holdings and the stock has already gone up so much". Continuing to hold a stock is the same decision as buying a stock. But doing nothing is easier because we feel like we are not making a decision, we are just "continuing to hold". Remember, it's easy to sell a stock that has lost money. It's much more difficult to sell a stock that produced a gain. Of course, this brings up the question of how do you find the right stocks to invest in?
"If I sell the stock, I'll have to pay tax on the gain."
Question: Would you rather pay taxes on a gain or lose money? Usually if you are paying taxes it means that you are making money. If I sold the stock holding in the example above, I would have an $880,000 long term capital gain at a minimum would pay around $132,000 in long term capital gains tax at 15%. This would leave me with $758,000 cash in hand from a $748,000 gain plus $10,000 original investment. What if instead of selling I continue to hold the stock and to no fault of company XYZ the economy goes into a recession? The stock goes from $890 a share to $500 a share. Now my total investment is worth $500,000 instead of $890,000. It's still a good investment because I bought it at $10,000 and it's still worth $500,000 but if I sold it at $500 per share I would still pay tax on the gain, now a smaller amount of gain, and be left with around $425,000. That poor decision cost me $333,000 after tax.
The fallen star
Most investors have been here at one point or another. You purchased a stock that rose in value dramatically but for whatever reason the stock lost all of its early investment gains and your investment is now underwater. Many investors will say “It’s a good long term holding so I’m just going to wait for it to come back.” While we are all familiar with the buy and hold strategy, there is a risk and opportunity cost with this strategy. The risk being that it may never come back to its original value. The opportunity cost is the money invested in that underperforming company could be growing somewhere else instead of just “waiting for it to come back”.
You must ask yourself the same key question that was listed above: “If I had that money in my hand today, would I invest all of it in that stock?” If the answer is “no”, you should probably sell some or all of it. Do not hold a stock solely based on a target share price. I will hear people say, “Well I bought it at $55 per share so I’m going to wait until it at least gets back to that price.” That is not an investment strategy. You must look at the fundamentals of the company, their competitors, global market conditions, company management, the company’s strategy, and their financials to really come up with a price target for the stock.
The inherited gem
It's a common occurrence that individuals will inherit stock from a family member and they know that family member had a strong emotional attachment to the stock because they either work for the company or they never sold a single share during their lifetime. It's easy to feel that selling the stock is in some way selling the memory of that family member. I will often hear comments like: "My dad worked for the company and held that stock for 40 years. He would be rolling in his grave right now if he knew I was thinking about selling his stock." This frequently happens because the generation before us had pension plans to support them in retirement and did not have to sell stock to supplement their income or they came from a generation that was very frugal about spending money. Your needs and circumstances are probably very different from the person that you inherited the stock from so you need to look at that investment holding from your financial standpoint.
I work for the company........
If you work for a publicly traded company then there is a good chance that you own shares of that company in an employee stock purchase plan, retirement plan, options plan, or brokerage account. Since you work for the company it usually means that you have "drank the kool-aide" and believe in the company's mission, vision, and you feel like you have more control over the fate of your investment. Remember, even though you work for that company it's still one company and attaching too much for your net worth to one investment is very risky. It's even more risky for employees because if something negatively impacts the company not only is your employment at risk but so is your total net worth if a large portion of your investment portfolio is tied to the company that you work for. Make sure you periodically calculate a total of all your investment holdings and compare that to the amount invested in your company's stocks to make sure you stay balanced in your overall investment approach.
Ask yourself the easy question.......
While making the decision to buy, sell, or hold an investment is not always an easy one. Finding the right answer may be as easy as asking yourself: "If the amount invested in that stock was in cash and in my hand today, would I invest 100% of it back into that stock holding?"
About Michael.........
Hi, I’m Michael Ruger. I’m the managing partner of Greenbush Financial Group and the creator of the nationally recognized Money Smart Board blog . I created the blog because there are a lot of events in life that require important financial decisions. The goal is to help our readers avoid big financial missteps, discover financial solutions that they were not aware of, and to optimize their financial future.

Should I Gift A Stock To My Kids Or Just Let Them Inherit It?
Many of our clients own individual stocks that they either bought a long time ago or inherited from a family member. If they do not need to liquidate the stock in retirement to supplement their income, the question comes up “should I just gift the stock to my kids while I’m still alive or should I just let them inherit it after I pass away?” The right answer is

Many of our clients own individual stocks that they either bought a long time ago or inherited from a family member. If they do not need to liquidate the stock in retirement to supplement their income, the question comes up “should I just gift the stock to my kids while I’m still alive or should I just let them inherit it after I pass away?” The right answer is largely influenced by the amount of appreciation or depreciation in the stock.
Gifting Stock
When you make a non-cash gift such as a stock, house, or even a business, the person receiving the gift assumes your cost basis in the assets. They do not receive a “step-up” in basis at the time the gift is made. Example, I buy XYZ Corp stock in 1995 for $10,000. In 2017, those shares of XYZ are now worth $100,000. If I gift them to my kids, no one owes tax on the gift at the time that the gift is made but my kids carry over my cost basis in the stock. If my kids hold the stock for 10 more years and sell it for $150,000, their basis in the stock is $10,000, and they owe capital gains tax on the $140,000 gain. Thus, creating an adverse tax consequence for my kids.
Inheriting Stock
Instead, let’s say I continue to hold XYZ stock and when I pass away my kids inherited the stock. If I pass away in 10 years and the stock is worth $150,000 then my kids receive a “step-up” in basis which means that their cost basis in the stock is the value of the stock as of the date of my death. They inherit the stock at $150,000 value, sell it the next day, and they owe $0 in taxes due to the step-up in basis upon my death.
In general, if you have assets that have low cost basis it is usually better for your heirs to inherit the assets as opposed to gifting it to them.
The concept is often times reversed for assets that have depreciated in value…..with an important twist. If I purchase XYZ Corp stock in 1995 for $10,000 but in 2017 it’s only worth $5,000, if I sold the stock myself I would capture the realized investment loss and could use it to offset investment gains or reduce my income by $3,000 for the IRS realized loss allowance.
Here is a very important rule......
In most cases, do not gift a depreciated asset to someone else. Why? When you gift an asset that has depreciated in value the carry over basis rules change. For an asset that has depreciated in value, the carry over basis for the person receiving the gift is the higher of the fair market value of the asset or the cost basis of the person making the gift. In other words, the loss evaporates when I gift the asset to someone else and no one gets the tax advantage of using the realized loss for tax purposes. It would be better if I sold the stock, captured the investment loss, and then gifted the cash.
If they inherit the stock that has lost value there is no value to the step-up in basis because the stock has not appreciated in value.
About Michael……...
Hi, I’m Michael Ruger. I’m the managing partner of Greenbush Financial Group and the creator of the nationally recognized Money Smart Board blog . I created the blog because there are a lot of events in life that require important financial decisions. The goal is to help our readers avoid big financial missteps, discover financial solutions that they were not aware of, and to optimize their financial future.


How Do Phantom Stock Plans Work?
In the world of executive compensation, there are a number of ways that a company can reward key employees. Although most companies are familiar with traditional deferred compensation plans, one of the lesser known options which is growing in popularity is called a “phantom stock plan”. Especially in small to mid-size companies.

In the world of executive compensation, there are a number of ways that a company can reward key employees. Although most companies are familiar with traditional deferred compensation plans, one of the lesser known options which is growing in popularity is called a “phantom stock plan”. Especially in small to mid-size companies.
Here is the most common situation, a closely held business or family business has a key employee that they would like to reward but also further tie that employee to the company. The current owners of the company do not want to give up equity but they want to tie this reward system to the actual performance of the company as if that key employee was an owner or shareholder. This can be accomplished via a phantom stock plan.
These plans provide select employees with additional compensation equal to the appreciation of a percent of the company for a partnership, LLC, or PLLC, or in the case of an S-corp or C-corp a given number of shares in the company even though the ownership only exists in theory. For example, I own a company that is incorporated as a partnership and I would like to reward a key employee by providing them with an annual cash reward equal to a 5% ownership stake in the company without formally making them a partner. Once the books are closed at the end of year I will issue a cash bonus to that employee equal to 5% of the net profits for the year. From the employee’s standpoint, they are receiving the monetary reward mimicking a 5% ownership share of the company so they have an incentive to continue to grow the company. From the employer’s standpoint, they have taken further steps to retain a key employee, they can deduct the additional comp pay to the employee, and the current owners have retained full control of the company.
The features of these plans and how they are design are limitless because they are just another flavor of nonqualified executive compensation plan. A few plan design features are listed below:
Companies have full discretion as to who is covered and not covered by the plan
Instead of paying out the benefit each year as compensation, the company can attach a vesting schedule to essentially put “golden handcuffs” on the key employee. If they leave the company prior to a stated date they lose the benefit.
When awarding the shares or ownership the company can limit the award to just the appreciation of their shares or ownership percentage and not award the full current value of the ownership percentage. These are called “appreciation only” plans. Appreciation only phantom stock plans can be viewed as a favorable option to key employees because it does not require them to make a cash outlay to purchase their ownership interest as would normally be required by an actual equity or share purchase.
How do these plans work from an operation standpoint? The ownership percentage or shares are issued to the employee as hypothetical units or “phantom units” that are just tracked internally by the company. The employee is taxed on the benefit and the company can take the deduction for the compensation paid when there is no longer a “risk of forfeiture”. In other words, when the employee vests in the benefit whether they decide to “sell their phantom shares” or not. As soon as the employee has the ability to “sell” their phantom interest in exchange for compensation that triggers the taxable event.
When designed correctly, these plans can be a valuable tool for small to mid-size companies in their efforts to retain key employees.
About Michael……...
Hi, I’m Michael Ruger. I’m the managing partner of Greenbush Financial Group and the creator of the nationally recognized Money Smart Board blog . I created the blog because there are a lot of events in life that require important financial decisions. The goal is to help our readers avoid big financial missteps, discover financial solutions that they were not aware of, and to optimize their financial future.


A New Year: Should I Make Changes To My Retirement Account?
A simple and easy answer to this question would be…..Maybe? Not only would that answer make this article extremely short, it wouldn’t explain some important items that participants should take into consideration when making decisions about their retirement plan.Every time the calendar adds a year we get a sense of reset. A lot of the same tasks on the

A simple and easy answer to this question would be…..Maybe? Not only would that answer make this article extremely short, it wouldn’t explain some important items that participants should take into consideration when making decisions about their retirement plan.Every time the calendar adds a year we get a sense of reset. A lot of the same tasks on the to do list get added each January and hopefully this article helps you focus on matters to consider regarding your retirement plan.
Should I Consult With The Advisor On My Plan?
At our firm we make an effort to meet with participants at least annually. Saving in company retirement plans is about longevity so many times the individual meetings are brief and no allocation changes are made. Even if this is the result, an overview of your account, at least annually, is a good way to keep retirement savings fresh in your mind and add a sense of comfort that you’re investing appropriately based on your time horizon and risk tolerance.
These individual meetings are also a good time to discuss other financial questions you may have. Your retirement plan is only a piece of your financial plan and we encourage participants to use the resources available to them. Often times these meetings start off as a simple account overview but turn into lengthy conversations about various financial decisions the participant has been weighing.
How Much Should I Be Contributing This Year?
This answer is not the same for everyone because, among other things, people have different retirement goals, financial situations, and time horizon. That being said, if the company has a match component in their plan, the first milestone would be to contribute enough to receive the most the company is willing to give you. For example, if the company will match 100% of your contributions up to 3% of pay, any amount you contribute less than 3% will leave you missing out on retirement savings the company is willing to provide you.
Again, the amount that should be saved is dependent on the individual but saving anywhere from 10% to 15% of your compensation is a good benchmark. In the previous example, if the company will match 3%, that means you would have to contribute 7% to achieve the lower end of that benchmark. This may seem like a difficult task so starting at an amount you are comfortable with and working your way to your ultimate goal is important.
Should You Be Making Allocation Changes?
The initial allocation you choose for your retirement account is important. Selecting the appropriate portfolio from the start based on your risk tolerance and time until retirement can satisfy your investment needs for a number of years. The chart below shows that over longer periods of time historical annual returns tend to be less volatile.
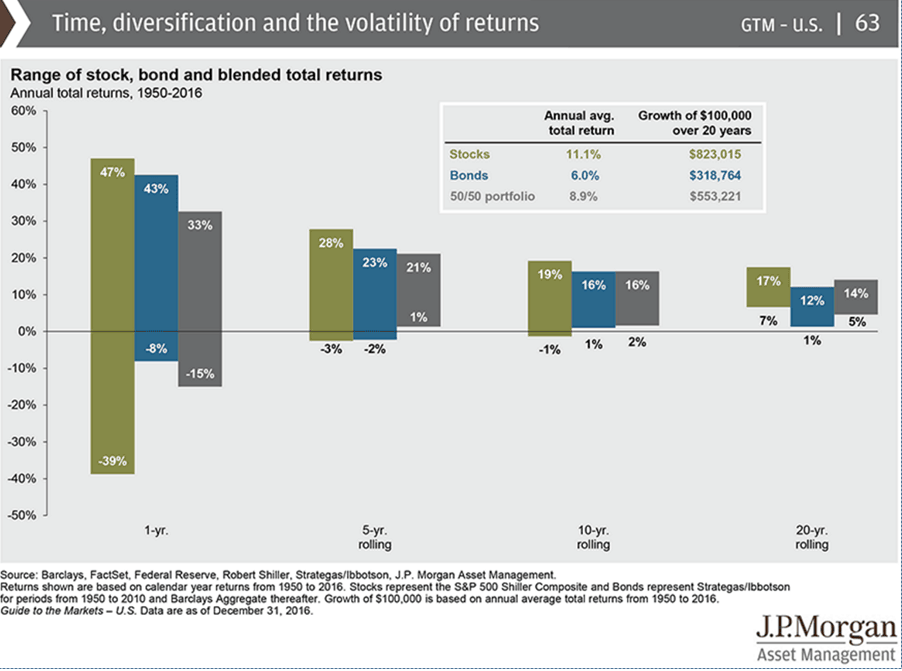
When you have over 10 years until retirement, reviewing the account at least annually is important as there are a number of reasons you would want to change your allocation. Lifestyle changes, different retirement goals, or specific investment performance to name a few. Participants tend to lose out on investment return when they try to time the market and are forced to sell low and buy high. This chart shows that even though there may be volatility in the short term, as long as you have time and an appropriate allocation from the start, you should see returns that will help you achieve your retirement goals.
About Rob……...
Hi, I’m Rob Mangold. I’m the Chief Operating Officer at Greenbush Financial Group and a contributor to the Money Smart Board blog. We created the blog to provide strategies that will help our readers personally , professionally, and financially. Our blog is meant to be a resource. If there are questions that you need answered, pleas feel free to join in on the discussion or contact me directly.
Where Are We In The Market Cycle?
Before you can determine where you are going, you first have to know where you are now. Seems like a simple concept. A similar approach is taken when we are developing the investment strategy for our client portfolios. The question more specifically that we are trying to answer is “where are we at in the market cycle?” Is there more upside
Before you can determine where you are going, you first have to know where you are now. Seems like a simple concept. A similar approach is taken when we are developing the investment strategy for our client portfolios. The question more specifically that we are trying to answer is “where are we at in the market cycle?” Is there more upside to the market? Is there a downturn coming? No one knows for sure and there is no single market indicator that has proven to be an accurate predicator of future market trends. Instead, we have to collect data on multiple macroeconomic indicators and attempt to plot where we are in the current market cycle. Here is a snapshot of where we are at now:
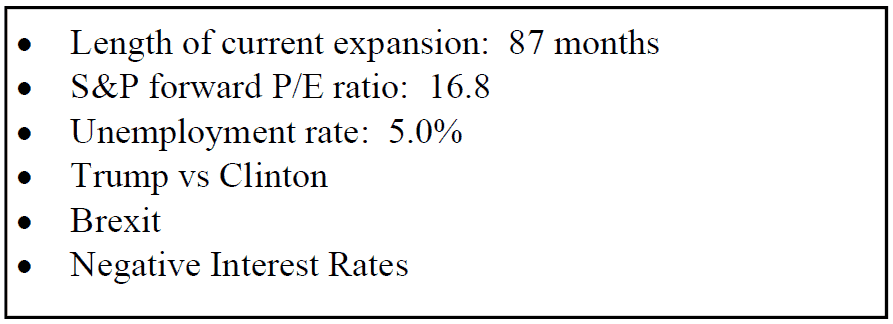
The length of the current bull market is starting to worry some investors. Living through the tech bubble and the 2008 recession, those were healthy reminders that markets do not always go up. We are currently in the 87th month of the expansion which is the 4th longest on record. Since 1900, the average economic expansion has lasted 46 months. This leaves many investors questioning, “is the bull market rally about to end?” We are actually less concerned about the “duration” of the expansion. We prefer to look at the “magnitude” of the expansion. This recovery has been different. In most economic recoveries the market grows rapidly following a recession. If you look at the magnitude of this expansion that started in the 4th quarter of 2007 versus previous expansions, it has been lackluster at best. See the chart on the next page. This may lead investors to conclude that there is more to the current economic expansion.
Next up, employment. Over the past 50 years, the unemployment rate has averaged 6.2%. We are currently sitting at an unemployment rate of 5.0%. Based on that number it may be reasonable to conclude that we are close to full employment. Once you get close to full employment you begin to lose that surge in growth that the economy receives from adding 250,000+ jobs per month. It may also imply that we are getting closer to the end of this market cycle.
Now let’s look at the valuation levels in the stock market. In other words, in general are the stocks in the S&P 500 Index cheap to buy, fairly valued, or expensive to buy at this point? We measure this by the forward price to earning ratio (P/E) of the S&P 500 index. The average P/E of the S&P 500 over the last 25 years is 15.9. Back in 2008, the P/E of the S&P 500 was around 9.0. From a valuation standpoint, back in 2008, stocks were very cheap to buy. When stocks are cheap, investors tend to hold them regardless of what’s happening in the global economy with the hopes that they will at least become “fairly valued” at some point in the future. Right now the P/E Ratio of the S&P 500 Index is about 16.8 which is above the 15.9 historic average. This may indicate that stock are starting to become “expensive” from a valuation standpoint and investors may be tempted to sell positions during periods of volatility.
Even though stocks may be perceived as “overvalued” that does not necessarily mean they are not going to become more overvalued from here. In fact, often times after long bull rallies “the plane will overshoot the runway”. However, it does typically mean that big gains are harder to come by since a large amount of the future earnings expectations of the S&P 500 companies are already baked into the stock price. It leaves the door open for more quarterly earning disappointments which could rise to higher levels of volatility in the markets.

The most popular question of the year goes to: “Trump or Hillary? And how will the outcome impact the stock market?” I try not to get too deep in the weeds of politics mainly because history has shown us that there is no clear evidence whether the economy fares better under a Republican president or a Democratic president. However, here is the key point. Markets do not like uncertainty and one of the candidates that is running (I will let you guess which one) represents a tremendous amount of uncertainty regarding the actions that they may take if elected president of the United States. Still, under these circumstances, it is very difficult to develop a sound investment strategy centered around political outcomes that may or may not happen. We really have to “wait and see” in this case.
Let’s travel over the Atlantic. Brexit was a shock to the stock market over the summer but the long term ramifications of the United Kingdom’s exit from the European Union is yet to be known. The exit process will most likely take a number of years as the EU and the UK negotiate terms. In our view, this does not pose an immediate threat to the global economy but it will represent an ongoing element of uncertainty as the EU continues to restart sustainable economic growth in the region.
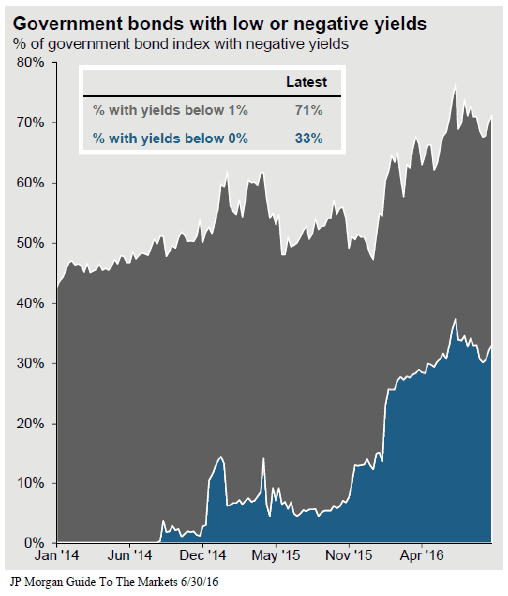
The chart below is one of the most important illustrations that allows us to gauge the overall level of risk that exists in the global economy. When a country wants to jump start its economy it will often lower the reserve rate (similar to our Fed Funds Rate) in an effort to encourage lending. An increase in borrowing hopefully leads to an increase in consumer spending and economic growth. Unfortunately, countries around the globed have taken this concept to an extreme level and have implemented “negative rates”. If you buy a 10 year government bond in Germany or Japan, you are guaranteed to lose money over that 10 year period. If you have a checking account at a bank in Japan, instead of receiving interest from the bank, the bank may charge you a fee to hold onto your own money. Crazy right? It’s happening. In fact, 33% of the countries around the world have a negative yield on their 10 year government bond. See the chart below. When you look around the globe 71% of the countries have a 10 year government bond yield below 1%. The U.S. 10 Year Treasury sits just above that at 1.7%.
So, what does that mean for the global economy? Basically, countries around the world are starving for economic growth and everyone is trying to jump start their economy at the same time. Possible outcomes? On the positive side, the stage is set for growth. There is “cheap money” and favorable interest rates at levels that we have never seen before in history. Meaning a little growth could go a long ways.
On the negative side, these central banks around the global are pretty much out of ammunition. They have fired every arrow that they have at this point to prevent their economy from contracting. If they cannot get their economy to grow and begin to normalize rates in the near future, when they get hit by the next recession they will have nothing to combat it with. It’s like the fire department showing up to a house fire with no water in the truck. The U.S. is not immune to this situation. Everyone wants the Fed to either not raise rates or raise rates slowly for the fear of the negative impact that it may have on the stock market or the value of the dollar. But would you rather take a little pain now or wait for the next recession to hit and have no way to stop the economy from contracting? It seems like a risky game.
When we look at all of these economic factors as a whole it suggests to us that the U.S. economy is continuing to grow but at a slower pace than a year ago. The data leads us to believe that we may be entering the later stages of the recent bull market rally and that now is a prudent time to revisit the level of exposure to risk assets in our client portfolios. At this point we are more concerned about entering a period of long term stagnation as opposed to a recession. With the rate of economic growth slowing here in the U.S. and the rich valuations already baked into the stock market, we could be entering a period of muted returns from both the stock and bond market. It is important that investors establish a realistic view of where we are in the economic cycle and adjust their return expectations accordingly.
As always, please feel free to contact me if you’d like to discuss your portfolio or our outlook for the economy.
About Michael……...
Hi, I’m Michael Ruger. I’m the managing partner of Greenbush Financial Group and the creator of the nationally recognized Money Smart Board blog . I created the blog because there are a lot of events in life that require important financial decisions. The goal is to help our readers avoid big financial missteps, discover financial solutions that they were not aware of, and to optimize their financial future.

Market Alert - UK Votes To Exit EU
We have been working through the night to monitor the UK exit vote in Europe and wanted to get this information out as soon as possible.Today is a historic day. Last night the UK voted whether or not to leave the European Union. The polls closed at 10 p.m. last night, the votes were counted, and at 2 a.m. this morning it was announced that the UK had

We have been working through the night to monitor the UK exit vote in Europe and wanted to get this information out as soon as possible.Today is a historic day. Last night the UK voted whether or not to leave the European Union. The polls closed at 10 p.m. last night, the votes were counted, and at 2 a.m. this morning it was announced that the UK had voted 51.9% in favor of leaving the EU. To put this situation in context, this would be similar to New York deciding to leave the United States to form its own country.
This was not the expected outcome and is largely an unprecedented event. Going into the vote yesterday most polls expected the UK “stay” vote to prevail given the economic headwinds that the UK would face if the “leave” vote were to win. David Cameron, the prime minister of the UK, was largely in favor of the UK staying in the EU. Today at 3:30 a.m., Cameron announced that he would step down as the prime minister since new leadership, that is in favor of the exit, should be in place to negotiate Britain’s exit from the EU.
The European Union (EU) is made up of 28 countries. It was originally formed back in 1957 with the goal of preventing wars and strengthening the economic bond between the European countries in its membership. The UK joined the EU in 1973. Members of the EU benefit from:
Freedom of movement between countries
Freedom of trade for goods, services, and capital
EU human rights protection
Euro currency (the UK does not participate in the euro currency)
The Argument To Stay In The EU
Supporters of the UK to stay in the EU believe that the Union is better for the British economy and that concerns about migration and other issues stemming from EU membership are not important enough to outweigh the economic consequences of leaving. Many economists agree with this claim. Europe is Britain’s most important export market and its greatest source of foreign direct investment. An exit of the EU could jeopardize its financial status in the world and the high paying jobs that come with that status.
Those who voted to stay were not necessarily defending the EU but were basically arguing that the UK is stronger with the EU than without.
Argument To Leave The EU
Those in favor of the UK leaving the EU believe that leaving the European Union is necessary for the UK to restore the country’s identity. Immigration has been one of the largest issue on the agenda with refugees entering the UK under the EU’s permission and “taking jobs” in the place of UK citizens. Voters in the middle to lower income classes are viewed as more likely to support leaving the Union due to a feeling of being “abandoned by their country” in lieu of the EU policies.
In a way Britain feels like they used to matter to the world as an independent country but over the years have lost their identity now that they are lumped into the EU. This group of individuals wants to be able to have full control over the country’s economic policy, culture, political system, and judicial system.
What Happens Next?
Now that the UK has voted to leave the EU, it has become clear that there needs to be new leadership in government that supports the UK exit since most of the current leaders, including the prime minister, were in favor of the UK staying in the EU. We would expect this to happen in a fairly short period of time.
Once the new leadership is in place, the negotiation will begin between the UK and the EU for the exit. There is not a precedence for this process which leaves a lot of unknowns. Immediately, nothing changes. Most likely while the negotiations are taking place over the course of next few months, or more likely years since the UK is still technically an EU member, UK citizens will still be able to move about the Eurozone countries freely, trade will continue, etc.
However, there will most likely be an immediate negative impact on the UK economy given the expectation of the exit. The British pound (currency) will most likely drop significantly. The profitability of the multinational companies and banks that are headquartered in the UK will come into question since they will eventually lose the benefits of free trade and capital movements with other EU countries.
Overall we are entering a period of increased uncertainty. Unfortunately, in our view, there is a larger issue at hand. Yes, the UK exiting the EU is a significant event but the larger issue is for the first time they are laying the ground work that will allow a country to exit the EU. There are other countries in the EU that may take up similar votes to leave the European Union since a precedence is now being set for the UK to exit. If the entire EU were to further destabilize it would most likely cause further disruption across the global economy.
Michael Ruger
About Michael……...
Hi, I’m Michael Ruger. I’m the managing partner of Greenbush Financial Group and the creator of the nationally recognized Money Smart Board blog . I created the blog because there are a lot of events in life that require important financial decisions. The goal is to help our readers avoid big financial missteps, discover financial solutions that they were not aware of, and to optimize their financial future.


How Much Money Do I Need To Save To Retire?
This is by far the most popular question that we come across as financial planners. You may have heard some of the "rules of thumb" like “80% of your current take-home pay” or “1 million dollars”. In reality, the answer varies greatly on an individual by individual basis. This article will outline the procedures that we follow as financial planners to help

poc
This is by far the most popular question that we come across as financial planners. You may have heard some of the "rules of thumb" like “80% of your current take-home pay” or “1 million dollars”. In reality, the answer varies greatly on an individual by individual basis. This article will outline the procedures that we follow as financial planners to help individuals answer this very important question.
Step 1: Estimate Your Annual Expenses In Retirement
The first step is to get a ballpark idea of what your annual expenses might look like in retirement. The best place to start is to list your current monthly and annual expenses. Then create a separate column labeled “expenses in retirement”. Whether you are 2 years, 10 years, or 20 years away from retirement the idea is to pretend as if you were retiring tomorrow and determining what your annual expenses might look like. Some of your expenses in retirement will be lower, others may be higher, but most people find that a lot of their current expenses will carry over at the same level into the retirement years. This is because most people have become accustom to a certain standards of living and they intend to maintain that standard of living in retirement. Here are a few important questions that you should ask yourself when forecasting your retirement expenses:
How much should I budget for health insurance?
Will I have a mortgage or debt when I retire?
Do I plan to move when I retire?
Since I will not be working, should I budget additional expenses for vacations and hobbies?
Will I need to keep my life insurance policies after I retire?
Step 2: Adjust Your Retirement Expenses For Inflation
Now that you have a ballpark number of your annual expenses in retirement, you will need to adjust those expenses for inflation. Inflation is just a fancy word for “the price of everything that we buy today will gradually go up in price over time”. If the price of a gallon of milk today is $2 then most likely 20 years from now that same gallon of milk will cost $3.51. A 75% increase!! Historically inflation has grown at a rate of about 3% per year. There are periods of time when the rate of inflation grows faster or slower but on average it grows at 3% per year.
Another way to look at inflation is $20,000 in today’s dollars will not buy the same amount of goods and services 10 years from now because inflation erodes the purchasing power of your $20,000. If I did my annual expense planner and it tells me that I need $50,000 per year in retirement to meet all of my estimated expenses, let’s look at what adjusting that $50,000 for inflation does over different periods of time assuming a 3% rate of inflation:
Today’s Dollars 5 Years From Now 10 Years From Now 20 Years From Now
$50,000 $56,275 $65,238 $87,675
In the above example, if I am retiring in 10 years, and my estimated annual expenses in retirement will be $50,000 in today’s dollars, by the time I retire 10 years from now my annual expenses will increase to $65,238 per year just to stay in the same place that I am in today. Also, inflation does not stop when you retire, it continues into the retirement years. If I am 50 today and plan to live until 90, I have to apply this inflation adjustment for 40 years. It’s clear to see how inflation can have a significant impact on the amount that you may need to withdrawal for your account to meet you estimated expenses at a future date.
Step 3: Gather The Information On Your Current Assets
Once you know your expenses, you now need to gather all of the information on your retirement accounts and pension plans. You should collect the most recent statement for all of your investment accounts (401K, 403B, IRA’s, brokerage accounts, stocks, etc.), pension statements (if applicable), obtain your most recent social security statement, and gather information on the other sources of income and/or assets that may be available when you retire. Such as:
Sale of a business
Downsizing the primary residence
Rental income
Part-time employment
Step 4: Project The Growth Of Your Retirement Assets
There are three main categories to consider when calculating the growth rate of your retirement assets:
Annual contributions
Withdrawals
Investment rate of return
For annual contributions, it’s determining which accounts you plan on making deposits too each year and how much? For most individuals, their employer sponsored retirement plan is the main source of new contributions to their retirement nest egg. If your employer makes regular employer contributions to your retirement plan, you should factor those in as well. For example, if I am contributing 8% of my pay into the plan and my employer is providing me with a 4% matching contributions, I would reasonably assume that I’m adding 12% of my pay to my 401(k) plan each year.
The most popular question that we get in this category is “how much should I be contributing each year to my retirement account with my employer?” We advise employees that they should have a goal of contributing 10% of their pay each year to their retirement accounts. This is an aggregate total between your personal contributions and the employer contributions. Even if you cannot reach that level right now, 10%+ is the target.
Let’s move onto the next category…….withdrawals. Pre-retirement withdrawals from retirement accounts have become much more common in recent years due largely to the rising cost of college education. Parents will take loans from their 401K/403B plans or take early withdrawals from IRA accounts to fulfill the need for additional income during the years that their children are in college. If part of your overall financial plan is to use your retirement accounts to pay for one-time expenses such as college, you will need to factor that into your projections.
The third variable to consider when determining the growth of your assets is the assumed annual rate of return on your investments. There are many items to consider when determining a reasonable annual rate of return for your accounts. Some of those considerations include:
Time horizon to retirement
Allocation of your portfolio (stocks vs bonds)
Concentrated holdings (10%+ of your portfolio allocated to a single investment)
Accumulation phase versus distribution phase
The answer to the question: “what rate of return should I expect from my retirement accounts?”, can really only be determine on a case by case basis. Using an unreasonable rate of return assumption can create a significant disconnect between your retirement projections versus what is likely to actually occur within your investment accounts. Be careful with this step.
Step 5: Factor In Taxes
Don’t forget about the lovely IRS. All assets are not treated equally from a tax standpoint. For most individuals, the majority of their retirement savings will be in pre-tax retirement vehicles such as 401(k), 403(b), and Traditional IRA’s. That means when you take distributions from those accounts, you will realize earned income, and have to pay tax. For example, if you have $400,000 in your 401K account and you are in the 25% tax bracket, $100,000 of that $400,000 will be lost to taxes as withdrawals are made from the account.
If you have after tax investment accounts, it’s possible that you may owe little to no taxes on withdrawals. However, if there are unrealized investment gains built up in your after tax investment accounts then you may owe capital gains tax when liquidating positons.
Also note, you may have to pay taxes on a portion of your social security benefit. The amount of your social security benefit that is taxable varies based on your level of income.
Step 6: Spend Down Your Assets
In the final step, you should run long term projections to illustrate the spend down of your assets in retirement. Here are the steps:Example
Start with your annual after tax expense number $60,000
Subtract social security less taxes: ($20,000)
Subtract pension payments less taxes (if applicable): ($10,000)
Annual Expenses Net SS and Pensions: $30,000
In the example above, this individual would need an additional $30,000 after-tax to meet their anticipated annual expenses in Year 1 of retirement. I stress “after-tax” because if all of the retirement assets are in a pre-tax retirement account then they would need to gross up their distributions for taxes to get to the $30,000 after tax. If it is assumed that $40,000 has to be withdrawn from an IRA each year, the 3% inflation rate is applied to the annual expenses, and the life expectancy of this individual is 20 years from the date that they retire, this individual would need to withdrawal $1,074,814 out of their retirement accounts over the next 20 years to meet their income needs.
Step 7: Identify Multiple Solutions
There are often times multiple roads to reach a destination and the same is true when planning for retirement. If you find that you assets are falling short of the amount that is needed to sustain your expenses in retirement, you should work with a knowledgeable financial planner to identify alternative solutions. It may help you to answer questions like:
If I decided to work part-time in retirement how much would I have to earn?
If I downsize my primary residence in retirement how does this impact the overall picture?
If I can’t retire at age 63, what age can I comfortably retire at?
What are the pros and cons of taking social security benefits prior to normal retirement age
I also encourage clients to spend time looking at their annual expenses. If you find that your are cutting it close on income versus expenses in retirement, it's usually easier to cut expenses than it is to create more income in the retirement year.
Michael Ruger
About Michael……...
Hi, I’m Michael Ruger. I’m the managing partner of Greenbush Financial Group and the creator of the nationally recognized Money Smart Board blog . I created the blog because there are a lot of events in life that require important financial decisions. The goal is to help our readers avoid big financial missteps, discover financial solutions that they were not aware of, and to optimize their financial future.