
Are The New Trade Tariffs Good Or Bad For The Stock Market?
US businesses often imports their manufactured goods from China. This is because the cost of manufacturing products is much lower than in other places so they want to take advantage of this. The government makes money off this relationship by imposing tariffs on certain products coming into the US. President Trump announced on March 8, 2018

US businesses often imports their manufactured goods from China. This is because the cost of manufacturing products is much lower than in other places so they want to take advantage of this. The government makes money off this relationship by imposing tariffs on certain products coming into the US. President Trump announced on March 8, 2018 that the United States will begin imposing a tariff on steel and aluminum imported into the U.S. from countries other than Mexico and Canada. The tariff on steel will be 25% and 10% on aluminum. There are two main questions that we will seek to answer in this article:
What happened the last time the U.S. implemented trade tariffs?
How will the stock market react to the new trade barriers?
What Is A Tariff?
First, let's do a quick recap on what a tariff is. A tariff is a special tax on goods that come into the United States. Tariffs are imposed to make select foreign goods more expensive in an effort to encourage the U.S. consumer to buy more American made goods. For example, if the government puts a 25% tariff on cars that are imported into the U.S., that BMW that was manufactured in Germany and shipped over to the U.S. and sold to you for $70,000 will now cost $87,500 for that same exact car due to the 25% tariff. As a consumer this may cause you not to buy that BMW and instead buy a Corvette that was manufactured in the U.S. and carries a lower price tag.
What Does History Tell Us?
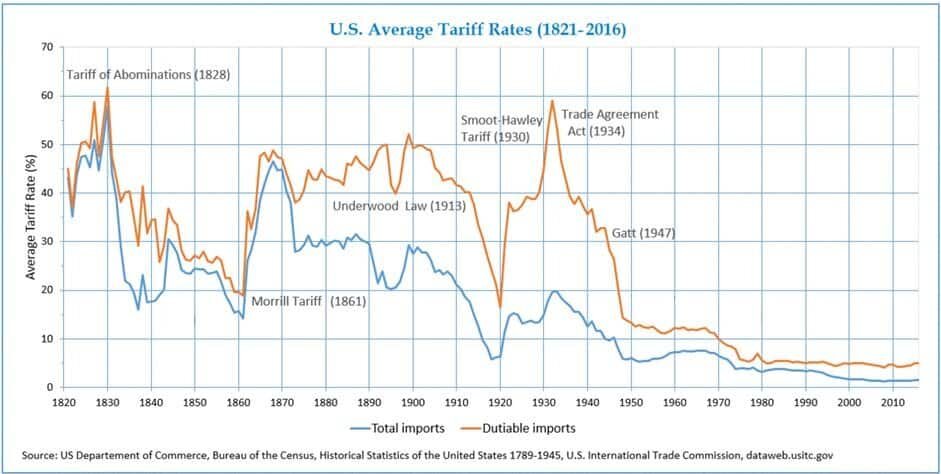
history of tariffs in the US
It’s very clear from this chart that the U.S. has not imposed meaningful tariffs since the early 1900’s. Conclusion, it’s going to be very difficult to predict how these tariffs are going to impact the U.S. economy and global trade. Even though we have some historical references, the world is very different today compared to 1930. The “global economy” did not even really exist back then.
As you can see in the chart, the average import trade tariff in 1930 was about 20%. Since 1975, the average trade tariff on imports has been below 5%. More recently, between 2000 and 2016 the average tariff on imports was below 2%.
History Will Not Be A Useful Guide
As an investment manager, when a big financial event takes place, we start to scour through historical data to determine what happened in the past when a similar event took place. While we have had tariffs implemented in the past, many of those tariffs were implemented for reasons other than the ones that are driving the U.S. trade policy today.
Prior to 1914, tariffs were used primarily to generate revenue for the U.S. government. In 1850, tariffs represented 91% of the government’s total revenue mainly because there was no income tax back then. By 1900 that percentage had dropped to 41%. As many of us are well aware, over time, the main source of revenue for the government has shifted to the receipt of income and payroll taxes with tariff revenue only representing about 2% of the government’s total receipts.
During the Industrial Revolution (1760 – 1840), tariffs were used to protect the new U.S. industries that were in their infancy. Without tariffs it would have been very difficult for these new industries that were just starting in the U.S. colonies to compete with the price of goods coming from Europe. Tariffs were used to boost the domestic demand for steel, wool, and other goods that were being produced in the U.S. colonies. These trade policies helped the new industries get off the ground, expand the workforce, and led to a prosperous century of economic growth.
Today, tariffs are being used for a different reason. To protect our mature industries from the risk of extinction as a result of foreign competition. Since the 1950’s, the global economy has evolved and the trade policies of the U.S. have been largely in support of free trade. While this sounds like a positive approach, free trade policies have taken their toll on a number of industries here in the U.S. such as steel, automobiles, and electronics. Foreign countries like China have access to cheap labor and they are able to produce select goods and services at a much lower cost than here in the United States.
While this a good thing for the U.S. consumer because you can purchase a big screen TV made in China for a lot less than that same TV made in the U.S., there are negative side effects. First and foremost are the U.S. jobs that are lost when a company decides that it can produce the same product for a lot less over in China. We have seen this trend play out over the past 20 or 30 years. Tariffs can help protect some of those U.S. jobs because it makes products purchased from foreign manufactures more expensive and it increases the demand for U.S. goods. The downside to that is the consumer may be asked to pay more for those same products since at the end of the day it costs more to produce those products in the U.S.
In the announcement of the steel and aluminum tariffs yesterday, the White House also acknowledged the national security risk of certain industries facing extinction in the United States. Below is a chart of production of steel in the U.S. from 1970 – 2016.
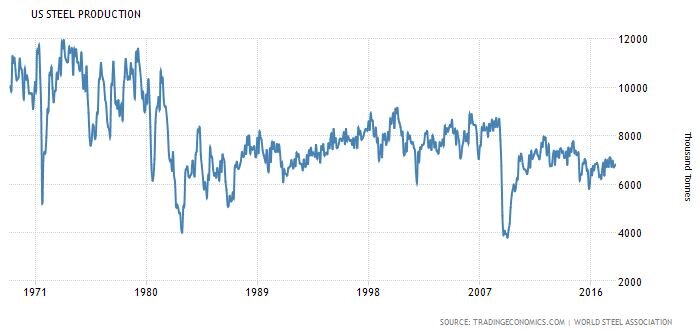
As you can see in the chart, our economy has grown dramatically over this time period but we are producing half the amount of steel in the U.S. that we were 47 years ago. If everything stayed the same, this reduction in the U.S. production of steel would probably continue. It begs the question, what happens 50 years from now if there is a global conflict and we are unable to build tanks, jets, and ships because we import 100% of our steel from China and they decide to shut off the supply? There are definitely certain industries that we will always need to protect here in the U.S. even though they may be “cheaper” to buy somewhere else.
There is also monopoly risk. Once we have to import 100% of a particular good or service, those producers have 100% pricing power over us. While I would be less concerned over TV’s and electronics, I would be more concerned over items like cars, foods, building materials, and other items that many of us consider a necessity to our everyday lives.
Free or Fair?
While we have had “free” trade policies over the past few decades, have they been “fair”? Elon Musk, the CEO of Tesla, recently highlighted that “China isn’t playing fair in the car trade with the U.S.” He goes on to point out that China puts a 25% import tariff on American cars sold to China but the U.S. only has a 2.5% import tariff on cars that are manufactured in China and sold in the U.S.
In response to this, Trump mentioned in his speech that the U.S. will be pursuing “reciprocal” or “mirror” trade policies. Meaning, if a country puts a 25% tariff on U.S. goods imported into their country, the U.S. would put a 25% tariff on those same goods that are imported from their country into the U.S.
Trade Wars
While the reciprocal trade policies seem fair on the surface and it also makes sense to protect industries that are vital to our national security, the greatest risk of transitioning from a “free trade” policy to “protectionism” policy is trade wars. We just put a 25% tariff on all of the steel that is imported from China, how is China going to respond to that? Remember, the U.S. is part of a global economy and trade is important. How important? When you look at the gross revenue of all of the companies that make up the S&P 500 Index, over 50% of their revenue now comes from outside the U.S. If all of a sudden, foreign countries start putting tariffs on U.S. goods sold aboard, that could have a big negative impact on the corporate earnings of our big multinational corporations in the United States. In addition, when you listen to the quarterly earnings calls from companies like Apple, Nike, Pepsi, and Ford, the future growth of those companies are relying heavily on their ability to sell their products to the growing consumer base in the emerging market. Countries like China, India, Russia, and Brazil.
I go back to my initial point, that history will not be a great guide for us here. We have not used tariffs in a very long period of time and the reason why we are using tariffs now is different than it was in the past. Plus the world has changed. There is no clear way to know at this point if these new tariffs are going to help or hurt the U.S. economy over the next year because a lot depends on how these foreign countries respond to the United States moving away from the long standing era of free trade.
Canada & Mexico Exempt
The White House announced yesterday that Canada and Mexico would be exempt from the new tariffs. Why? This is my guess and it's only guess, the U.S. is currently in the process of negotiating the NAFTA terms with Canada and Mexico. NAFTA stands for the North American Free Trade Agreement. Trump has made it clear that if we cannot obtain favorable trade terms, the U.S. will exit the NAFTA agreement. The U.S. may use the recent tariff announcement as a negotiation tool in the talks with Canada and Mexico on NAFTA. "Listen, we gave you an exemption but if you don't give us favorable trade terms, all deals are off."
Coin Flip
While tax reform seems like a clear win for U.S. corporations, only history will tell us whether or not these new trade policies will help or harm the U.S. economy. If we are able to protect more U.S. jobs, protect industries vital to the growth and protection of the U.S., and negotiate better trade deals with our trading partners, we may look back and realize this was the right move at the right time.On the flip side of the coin, if trade wars break out that could lead to a decrease in the demand for U.S. goods around the globe that may cause the U.S. to lose more jobs than it is trying to protect. As a result, that could put downward pressure on corporate earnings and in turn send stock prices lower in the U.S. Only time will tell.

About Michael.........
Hi, I’m Michael Ruger. I’m the managing partner of Greenbush Financial Group and the creator of the nationally recognized Money Smart Board blog . I created the blog because there are a lot of events in life that require important financial decisions. The goal is to help our readers avoid big financial missteps, discover financial solutions that they were not aware of, and to optimize their financial future.


What Does Tax Reform Mean For The Markets In 2018?
2017 ended up being a huge year for the U.S. stock market. The rally in the stock market was unmistakably driven by the anticipated passing of tax reform and Congress delivered. However, the sheer magnitude of the stock market rally has presented investors with a moment of pause and a lot of unanswered questions as we enter into the first quarter

2017 ended up being a huge year for the U.S. stock market. The rally in the stock market was unmistakably driven by the anticipated passing of tax reform and Congress delivered. However, the sheer magnitude of the stock market rally has presented investors with a moment of pause and a lot of unanswered questions as we enter into the first quarter of 2018. The two main questions being:
What does tax reform mean for the markets in 2018?
We are now in the second longest economic expansion of ALL TIME!!! I know what goes up, eventually comes down. Are we overdue for a major correction in the stock market?
Without a crystal ball, no one knows for sure. However, the purpose of this article is to identify indicators in the economy and the financial markets that may help us gauge the direction of the U.S. economy and equity markets as we progress through 2018.
Tax Reform: Uncharted Waters
While tax reform is a welcome friend for corporate America, we have to acknowledge that this also puts us in uncharted waters. Looking back, there has never been a time in history where the U.S. has injected fiscal stimulus (tax reform) into an economy that is already healthy. The last major tax reform was in the early 1980’s when the U.S. economy was trying to dig itself out of the long 1970’s recession.
When the economy is in a recession, the U.S. can either inject fiscal stimulus or monetary stimulus to get the economy growing again. The U.S. used monetary stimulus to dig us out of the Great Recession of 2008 – 2009. They lowered interest rates to basically 0%, pumped cash into the economy in the form of bond buying, and provided a financial back stop for the U.S. banking system.
These economic stimulus tools are similar to the concept of giving a patient in a hospital a shot of adrenaline. If a patient is flat lining, it provides that patient with a huge surge of energy. The patient’s body goes from 0% to 60%+ in under a minute. So what happens when you give someone who is completely healthy a shot of adrenaline? Do they go from 100% to 110%? My point is a healthy patient does not go from 100% to 160%. Both patients get a boost but the boost to the healthy patient is much lower as a percentage of where they started.
While we have never given the U.S. economy an adrenaline shot after a long economic expansion, I think it’s reasonable to apply the same general concept as our two hospital patients. Tax reform may very well lead to another year of positive returns for the stock market in 2018 but I think it’s very important for investors to set a reasonable expectation of return for the U.S. equity markets given the fact that we are injecting growth into an economy that is already at “full employment”.
Not Enough Workers
One of the greatest challenges that the U.S. economy may face in 2018 is a shortage of qualified workers. Prior to tax reform being passed, companies both large and small, have had plenty of job openings but have not been able to find the employees with the skills necessary to fill those positions.
For example, if Apple had 1000 job openings in November 2017 just to meet the current demand for their goods and services but in 2018, due to tax reform, consumers have more money to spend, and the demand for Apple products increases further, Apple may need to find another 2000 employee to meet the increase in demand. They are having trouble now finding the 1000 employees to meet their current demand, how are they going to find another 2000 quick enough in 2018 to meet the increase in demand? If they can’t make the phones, they can’t sell the phones. Fewer sales equals less revenue, which equals less net profit, which may lead to a lower appreciation rate of the stock price. For disclosure purposes, I’m not picking on Apple. I’m just highlighting an issue that may be common among the companies that make up the S&P 500 Index if tax reform leads to a spike in demand in 2018. If Wall Street is expecting accelerated earnings, how are the companies expected to deliver those enhanced earnings without the employees that they need to increase supply?
The unemployment rate in the U.S. is currently 4.1%. You have to go all the way back to the late 1960’s to find an employment rate below 4%. So we are essentially at “full employment”.
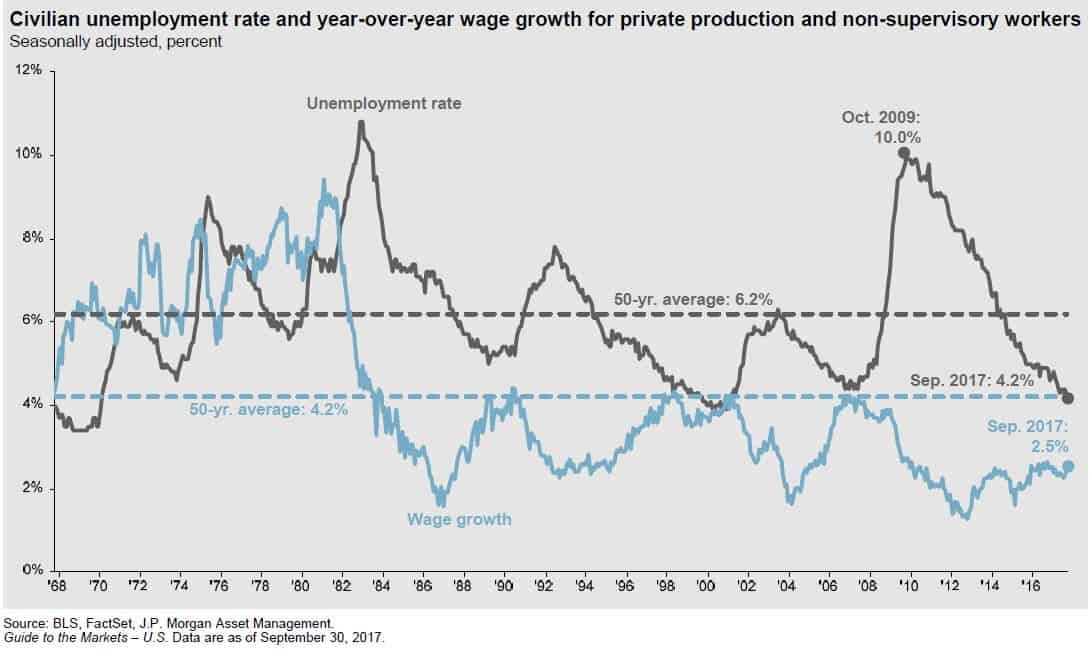
Rising Wages
The blue line in the chart above is also very important. The blue line represents wage growth. This answers the question: "Are people making more for doing the same amount of work?" If you look back historically on the chart, when the unemployment rate was falling, typically wage growth was increasing. It makes sense. When the economy is good and the job market is healthy, companies have to pay their employees more to keep them. Otherwise they will go work for a competitor, who has 10 job openings, and they get paid more. Wage growth is good for employees but it's bad for companies. For companies, employee wages are usually their largest expense. If you increase wages, you are increasing expenses, which decreases profits. Lower profits typically results in lower stock prices. Companies in 2017 had the luxury of strong demand but limited wage growth. My guess is you will begin to see meaningful wage growth in 2018 as companies see an increase in demand as a result of tax reform and end up having to raise wages to retain and attract employees. This is just another reason why 2018 may be a good year for the stock market but not a great one.
What Fuels GDP Growth?
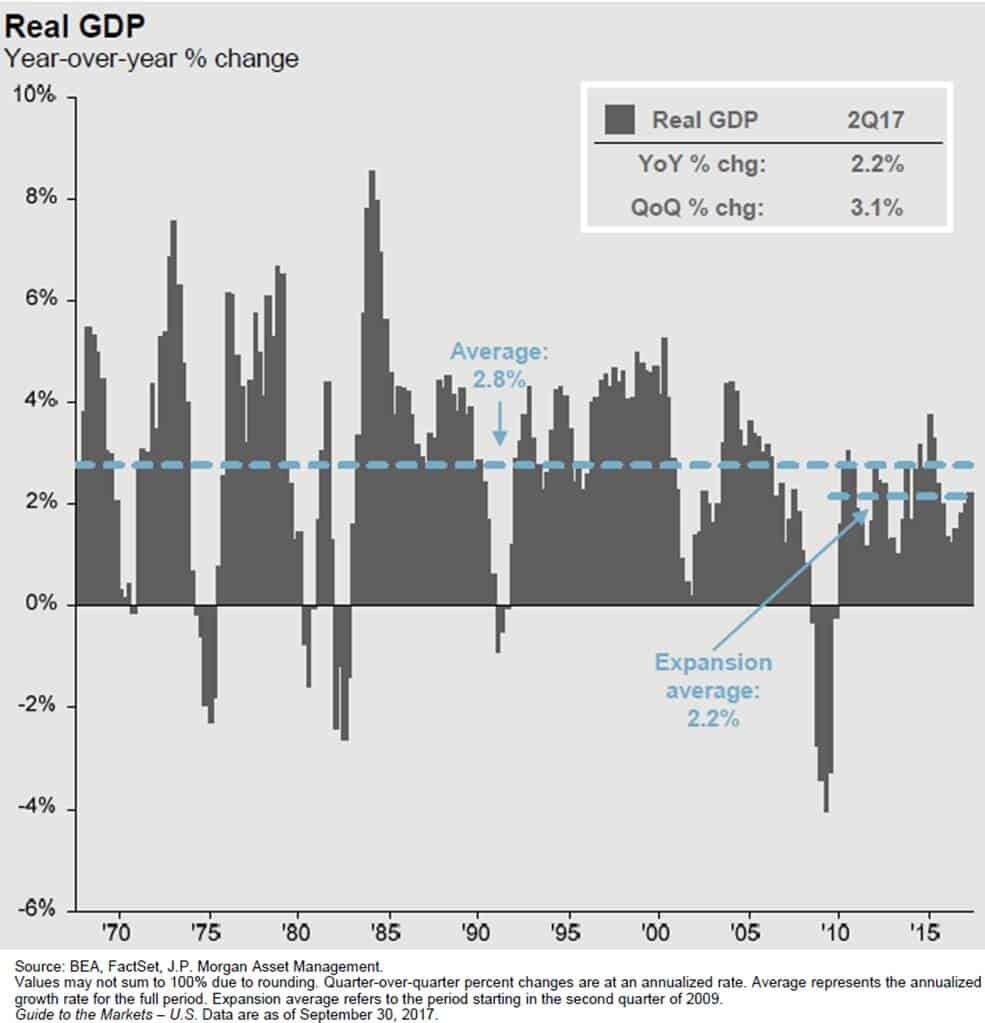
Gross Domestic Product ("GDP") is the economic indicator that is used to measure how much the U.S. economy produces in a year. It's how we gauge whether our economy is growing or contracting. Since March 2009, the GDP growth rate has averaged about 2.2% per year. This is subpar by historic standards. In most economic expansions, GDP is growing at an annual rate of 4%+.
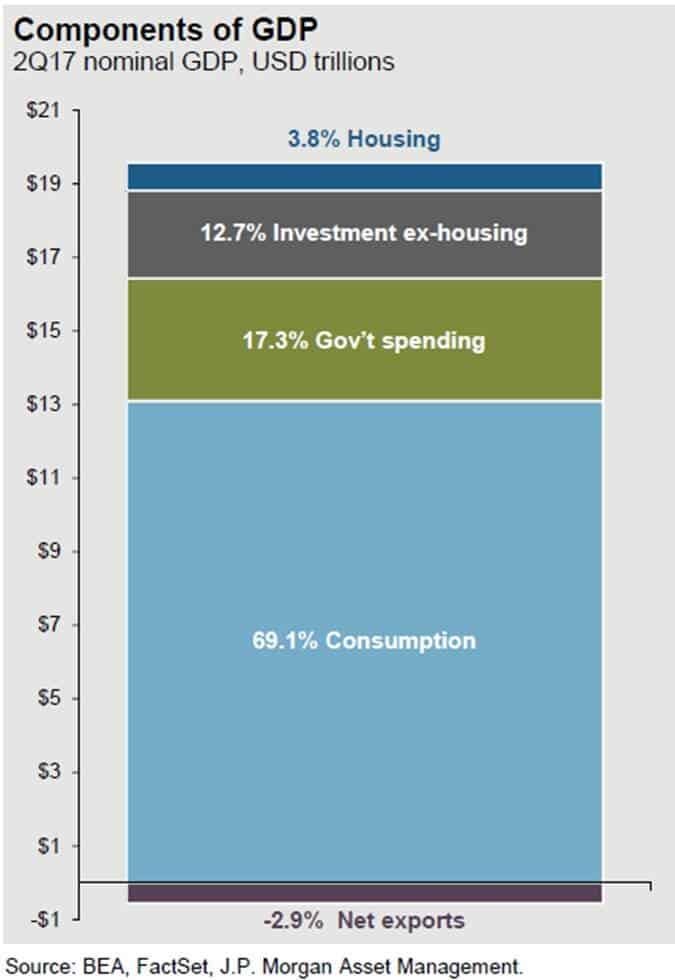
Before we get into what pieces of tax reform may help to increase the GDP growth rate, let us first look at what GDP is made of. Our GDP is comprised of 5 categories (for my fellow econ nerds that assign 4 categories to GDP, we split capital spending into two separate categories):
Consumption or "Consumer Spending" 69.1%
Government Spending (includes defense) 17.3%
Investment (ex-housing) – "Business Spending 12.7%
Housing 3.8%
Net Exports -2.9%
Consumer Spending (+)
Consumer spending which makes up 69.1% of our GDP should increase as a result of tax reform in 2018. In general, if people have more discretionary income, they will spend all or a portion of it. Tax reform will lower the tax bill, for not all, but many U.S. households, increasing their disposable income. Also, if we see an increase in wage growth in 2018, people will be taking home more in their paychecks, allowing them to spend more.
Dr James Kelly, the chief economist of JP Morgan, made a very interesting observation about the evolution of the tax bill. When the tax bills were in their proposed state, one for the Senate and a separate bill for the House, each bill to stay under the $1.5 Trillion 10 year debt cap reduced taxes by about $150 Billion dollars per year. 50% of the annual tax reduction was going to businesses with the other 50% going to individual tax payers.
In order to get the bill passed before the end of the year, Congress was forced to shift a larger proportion of the $150 billion in tax brakes per year to individual taxpayers. In the tax bill’s final form, Dr Kelly estimated that approximately 75% of the tax reductions were now being retained by individual taxpayers with only 25% going to businesses. With a larger proportion of the tax breaks going to individual taxpayers that could increase the amount of discretionary income available to the U.S. consumer.
Government Spending (Push)
The anticipated increase in government spending really stems from the Trump agenda that has been communicated. One of the items that he campaigned on was increasing government spending on infrastructure. At this point we do not have many details as to when the infrastructure spending will begin or how much will be spent. Whatever ends up happening, we are not forecasting a dramatic increase or decrease in government spending in 2018.
Investment - Business Spending (+)
Even though business spending only represents 12.7% of our GDP, we could see a sizable increase in spending by businesses in 2018 for the following reasons:
Corporate tax rate is reduced from 35% to 21%
The repatriation tax will allow companies to bring cash back from overseas at a low tax rate
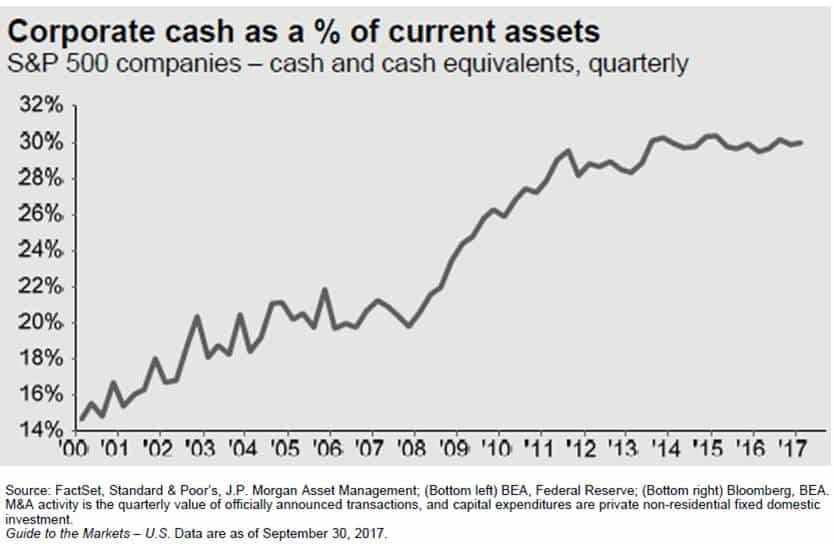
Prior to tax reform, companies already had historically high levels of cash on their balance sheet. What are they going to do with more cash? (See the chart below)
If having more cash was not a large enough incentive by itself for companies to spend money, the new tax rules allowing immediate expensing of the full cost of most assets purchased for the next five years should be. Under the current tax rules, when a business purchases a new piece of equipment, a fleet of trucks, office furniture, whatever it is, the IRS does not allow them to deduct 100% of purchase price in the year that they buy it. They have to follow a "depreciation schedule" and they can only realize a piece of that expense each year. The current tax rules put companies at a tax disadvantage because companies are always trying to shelter as much income as possible from taxation. If Company XYZ buys a piece of equipment that cost $1,000,000, the IRS may require Company XYZ to depreciate that expense over a 10 year period. Meaning they can only realize $100,000 in expenses each year over that 10 year period, even though they already paid the full $1,000,000 for that new piece of equipment.Under the new tax reform, if Company XYZ buys that same new piece of equipment for $1,000,000, they can deduct the full $1,000,000 expense against their income in 2018. Whoa!!! That's huge!! Yes it is and it's a big incentive for companies to spend money over the next five years.
Housing & Net Exports (Push)
We do not expect any significant change from either of these two categories and they represent the smallest portion of our total GDP.
Watch GDP In 2018
The GDP growth rate in 2018 may give us the first indication as to how many "extra innings" we have left in this already long bull market rally. If we do not see a meaningful acceleration in the annual growth rate of GDP above its 2.2% average rate, the rally could be very short lived. On the flip side, if due to tax reform consumer spending and business spending leaps forward in 2018 and 2019, we may be witnessing the longest economic expansion of all time. Time will tell.
Share Buybacks
You will undoubtedly hear a lot about “Share Buybacks” in 2018. Remember, U.S. corporations will most likely have piles of cash on their balance sheets. Instead of spending that money on hiring new employees, buying new equipment, or building a new plant, what else might they do with the cash? The answer, share buybacks.
If a public company like Nike has extra cash, they can go into the market, purchase their own stock, and then get rid of those outstanding shares. Basically it increases the earnings per share for the remaining shareholders.
Example: Let’s assume there are only 4 shares of Nike owned by 4 different people and Nike is worth $100,000. That means that each shareholder is entitled to 25% of that $100,000 or $25,000 each. Now because of tax reform, Nike has $50,000 of extra cash just sitting in its coffers that it otherwise would have paid to the government in taxes. Nike can go into the market with $50,000, purchase 2 shares back from 2 of the shareholders (assuming they would be willing to sell), and then “retire” those two outstanding shares. After that is done, there are 2 outstanding shares remaining but the value of Nike did not change. So the two remaining shareholders, without paying anything extra, now own 50% of Nike, and their shares are worth $50,000 each.
Share buyback may push stock prices higher from a simple math standpoint. If the formula is the value of the company divided by the number of shares outstanding, the fewer shares there are, assuming the value of the company stays the same, the price per share will go up. The incentive for these share buybacks will most likely be there in 2018. Not only will companies have the cash but share buybacks are a way that public companies can reward their current shareholders..
Is The Stock Market Too Expensive?
The P/E ratio of the S&P 500 Index is another barometer that investors will need to keep a close eye on in 2018. P/E ratios help us to answer the questions: “Is the stock market cheap, fairly valued, or expensive at this point?” The “Forward P/E Ratio” divides the price of a stock by the estimated future 12 months of earnings. The average Forward P/E ratio for the S&P 500 Index between December 1989 – September 30, 2017 was 16.0. As of December 22, 2017, the Forward P/E ratio of the S&P 500 Index is 19.99. In other words, it’s running at 25% above its 25 year historic average. See the chart below:
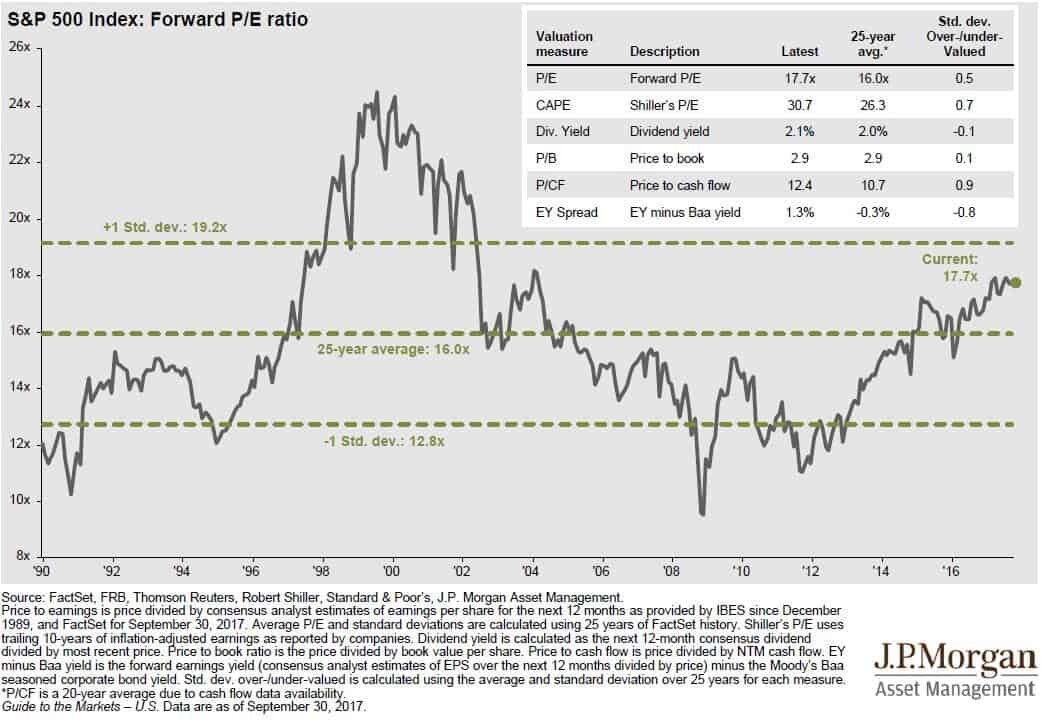
Conclusion, the U.S. stock market is not “cheap” and it’s a stretch to even classify it as “fairly valued”. I think we are well into what I would consider “expensive territory”. What does that mean for investors? You have to stay on your toes!!
Now, we have an anomaly in the mix with tax reform and history does not speak to how this could play out. If tax reform leads to an acceleration in corporate earnings, that in turn could slow the steady climb in the P/E ratio of the S&P 500 because earnings are the denominator in the formula. If stock prices and earnings are accelerating at the same pace, the stock market can go up without a further acceleration of the P/E ratio. Thus, keeping the stock market from becoming more overpriced and further increasing the risk of owning stocks in the S&P 500.
Summary
In 2018, investors should keep a close eye on the U.S. GDP growth rate, the level of spending by corporations and consumers, the volume of share buybacks by U.S. companies, and the P/E ratio of the S&P 500 Index.
About Michael.........
Hi, I’m Michael Ruger. I’m the managing partner of Greenbush Financial Group and the creator of the nationally recognized Money Smart Board blog . I created the blog because there are a lot of events in life that require important financial decisions. The goal is to help our readers avoid big financial missteps, discover financial solutions that they were not aware of, and to optimize their financial future.

