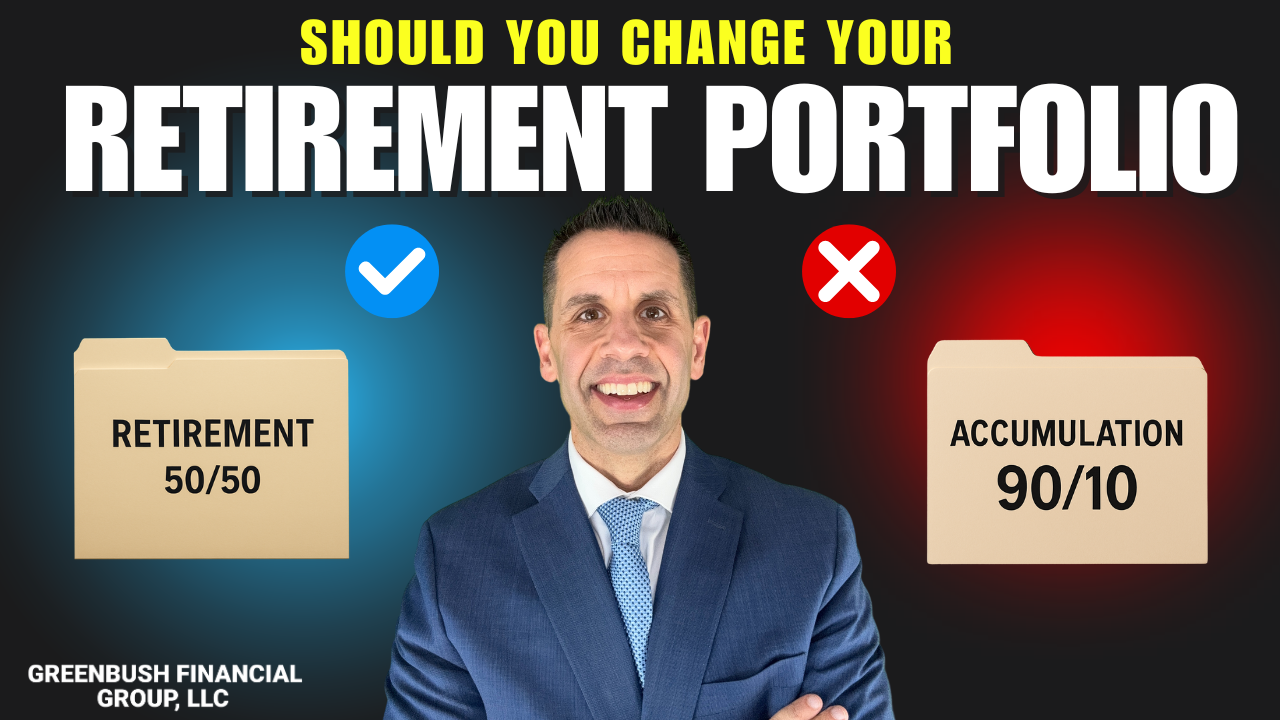
Should Your Investment Strategy Change when You Retire
Should your investment strategy change when you retire? Most people don’t realize how much the answer impacts taxes, income, and long-term security. Retirement isn’t the end of your financial planning—it’s the start of a new phase. Your goals shift from growth to income, and your investment strategy should evolve with them.
Retirement marks a major shift in your financial life: you move from saving and accumulating wealth to spending it. But does that mean your investment strategy should change the moment you stop working?
The answer isn’t a simple yes or no—it depends on your goals, income needs, and risk tolerance. Let’s explore what changes may be necessary, what can stay the same, and how to align your investment approach with the realities of retirement.
1. Accumulation vs. Distribution: A New Financial Phase
During your working years, your investment strategy likely focused on growth—maximizing returns over the long term. For most, in retirement, the focus shifts to income and moderate growth. Your portfolio now needs to:
Support monthly withdrawals
Last for 20–30+ years
Withstand market volatility without derailing your lifestyle
This shift doesn't mean abandoning growth altogether, but it does mean adjusting how you balance risk and reward.
2. Reassess Your Asset Allocation
One of the first things to review in retirement is your asset allocation—how your investments are divided among stocks, bonds, and cash.
A typical pre-retirement portfolio may be 70–100% in equities. But in retirement, many advisors recommend dialing that back to reduce risk.
Example:
If you have a $1 million portfolio:
A 60/40 allocation would mean $600,000 in diversified stock funds and $400,000 in bonds or other fixed-income assets.
A 40/60 allocation might suit someone who is more risk-averse or heavily reliant on portfolio withdrawals.
Mistake Alert:
Some retirees swing too far into conservative territory. While that may feel safe, inflation can quietly erode your purchasing power—especially over a 25- to 30-year retirement.
3. Add an Income Strategy
Now that you’re drawing from your investments, it’s essential to have a plan for generating reliable income and decreasing the level of volatility with your portfolio. This may include:
Dividend-paying stocks or ETFs
Bond holdings or short-term fixed income
The goal is to create stable cash flow while giving your growth assets time to recover from market dips.
4. Be Strategic With Withdrawals
Your withdrawal strategy has a major impact on taxes and portfolio longevity. The order you pull from different account types matters.
Example:
Let’s say you need $80,000/year from your portfolio. You might:
Take $40,000 from a taxable account (capital gains taxed at lower rates)
Pull $20,000 from a Traditional IRA (fully taxable as income)
Social Security $20,000 (up to 85% taxable)
This balanced approach spreads the tax burden, avoids pushing you into a higher bracket, and gives your Roth assets (if you have them) more time to grow.
Common Misstep:
Many retirees default to depleting all of their after-tax assets first, but by not taking withdrawals from their tax-deferred accounts, like Traditional IRAs and 401(k) accounts, they potentially miss out on realizing those taxable distributions at very low tax rates. Having a withdrawal plan that coordinates your social security, Medicare premiums, after-tax accounts, pre-tax accounts, and Roth accounts is key.
5. Stay Diversified—Reduce Volatility In Portfolio
Diversification and reducing volatility are key considerations when entering retirement years. When you take withdrawals from your retirement accounts, the investment returns can vary significantly from those of the accumulation years. Why is that?
When you were working and contributing to your retirement accounts, and the economy hit a recession, since you were not withdrawing any money from your accounts when the market rebounded, you likely regained those losses fairly quickly. But in retirement, when you are taking distributions from the account as the market is moving lower, there is less money in the account when the market begins to rally. As such, your rate of return is more significantly impacted by market volatility when you enter distribution mode.
To reduce volatility in your portfolio, you may need to:
Increase your level of diversification across various asset classes
Keep a large cash reserve on hand to avoid selling stocks in a downturn
Be more proactive about adjusting your investment allocation in response to changing market conditions
6. Don’t Forget About Growth
Retirement could last 30 years or more. That means your portfolio needs to outpace inflation, especially with rising healthcare and long-term care costs.
Even if you’re taking distributions, keeping 30–60% in equities may help ensure your money grows enough to support you in later decades.
Final Thoughts: Don’t “Set It and Forget It”
Your investment strategy should evolve with you. Retirement isn’t a one-time financial event—it’s a new chapter that requires ongoing planning and regular reviews.

About Michael……...
Hi, I’m Michael Ruger. I’m the managing partner of Greenbush Financial Group and the creator of the nationally recognized Money Smart Board blog . I created the blog because there are a lot of events in life that require important financial decisions. The goal is to help our readers avoid big financial missteps, discover financial solutions that they were not aware of, and to optimize their financial future.
Frequently Asked Questions (FAQs):
Should your investment strategy change when you retire?
While the focus shifts from accumulation to income and preservation, your investment approach should evolve based on your goals, risk tolerance, and income needs. Many retirees move toward a more balanced portfolio that supports sustainable withdrawals while still allowing for growth.
What’s the difference between the accumulation and distribution phases?
During the accumulation phase (your working years), the goal is to grow wealth through regular contributions and long-term compounding. In the distribution phase (retirement), you rely on your savings for income, so the emphasis shifts to generating steady cash flow and managing risk.
How should retirees adjust their asset allocation?
Many retirees move from aggressive stock-heavy portfolios to more balanced allocations—like 60/40 (stocks/bonds) or 40/60—depending on their comfort with risk. However, being too conservative can expose you to inflation risk, which can erode purchasing power over time.
How can you generate income from your investments in retirement?
Common income strategies include using dividend-paying stocks, bonds, or fixed-income funds to provide a steady cash flow. A well-structured income plan helps cover expenses while allowing growth-oriented investments to recover from market downturns.
What’s the best order to withdraw funds from retirement accounts?
Strategic withdrawals can help minimize taxes and extend portfolio longevity. The right order depends on your income, Social Security, and Medicare situation.
Why is diversification so important in retirement?
Diversification can reduce portfolio volatility—critical during retirement, when you’re withdrawing funds. Selling assets during a market downturn can permanently harm portfolio growth. Diversifying across asset classes and maintaining a cash buffer may help reduce the impact of market volatility.
Should retirees still invest in stocks?
In most cases, yes. Even in retirement, equities are important for long-term growth and inflation protection. With retirees living longer, it’s not uncommon for retirees to maintain investment accounts for 15+ years into retirement.
How often should retirees review their investment strategy?
At least once a year—or after major life or market changes. Retirement isn’t static, and your investment strategy should adjust to reflect evolving income needs, health costs, tax law updates, and market conditions.
What’s the most common mistake retirees make?
Becoming too conservative too soon. Avoiding market exposure entirely can limit growth and increase the risk of outliving your savings. A balanced approach that manages volatility while maintaining some growth potential is ideal in most situations.


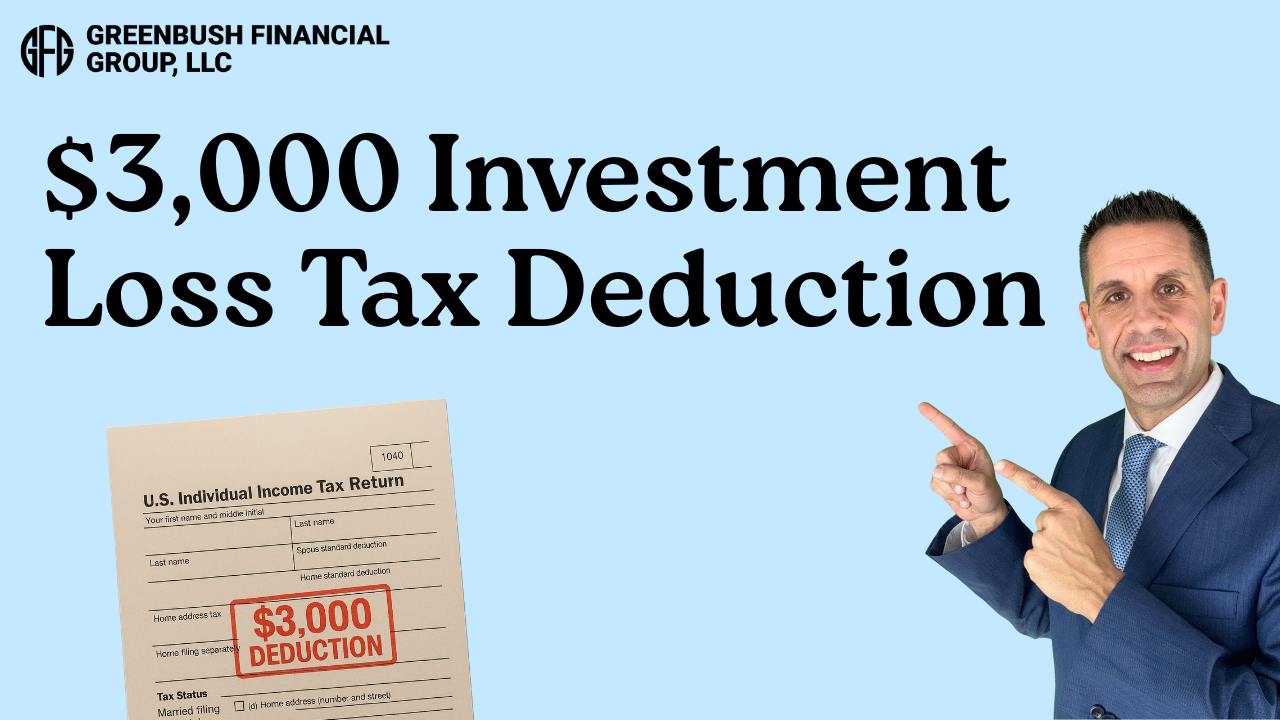
Understanding the $3,000 Investment Loss Annual Tax Deduction
Each year, the IRS allows a tax deduction for investment losses that can be used to offset earned income. However, it’s a use-it-or-lose-it tax deduction, meaning if you fail to realize losses in your investment accounts by December 31st, you could forfeit a valuable tax deduction.
Each year, the IRS allows a tax deduction for investment losses that can be used to offset earned income. However, it’s a use-it-or-lose-it tax deduction, meaning if you fail to realize losses in your investment accounts by December 31st, you could forfeit a valuable tax deduction. In this article, we are going to cover:
Investment loss deduction limit
Single filer versus Joint filer
Short-term vs Long-term losses offset
Carryforward loss rules
Wash sale rules
$3,000 Investment Loss Deduction
Each year, the IRS allows both single filers and joint filers to deduct $3,000 worth of investment losses against their ordinary income. Usually, this is not allowed because investment gains and losses are considered “passive income”, while W-2 income or self-employment income is considered “earned income.” In most cases, gains and losses on the passive side of the fence do not normally offset income on the earned side of the fence. This $3,000 annual deduction for investment losses is the exception to the rule.
Realized Losses In Investment Accounts
To capture the tax deduction for the investment losses, the losses have to be “realized losses,” meaning you actually sold the investment at a loss, which turned the loss from an “unrealized” loss into a “realized loss” by December 31st. In addition, the realized loss has to take place in a taxable investment account like an individual account, a joint account, or a revocable trust account. Accounts such as an IRA, 401(k), or SEP IRA are tax-deferred accounts, so they do not generate realized gains or losses.
Long-term versus Short-term Losses
The realized losses can be either short-term or long-term, or a combination of both, leading up to the $3,000 annual loss limit. But if you have the option, it’s often more beneficial from a pure tax standpoint to realize a long-term loss, and I’ll explain why.
In the investment world, short-term gains are taxed as ordinary income and long-term gains are taxed at preferential long-term capital gains rates that range from 0% - 23.8% (including the Medicare surcharge). But when you realize investment losses, long-term losses cannot offset short-term gains. Only short-term losses can offset short-term gains.
By realizing $3,000 in long-term capital losses, you can use that amount to offset $3,000 of earned income—taxed at higher ordinary income rates—rather than just offsetting long-term capital gains, which are already taxed at lower preferential rates. Potentially saving you more tax dollars.
Loss Carryforward Rules
But what if your realized losses are more than $3,000 for the year? No worries, both short-term and long-term losses are eligible for “carryforward” which means you can keep carrying forward those losses into future tax years until you have additional realized investment gains to eat up the loss, or you can continue to take the $3,000 per year investment loss deduction until your carryforward loss has been used up.
Single Filer versus Joint Filer
Whether you are a single filer or a joint filer, the total annual investment losses deduction is $3,000. It does not double because you file married filing jointly - even though technically each spouse could have their own individual brokerage account with $3,000 in realized losses. However, if you file “married filing separately,” the annual deduction is limited to $1,500.
Wash Sale Rule
When you intentionally sell investments for purposes of capturing this $3,000 annual loss deduction, you have to be careful of the 30-Day Wash Sale Rule, which states that if you sell an investment at a loss and then buy that same investment or a “substantially identical security” back within 30 days of the sale, it prevents the investor from taking deduction for the realized loss.
About Michael……...
Hi, I’m Michael Ruger. I’m the managing partner of Greenbush Financial Group and the creator of the nationally recognized Money Smart Board blog . I created the blog because there are a lot of events in life that require important financial decisions. The goal is to help our readers avoid big financial missteps, discover financial solutions that they were not aware of, and to optimize their financial future.
Frequently Asked Questions (FAQs):
What is the IRS investment loss deduction limit?
The IRS allows taxpayers to deduct up to $3,000 of realized investment losses ($1,500 if married filing separately) against ordinary income each year. This deduction applies only to losses in taxable investment accounts and must be realized by December 31st to count for that tax year.
What counts as a “realized” investment loss?
A loss is realized when you sell an investment for less than its purchase price. Unrealized losses—investments that have declined in value but haven’t been sold—do not qualify for the deduction. Losses must occur in taxable accounts, not tax-deferred ones like IRAs or 401(k)s.
How do short-term and long-term losses differ for tax purposes?
Short-term losses offset short-term gains, while long-term losses offset long-term gains. However, up to $3,000 of net long-term losses can also offset ordinary income, which is taxed at higher rates. This can provide a greater tax benefit than simply offsetting lower-taxed long-term gains.
What happens if I have more than $3,000 in investment losses?
Losses that exceed the $3,000 annual limit can be carried forward indefinitely to future tax years. These carryforward losses can offset future investment gains or continue to reduce ordinary income by up to $3,000 each year until they are fully used.
Does the $3,000 investment loss deduction double for married couples?
No. The deduction limit is $3,000 per tax return, whether you file as single or married filing jointly. For those filing separately, the limit is reduced to $1,500 per person.
What is the wash sale rule and how does it affect loss deductions?
The IRS wash sale rule disallows a deduction if you sell an investment at a loss and repurchase the same or a substantially identical security within 30 days before or after the sale. To preserve the deduction, you must wait at least 31 days before buying the same investment again.
Why is it important to realize losses before year-end?
The investment loss deduction follows a “use it or lose it” rule — losses must be realized before December 31st to count for that year’s tax filing. Missing the deadline means forfeiting the potential $3,000 deduction for that tax year.

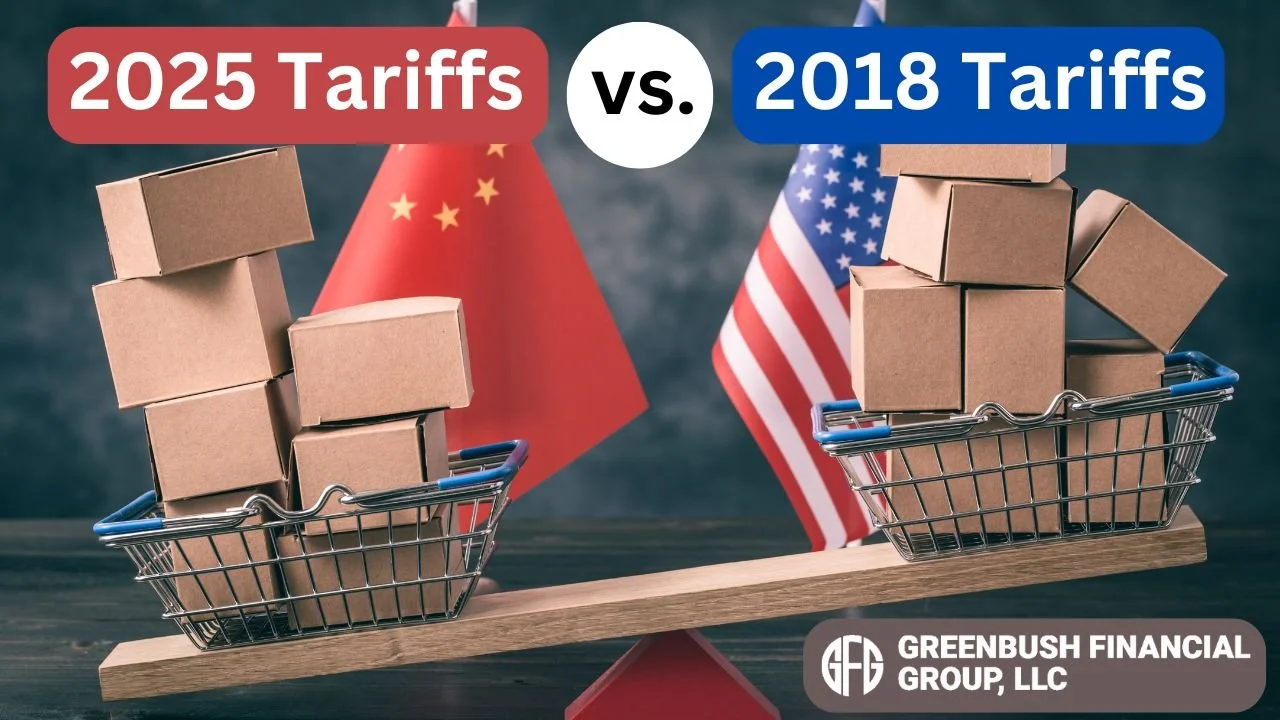
Trump Tariffs 2025 versus Trump Tariffs 2017 to 2020: The Stock Market Reaction
President Trump just announced tariffs against Canada, Mexico, and China that will go into effect this week, which has sent the stock market sharply lower. I have received multiple emails from clients over the past 24 hours, all asking the same question:
“With the Trump tariffs that were just announced, should we be going to cash?”
President Trump just announced tariffs against Canada, Mexico, and China that will go into effect this week, which has sent the stock market sharply lower. I have received multiple emails from clients over the past 24 hours, many asking the same question:
“With the Trump tariffs that were just announced, should we be going to cash?”
Investors have to remember that we have seen Trump’s tariff playbook during his first term as president between 2017 and 2020, but investors' memories are short, and they forget how the stock market reacted to tariffs during his first term. While history does not always repeat itself, today we are going to look back on how the stock market reacted to the Trump tariffs during his first term, how those tariffs compare in magnitude to new tariffs that were just announced, and what changes investors should be making to their investment portfolio.
Trump Tariffs 2017 – 2020
During Trump’s first term as president, he introduced multiple rounds of tariffs, including the tariffs in 2018 on solar panels, washing machines, steel, and aluminum. The tariffs were levied against Canada, Mexico, and the European Union. Throughout his first term, he also escalated tariffs against China, which led to the news headlines of the trade war during his first four years in office.
How did the U.S. stock market react to these tariff announcements? Similar to today, not good. There were sharp selloffs in the stock market in the days following each tariff announcement, but here were the returns for the S&P 500 Index during Trump’s first term in office:
2017: 21.9%
2018: -4.41%
2019: 31.74%
2020: 18.38%
If we are looking to history as a guide, the first round of Trump tariffs created heightened levels of volatility in the markets, financially harmed specific industries in the U.S., and raised prices on various goods and services throughout the US economy. In the end, despite all of the negative press about the tariffs and trade wars, the U.S. stock market posted solid gains in 3 of the 4 years during Trumps first term as president.
The Trump Tariffs Are Larger This Time
However, we also have to acknowledge the difference between the tariffs that were announced in Trump’s first term and the tariffs that were just announced on February 2, 2025. The tariffs that Trump just announced are dramatically larger than the tariffs that we imposed during his first term, which could translate to a larger impact on the U.S. economy and higher prices. During his first term, Trump was very strategic as to which types of goods would be hit with the tariffs, but the latest round of tariffs is a 25% tariff on ALL goods from Canada and Mexico (with the exception of oil) and a 10% tariff on goods coming from China.
Negotiating Tool
Trump historically has used tariffs as a negotiating tool. During his first term, there were multiple rounds of delays in the tariffs being implemented as trade terms were negotiated; that could happen again. Even if the tariff is implemented this week, it’s tough to estimate how long those tariffs will stay in place, if they will be reduced or increased in coming months, and since they are so widespread this time, which industries in the US will get hit the hardest in this new round of tariffs.
U.S. Unfair Advantage in the Tariff Game
While the trade war / tariff game hurts all countries involved because it ultimately drives prices higher on specific goods and services, investors have to acknowledge the advantage that the United States has over other countries when tariffs are imposed. The U.S……by FAR…..is the largest consumer economy in the WORLD, so when we put tariffs on goods coming into our country, the US consumer historically will begin to shift their buying habits to lower-cost goods or buy less of those higher-cost items.
While the US consumer feels some pain from the impact of higher costs on the imported goods being tariffed, the pain is 3x or 5x for the country that tariffs are being imposed on because it’s immediately impacting their sales in the largest consumer economy in the world. This is why Trump has identified tariffs as such a powerful negotiating tool, even if the action that the president is trying to resolve has nothing to do with trade.
Investor Action
While the knee-jerk reaction to the tariff announcement may be to run for the hills, in our opinion, it’s too soon to make a dramatic shift in investment strategy given the opposing forces of the possible outcomes to the stock market beyond the initial reaction from the stock market. On the positive side of the argument, the stock market reacted similarly to the tariff announcements during his first term but still produced sizable gains throughout that four-year period. We don’t know how long these tariffs may be in place, they may not be permanent, or they may be reduced as negotiations progress. Third, the U.S. economy is healthy right now and may be able to absorb some of the negative impact of short-term price increases from the tariffs.
On the other side of the argument, the tariffs are much larger this time compared to Trump’s first term so it could have a larger negative impact. Also, the tariffs this round are broader versus the more surgical approach that he took during his first term, which could negatively impact more businesses in the US than it did the first time. Third, the retaliatory tariffs by Canada, Mexico, and China could be larger this time, which again, could have a larger negative impact on the U.S. economy compared to the 2017 – 2020 time frame.
The word “could” is used a lot in this article because the tariffs were just announced, and there are so many outcomes that could unfold in the coming months. When counseling clients on asset allocation, we find it prudent to hold off on making dramatic changes to the investment strategy until the path forward becomes clearer, even though it’s very tempting to want to react immediately to the events that trigger market sell-offs.
About Michael……...
Hi, I’m Michael Ruger. I’m the managing partner of Greenbush Financial Group and the creator of the nationally recognized Money Smart Board blog . I created the blog because there are a lot of events in life that require important financial decisions. The goal is to help our readers avoid big financial missteps, discover financial solutions that they were not aware of, and to optimize their financial future.
Frequently Asked Questions (FAQs):
What tariffs did President Trump announce in February 2025?
On February 2, 2025, President Trump announced new tariffs against Canada, Mexico, and China that will take effect immediately. The tariffs include a 25% tariff on all goods from Canada and Mexico (except oil) and a 10% tariff on goods from China.
Why did the stock market drop after the tariff announcement?
Markets sold off sharply following the announcement because tariffs generally increase costs for businesses and consumers, which can lead to lower corporate profits and slower economic growth. Historically, markets have reacted negatively in the short term to new tariffs or trade restrictions.
Should investors move to cash because of the new tariffs?
It may be too soon to make drastic portfolio changes. During Trump’s first term (2017–2020), similar tariff announcements caused short-term volatility, but the S&P 500 still gained strongly in three of those four years. Investors should remain focused on data, diversification, and long-term objectives rather than reacting immediately to headlines.
How do these new tariffs compare to the tariffs from Trump’s first term?
The 2025 tariffs are much broader and larger than those imposed during Trump’s first term. The earlier tariffs targeted specific products such as steel, aluminum, and solar panels, while the new tariffs apply across nearly all imports from Canada and Mexico, and all goods from China.
What is Trump’s strategy behind using tariffs?
President Trump often uses tariffs as a negotiating tool to pressure trading partners into reaching more favorable agreements with the United States. In the past, tariffs were sometimes delayed, reduced, or eliminated as trade deals were negotiated.
Why does the U.S. have an advantage in trade disputes?
The U.S. is the largest consumer economy in the world, meaning other countries rely heavily on selling goods to American consumers. While tariffs can raise prices in the U.S., they often cause much greater economic pain for the exporting countries whose access to the U.S. market is restricted.
What should investors expect in the short term?
Short-term volatility is likely as markets adjust to the uncertainty surrounding the tariffs and potential retaliatory actions from other countries. Investors should monitor updates on trade negotiations and watch key indicators such as inflation, consumer spending, and corporate earnings.
Could the tariffs eventually be rolled back or delayed?
Yes. In the past, Trump has used tariff announcements as leverage in negotiations and has paused or reduced tariffs once trade agreements were reached. The duration and scope of the current tariffs may change depending on how trade discussions progress in the coming weeks.
What actions should investors consider now?
For most investors, the best course of action is to stay disciplined and avoid emotional reactions. Broad diversification, periodic rebalancing, and patience often outperform attempts to time the market during politically driven volatility. It may be wise to reassess portfolio exposure once more clarity emerges on how long the tariffs will remain in place.
Surrendering an Annuity: Beware of Taxes and Surrender Fees
There are many reasons why individuals decide to surrender their annuities. Unfortunately, one of the most common reasons that we see is when individuals realize that they were sold the annuity by a broker and that annuity investment was either not in their best interest or they discover that there are other investment solutions that will better meet the investment objectives. This situation can often lead to individuals making the tough decision to cut their losses and surrender the annuity. But before surrendering their annuity, it’s important for investors to understand the questions to ask the annuity company about the surrender fees and potential tax liability before making e the final decision to end their annuity contract.

There are many reasons why individuals decide to surrender their annuities. Unfortunately, one of the most common reasons that we see is that individuals realize they were sold the annuity by a broker that was either not in their best interest, or they discover that there are other investment solutions that will better meet their investment objectives. This situation can often lead to individuals making the tough decision to cut their losses and surrender the annuity. But before surrendering their annuity, it’s important for investors to understand the questions to ask the annuity company about the surrender fees and potential tax liability before making the final decision to end their annuity contract.
Surrender Fee Schedule
Most annuities have what are called “surrender fees,” which are fees that are charged against the account balance in the annuity if the contract is terminated within a specific number of years. The surrender fee schedule varies greatly from annuity to annuity. Some have a 5-year surrender schedule, others have a 7-year surrender schedule, and some have 8+ year surrender fees. Typically, the amount of the surrender fees decreases over time, but the fees can be very high within the first few years of obtaining the annuity contract.
For example, an annuity may have a 7-year surrender fee schedule that is as follows:
Year 1: 8%
Year 2: 7%
Year 3: 6%
Year 4: 5%
Year 5: 4%
Year 6: 3%
Year 7: 3%
Year 8+: 0%
If you purchased an annuity with this surrender fee schedule and two years after purchasing the annuity you realize it was not the optimal investment solution for you, you would incur a 7% surrender fee. If your annuity had a $100,000 value, the annuity company would assess a $7,000 surrender fee when you cancel your contract and move your account.
When It Makes Sense To Pay The Surrender Fee
In some cases, it may make financial sense to pay the surrender fee to get rid of the annuity and just move your money into a more optimal investment solution. If a client has had an annuity for 6 years and they would only incur a 3% surrender fee to cancel the annuity, it may make sense to pay the 3% surrender fee as opposed to waiting 2 more years to surrender the annuity contract without a surrender fee. For example, if the annuity contract is only expected to produce a 4% rate of return over the next year, but they have another investment solution that is expected to produce an 8%+ rate of return over that same one-year period, it may make sense to just surrender the annuity and pay the 3% surrender fee, so they can start earning those higher rates of return sooner, which essentially more than covers the surrender fee that they paid to the annuity company.
Potential Tax Liability Associated with Annuity Surrender
An investor may or may not incur a tax liability when they surrender their annuity contract. Assuming the annuity is a non-qualified annuity, if the cash surrender value is not more than an investor's original investment, then there would not be a tax liability associated with the surrender process because the annuity contract did not create any “gain” in value for the investor. However, if the cash surrender value is greater than the initial investment in the contract, then the investors would trigger a realized gain when they surrender the contract, which is taxed at an ordinary income tax rate. Annuity investments do not receive long-term capital gain preferential tax treatment for contacts held for more than 12 months like stocks and other investments held in brokerage accounts. The gains are always taxed as ordinary income rates because it’s technically an insurance contract.
Not all annuity companies list your total “cost basis” on your statement. Often, we advise clients to call the annuity company to obtain their cost basis in the policy and have the annuity company tell them whether or not there would be a tax liability if they surrendered the annuity contract. You can call the annuity company directly; you do not need to call the broker that sold you the annuity.
If there is no tax liability associated with surrendering the contract, surrendering the contract can be an easy decision for an investor. However, if there is a large tax liability associated with surrendering an annuity, some tax planning may be required. There are tax strategies associated with surrendering annuities that have unrealized gains, such as if you are close to retirement, you could wait to surrender the annuity until the year that you are fully retired, making the taxable gain potentially subject to a lower tax rate. We have had clients that have surrendered an annuity, incurred a $15,000 taxable gain, and then turned around and contributed up to $23,500 (or $31,000 if age 50+), pre-tax, to their 401(k) account at work, which offset the additional taxable income from the annuity surrender in that tax year.
Is Paying The Surrender Fee and Taxes Worth It?
For investors who face either a surrender fee, taxes, or both when surrendering an annuity contract, the decision of whether or not to surrender the annuity contract comes down to whether or not paying those taxes and/or penalties is worth it, just to get out of that annuity that was not the right fit in the first place. Or maybe it was the right investment when you first purchased it, but now your investment needs have changed, or there is a better investment opportunity elsewhere. If there are no surrender fees and minimal tax liability, the decision can be very easy, but when large surrender fees and/or tax liability exists, additional analysis is often required to determine if delaying the surrender of the annuity contract makes sense.
About Michael……...
Hi, I’m Michael Ruger. I’m the managing partner of Greenbush Financial Group and the creator of the nationally recognized Money Smart Board blog . I created the blog because there are a lot of events in life that require important financial decisions. The goal is to help our readers avoid big financial missteps, discover financial solutions that they were not aware of, and to optimize their financial future.
Frequently Asked Questions (FAQs):
Why do investors surrender their annuities?
Many investors choose to surrender an annuity when they realize it no longer fits their financial goals or when they discover better investment alternatives. In some cases, annuities are sold by brokers under less-than-ideal circumstances, prompting investors to cut their losses and move to more flexible investment options.
What are annuity surrender fees?
Surrender fees are charges imposed by the insurance company if you cancel (surrender) your annuity within a certain period—typically 5 to 8 years after purchase. These fees decline over time. For example, a 7-year surrender schedule might charge 8% in the first year, 7% in the second, and gradually drop to 0% after year seven.
When might it make sense to pay the surrender fee?
It can make sense to pay a surrender fee if switching to a new investment is expected to produce significantly higher returns. For example, if your annuity is projected to earn 4% annually but another investment could earn 8%, paying a small surrender fee (like 3%) could be worthwhile because the higher returns may quickly offset the cost of surrendering the contract.
What taxes apply when you surrender an annuity?
If your annuity’s cash value exceeds your original investment (cost basis), the gain is taxable as ordinary income in the year you surrender it. Unlike stocks or mutual funds, annuities do not qualify for long-term capital gains tax treatment. However, if your cash surrender value is less than or equal to your original investment, no tax will be due.
How can you find out your annuity’s cost basis?
Your annuity company can tell you your exact cost basis and whether surrendering the annuity would trigger taxable gains. You can contact the insurance company directly—there’s no need to go through the broker who sold you the annuity.
Are there tax strategies for surrendering an annuity with gains?
Yes. Timing matters. For instance, if you’re close to retirement, surrendering the annuity after you stop working could mean the taxable gain falls into a lower tax bracket. Another strategy is to offset taxable gains by making a pre-tax 401(k) or IRA contribution in the same year.
How do you decide if paying surrender fees or taxes is worth it?
The decision depends on your time horizon, expected investment returns, and tax impact. If surrender fees are low and tax exposure is minimal, surrendering may be the best move. If both are high, it might make sense to wait or consult a financial planner to explore tax-efficient options.

How Will The Fed’s 50bps Rate Cut Impact The Economy In Coming Months?
The Fed cut the Federal Funds Rate by 0.50% on September 18, 2024 which is not only the first rate cut since the Fed started raising rates in March 2022 but it was also a larger rate cut than the census expected. The consensus going into the Fed meeting was the Fed would cut rates by 0.25% and they doubled it. This is what the bigger Fed rate cut historically means for the economy
The Fed cut the Federal Funds Rate by 0.50% on September 18, 2024, which is not only the first rate cut since the Fed started raising rates in March 2022, but it’s also a larger rate cut than most economists predicted. The consensus going into the Fed meeting was that the Fed would cut rates by 0.25%, and they doubled it. In this article, we will cover:
How is the stock market likely to respond to this larger than anticipated rate cut?
How is this rate cut expected to impact the economy in the coming months?
Do we expect this rate cut trend to continue in the coming months?
Recession trends when the Fed begins cutting rates.
How Rate Cuts Impact The Economy
When the Fed decreases the Federal Funds Rate, it is essentially breathing oxygen back into the economy. Even the anticipation of the Fed lowering rates has an impact on the interest rate on car loans, mortgages, and commercial lending. As interest rates move lower, it usually stimulates the economy by making financing more attractive to the U.S. consumer. For example, a new homebuyer may not be able to afford a new house if it’s financed with a 30-year mortgage with a 7.5% interest rate, but as interest rates move lower, to say 6%, it lowers the monthly mortgage payments, putting the house in reach for that new homebuyer.
6 Month Delay
The reason why we support the Fed making a bigger rate cut now is the inflation rate has moved into the Feds 2% to 3% range, the job market has been cooling over the past few months, evident in the unemployment rate rising, and when the Fed cuts rates, it takes 6 to 9 months before that rate cut translates to more economic activity because it takes time for the impact of those lower interest rates to work their way through the economy.
Historically, The Fed Waits Too Long To Cut Rates
It’s reassuring to see the Fed cutting rates before we see significant pain in the U.S. economy because that is not the typical Fed pattern. Historically, the Fed waits too long to begin cutting rates, and only after a recession has arrived from rates being held high for too long does the Fed begin cutting rates. However, then there is a 6-month lag before the economy feels the benefits of those rate cuts and it’s usually an ugly 6 months for the equity market. The fact that the Fed is cutting rates now and by a larger amount than the consensus expects increases the chances that a soft landing will be delivered to the economy coming out of this rate hike cycle.
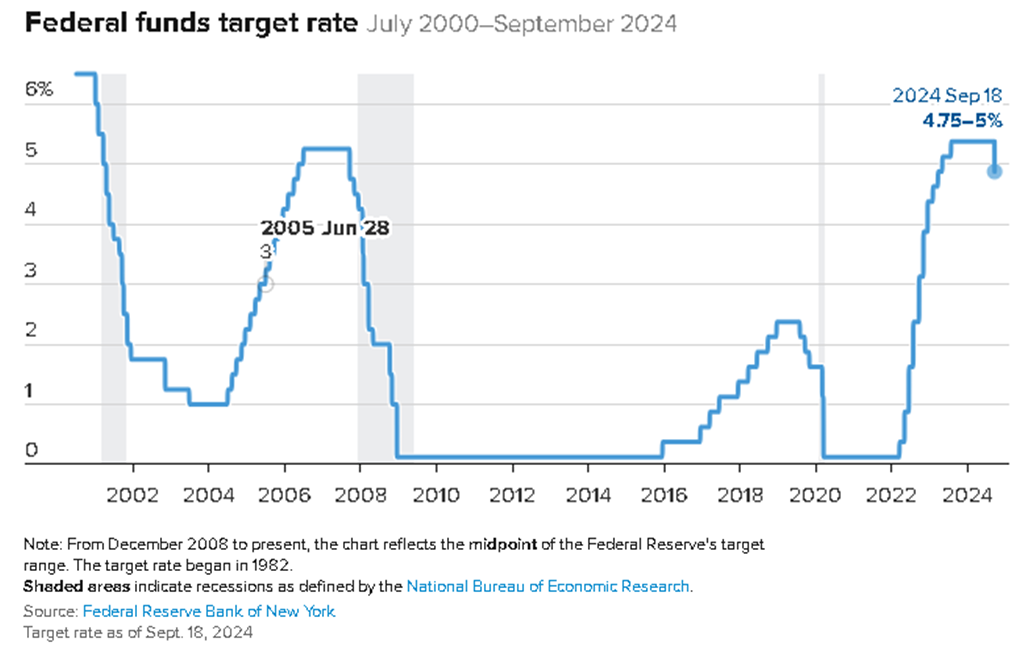
Not Out of The Woods Yet
While the Fed proactively cutting rates is a positive sign in the short term, if we look at a historic chart of the Fed Funds Rate going back to 2000, you will see a pattern from past cycles that only AFTER the Fed begins cutting rates does the economy enter a recession. So, while we applaud the Fed for being proactive with these bigger rate cuts, it still echoes the warning, “Will this rate cut and the future rate cuts be enough to avoid a recession?”. Only time will tell.
Do We Expect Additional Fed Rate Cuts
We do expect the Fed to implement additional rate cuts before the end of 2024, which if the economy hits a rough patch within the next few months, will hopefully provide some optimism that help is already on the way as these rates cuts that have already been made work their way through the economy.
The good news is they have room to cut rates by more. We were concerned at the beginning of the rate hike cycle that if they were not able to raise rates by enough, they would not have enough room to cut rates if the economy ran into a soft patch; but given the magnitude of the rate hikes between March 2022 and now, there is plenty of room to cut and restore confidence if it is needed in coming months.
COVID Stimulus Money Still In The Economy
In general, I think individuals underestimate the power of the amount of cash that was pumped into the system during COVID that was never taken out. In the 2008/2009 recession, the Federal Reserve expanded its balance sheet by about $1 trillion. During COVID they expanded the Fed balance sheet by about $4.5 Trillion, and to date they have only taken back about $1T of the initial $4.5T, so the U.S. economy has an additional $3.5T in liquidity that was not in the economy before 2020. That’s a lot of money to build a bridge to a possible soft-landing scenario.
Multiple Forces Acting On The Markets
We do expect escalated levels of volatility in the stock market in the fourth quarter. Not only do we have the market volatility surrounding the change in Fed policy, but we also have the elections in November that will inevitably inject additional volatility into the markets. As we get past the elections and enter 2025, we may return to more normal levels of volatility, because at that point the economy will know the political agenda for the next 4 years and some of the Fed rate cuts will have worked their way into the economy, potentially leading to stronger economic data in Q1 and Q2 of 2025.
All eyes will be on the race between the Fed rate cuts and the health of the economy.
About Michael……...
Hi, I’m Michael Ruger. I’m the managing partner of Greenbush Financial Group and the creator of the nationally recognized Money Smart Board blog . I created the blog because there are a lot of events in life that require important financial decisions. The goal is to help our readers avoid big financial missteps, discover financial solutions that they were not aware of, and to optimize their financial future.
Frequently Asked Questions (FAQs):
Why did the Federal Reserve cut rates by 0.50% in September 2024?
The Fed cut the Federal Funds Rate by 0.50% to support a slowing economy as inflation returned to its target range and the job market began to cool. The larger-than-expected cut was intended to provide earlier stimulus rather than waiting until the economy weakens further.
How do Fed rate cuts typically affect the economy?
Lowering interest rates makes borrowing cheaper for consumers and businesses, which can boost spending on homes, cars, and investments. However, it typically takes six to nine months for the effects of a rate cut to fully work through the economy.

A Market Selloff Triggered By A Fed Policy Error
The Fed made a significant policy error last week by deciding not to cut the Fed Funds rate and the stock market is now responding to that error via the selloff we have seen over the past week. Unfortunately, this policy error is nothing new. Throughout history, the Fed typically waits too long to begin reducing interest rates after inflation has already abated and they seem to be on that path again.

The Fed made a significant policy error last week by deciding not to cut the Fed Funds rate and the stock market is now responding to that error via the selloff we have seen over the past week. Unfortunately, this policy error is nothing new. Throughout history, the Fed typically waits too long to begin reducing interest rates after inflation has already abated and they seem to be on that path again.
The Fed’s primary objective is to create an economic environment with full employment and inflation in a range of 2% to 3%. The Fed's primary tool to achieve these objectives is the use of the Fed Funds rate, which has a dramatic impact on interest rates within the economy. When the economy runs too hot, the Fed raises interest rates to slow it down. When the economy begins to contract, the Fed lowers interest rates and makes lending more attractive to get the economy going again.
Think of the economy like a campfire; the Fed is the campfire attendant, and they have three tools at their disposal:
Logs
Gasoline
Garden hose
When the economy is growing rapidly, the fire can get too big and risks getting out of control. When that happens, the Fed can use the garden hose (raising interest rates) to dampen the blaze. Over the past 18 months, the Fed has raised rates to reduce inflation from the peak rate of 9% to the current rate of 3%.
Their use of the hose has also caused the labor market to soften which can be seen in the reduction in the rate of non-farm payroll gains:

It can also be seen in the recent rise in the unemployment rate (grey line) and the steady decline in wage growth (blue line):

While the Fed has successfully tamed the inflation blaze, it now runs a new risk: the fire going out completely, which results in the economy slipping into a recession.
As the fire dies down, the Fed's job is to add logs to the fire via interest rate cuts to keep the fire from going out completely.
Last Wednesday (July 31, 2024), the fire was at a level that it needed a log, but the Fed decided not to add one, and the stock market responded accordingly. The Fed does not meet again until September 17th, which is almost seven weeks away. They now run the risk that the fire gets too low before reaching that September meeting.
But there is also another risk that the market is digesting: if the fire does get too low or goes out before the September 17th meeting; for anyone that has ever used too much water on a fire, it can take a while to rebuild the fire. Meaning, if the Fed does wait until the September meeting to reduce interest rates by 0.25% - 0.50%, it historically takes 4 to 6 months before that decrease in interest rates has a positive impact on the economy, and that 4 to 6 month wait is usually ugly for the equity markets knowing that help is on the way but it’s not here yet.
If the recent market selloff escalates, I think there is a good chance that the Fed may need to step in before the September 17th meeting and announce a rate cut to calm the markets. While it may be viewed as an act of desperation to keep the economy from slipping into a recession, in my opinion, it’s something that should have already happened. It’s only logical that if inflation is in a safe range and trending downward, and labor markets are showing the same trend line of softening which they are, a 0.25% rate cut, at a minimum, is warranted given the fact that the rate cut will not have its positive impact for another 4 – 6 months.
Unfortunately, throughout history, the Fed has been late to both sides of the game. They typically wait too long to raise rates, which gave us the 9% inflation in 2022, and they historically wait too long to cut rates, which is why there has historically been turbulence from the equity market on the backside of Fed rate hike cycles.
If the Fed either steps in before the September 17th meeting to lower rates or if the economy can stabilize between now and the September meeting for a potentially larger rate cut from the Fed, markets may stabilize in the coming week, however, investors also have to be ready for an escalation of the current selloff and increased levels of volatility as the markets try to maneuver through the late-innings of the Fed’s tightening cycle. Otherwise, the economy could slip into a mild recession that so many economists were predicting in 2023 that never happened, and then the Fed will be forced to use gasoline on the fire via a series of rapid large rate cuts and/or direct injection of liquidity (bond buying).
About Michael……...
Hi, I’m Michael Ruger. I’m the managing partner of Greenbush Financial Group and the creator of the nationally recognized Money Smart Board blog . I created the blog because there are a lot of events in life that require important financial decisions. The goal is to help our readers avoid big financial missteps, discover financial solutions that they were not aware of, and to optimize their financial future.

2024 Market Outlook: Investors Are In For A Few Surprises
Investors have to be ready for many surprises in 2024. While the US economy was able to escape a recession in 2023, if anything, it has increased the chances of either a recession or a market pullback in the first half of 2024.
Investors have to be ready for many surprises in 2024. While the US economy was able to escape a recession in 2023, if anything, it has increased the chances of either a recession or a market pullback in the first half of 2024. While many investors remember how bad the Great Recession was back in 2008 and 2009, very few remember what the market conditions were like prior to the recession beginning. As an investment firm, we archive a lot of that data, so we reference it at any time to determine where the market may be headed today, and the historical data is alarming.
Rewind the clock to January 2008
In January 2008, the US economy was already in a recession, but it had not officially been declared yet that's because a recession, by textbook definition, is two consecutive quarters of negative GDP, but you don't get the quarterly GDP readings until after each calendar quarter end, so while the recession in the US officially began December 2007, investors didn't realize recession had been declared until mid-way through 2008. So what were the forecasts for the S&P 500 in January 2008?
The broker-dealer that we were with at the time was forecasting in January 2008 that the S&P 500 Index would be up 16% in 2008. We now know that 2008 was the first year of the Great Recession, and the S&P 500 ended up posting a loss of 36% for the year. Many investors don't realize that historically, the consensus is very bad at predicting a coming recession because they failed to recognize the patterns in the economy and monetary policy that tend to be very good predictors of recessions. Investors are often more worried about missing out on the next 20% rally in the markets, which is why they get caught when the market begins its steep sell-off.
What were some of these economists looking at in January 2008 that made them so wrong? Towards the end of 2007, we had already begun to see the cracks within the US housing market, the economy had already started to slow, but in September 2007, the Federal Reserve began to lower interest rates which stock forecasters saw as a bullish signal that the monetary stimulus of lower interest rates would mean growth for the stock market in 2008. This echoes much of the same rhetoric that I heard in the fourth quarter of 2023 as the Fed decided to go on pause and then built in rate cuts to their 2024 forecast.
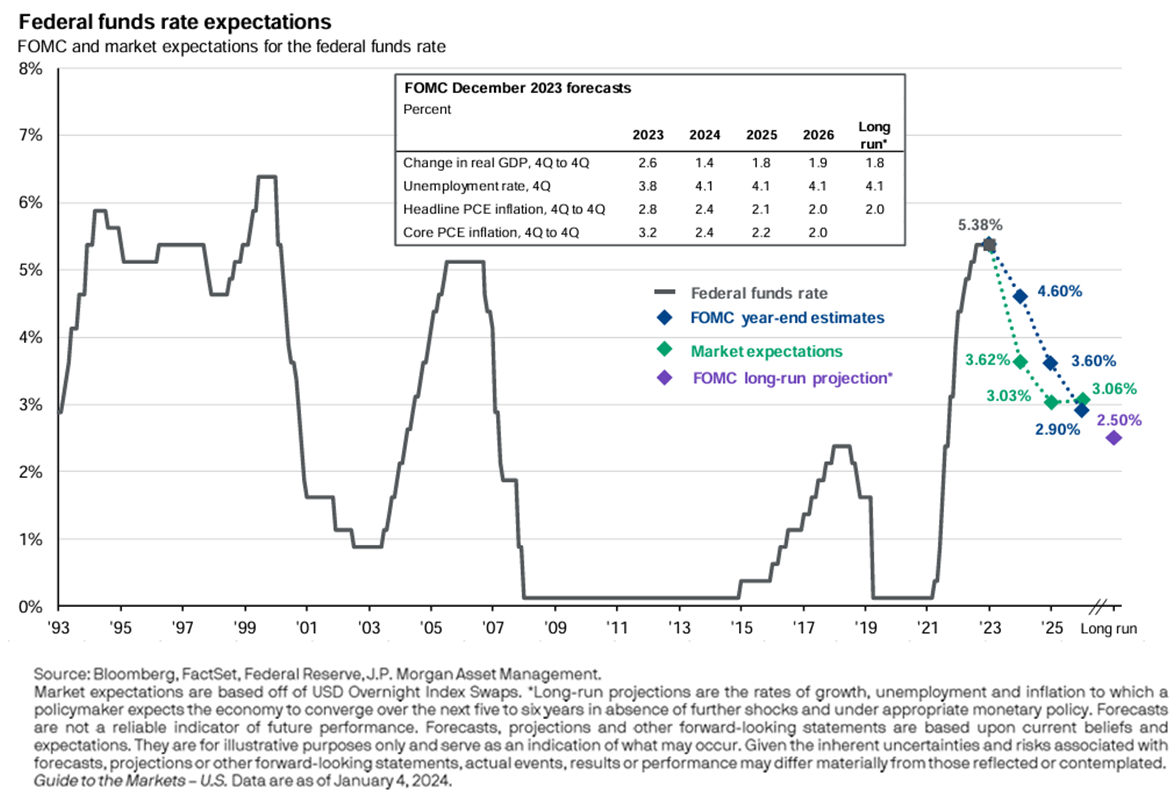
If you look back at history, there's a pattern between the US economy and the Fed funds rate, and it's fairly consistent over time. Here is a chart of the Fed funds rate going back to 1993. You will see the same pattern in the chart, The Fed raises rates to fight inflation, they pause (which is the tabletop portion at each of the mountain peaks), and then rates drop rapidly when the economy slows by too much, and the economy enters a recession. The Fed is historically very bad at delivering soft landings, which is a reduction in inflation without a recession.
Why is that? I think largely it's because we have the largest economy in the world, so picture a battleship in a bathtub, it takes a long time to turn, and because it's so large, once you've begun the turn you can't just stop the turn on a dime, so our turns tend to overshoot their mark, creating prolonged bull market rallies past what the consensus expects, but also an inability to stop the economy from slowing too much in an effort to fight inflation before it dips into a recession.
Here is the pattern
This chart shows our current rate hike cycle as well as the five rate hike cycles before us. For the five rate hike cycles preceding our current cycle, four of the five resulted in a recession. But that means one of the five created a soft landing, which one was it?

The 1994/1995 rate hike cycle was one of the very few soft landings that the Fed has engineered in history, so could that be done again? What was different about the mid-90s compared to the other four rate hike cycles that led us into a recession?
Leading Economic Index
The leading economic index is comprised of multiple economic indicators such as manufacturing hours worked, consumer sediment, building permits, and more. Its parts are considered by many to be forward-looking measurements of economic activity, which is why it's called the leading index. Below is a historical chart of the LEI index going back to 1960. The way you read the chart, when it's blue the leading indicators in aggregate are positive, when it's red, the leading indicators in aggregate are contracting.
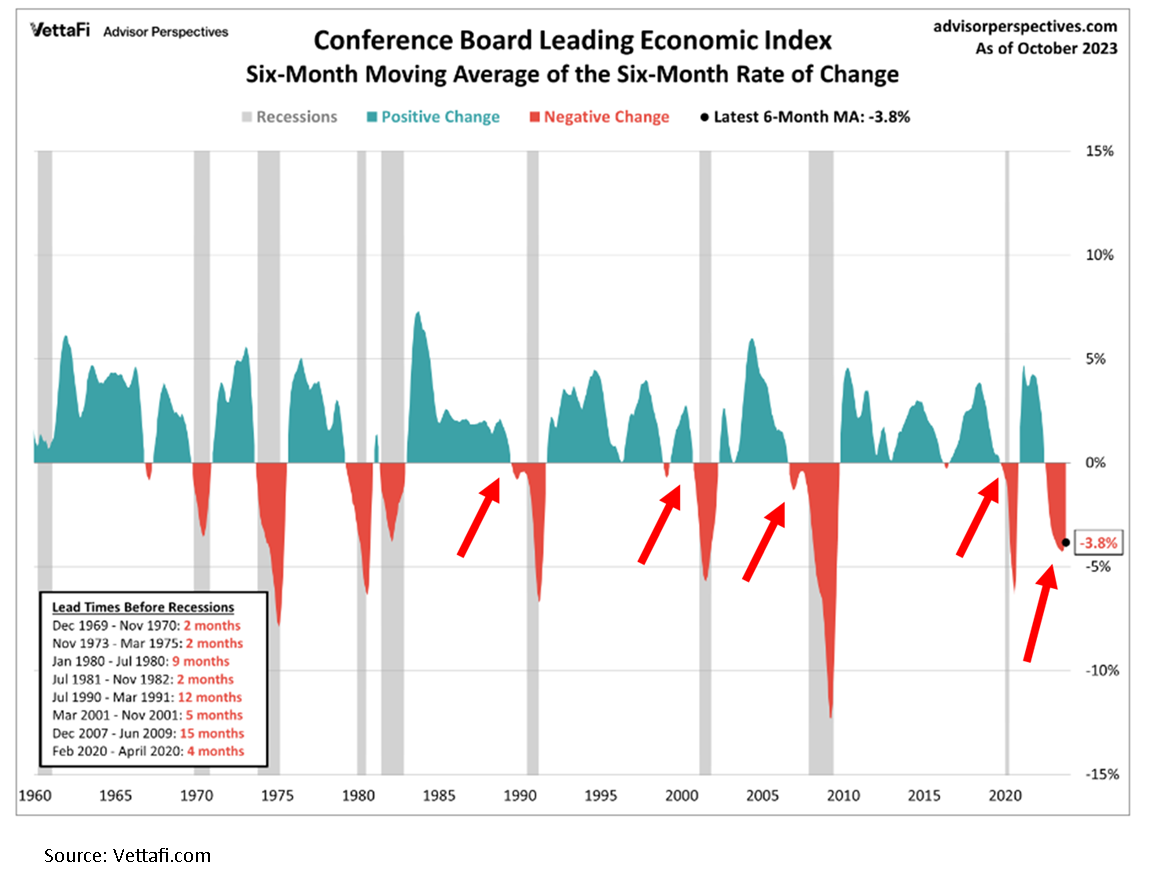
If you look at the four rate hike cycles that led to a recession, the leading indicators index was contracting in all four prior to the recession beginning, serving as a warning sign. But if you look at 1995 in the chart, the leading indicators index never contracted, which means the Fed was able to bring down inflation without slowing the economy.
But on the far right-hand side of the chart, look at where we are now. Not only has the leading indicators index contracted similar to the four rate hike cycles that caused the recession, but it's contracted at a level so deep that we've never been at this level without already being in a recession. If we avoid a recession over the next 12 months, it will be the first time that the LEI index has been this low without a recession preceding it.
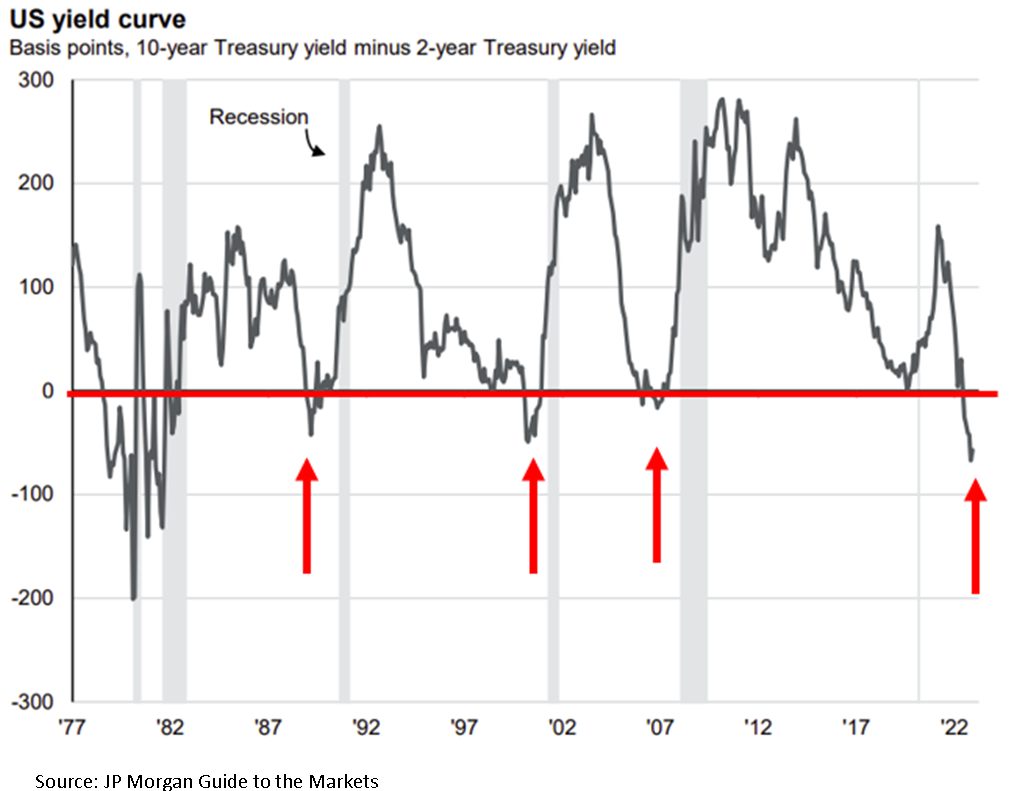
Inverted yield curve
There is a technical indicator in the bond market called the yield curve, which tracks both short-term and long-term interest rates. Without getting into the technical details of how it works, when the yield curve inverts, which means short-term interest rates are higher than long-term interest rates, historically, it's a bearish signal, and it increases the likelihood of a recession occurring. In the past, an inverted yield curve has been a very good predictor of a coming recession. See the chart below.
Anytime The blue line drops below the red line the yield curve is inverted, the gray bars on the chart are the recessions, so when all of the previous 5 recessions the yield curve gave us an advance warning before the recession actually occurred. On the far right-hand side of the chart, that is where we are now, not just slightly inverted, but far more heavily inverted than the previous four recessions. Similar to the leading indicators index historical behavior, if we were to avoid a recession in the next 12 months, that would be the exception to the rule.
Returning to our original question of why was the 1994/1995 soft landing different, notice on the inverted yield curve chart during 1995, the yield curve never inverted, making it much different than the situation we're in now.
Magnitude and pace of rate hikes
After going through this exercise and understanding the patterns of the leading indicators index as well as the yield curve, let's return to our first chart, which showed the six rate hike cycles, including the one we're in now.
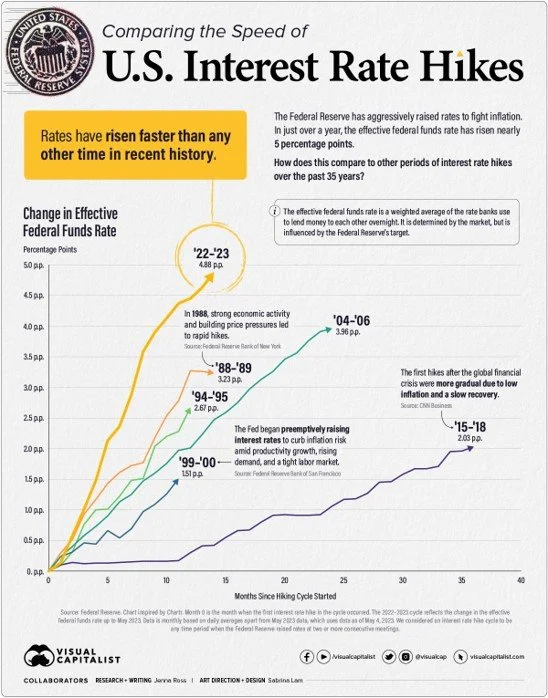
The gold line is the rate hike cycle that we're in now, the others are the five previous rate hike cycles. Again four of those five caused the recession, and the reason why the gold line on the chart is higher than the rest the Fed raised rates higher and faster than they had in the previous five rate hike cycles which begs the question, if the catalyst that caused the recessions is stronger, wouldn't the occurance of a recession be more likely?
Said another way, think of the Fed as a bully that likes to push kids at school, the kids represent the US economy, and the force that the bully uses to push the kids is measured by the magnitude of the interest rate increase. There are six kids standing in the hallway as the bully approaches, the first four he pushes with half of his strength, and the kids fall over on the floor, the fifth child gets nudged but does not fall over, but the bully is now running full speed at the sixth child and we're trying to figure out how it's going to end.
With history as a guide, I have a difficult time envisioning a situation where that sixth student remains on their feet.
No Recession
So what if we're wrong? What if, by some miracle, in the face of all these historic trends, the US economy avoids a recession? I would then add that while it is, of course, possible that we could avoid a recession because it's happened before, that does not necessarily mean we are going avoid a 10% plus market correction at some point in 2024 because the stock market looks to be priced for perfection. You can see this in the future earnings expectations for the S&P 500. Blue bars on the chart are the earnings expectations going into 2024 that are already baked into the S&P 500 stock prices.

It seems that not only is the consensus expecting no recession, but they are also expecting significant earnings growth. Again, with the leading economic indicators being so negative right now and the Fed not expected to lower rates until mid-2024, how do the companies in the S&P 500 meet those aggressive earnings expectations when it seems like the consumer is softening? I completely understand that the stock market is a forward-looking animal, but it seems more likely that we're repeating the mistakes of the past because the stock market can only go so far without the economy and the stock market is already way ahead even as we head into 2024. That was the most puzzling aspect of 2023, the stock market continued to rally throughout all of 2023, while the U.S. economy continued to slow throughout 2023.
The Consumer Is Not As Strong As They Seem
I continue to hear the phrase, “consumer spending remains strong”, and I agree that the consumer has been more resilient that even I expected in 2023. However, much of that spending is being done on credit. Take a look at how much credit card debt has risen in the U.S. post COVID, quickly breaking through over $1 Trillon dollars.

Not only has the level of credit card debt risen to record levels but the interest rates being charged on that debt is significantly higher than it was just a year ago, resulting in less discretionary income for consumers with credit card debt.
Buffet & Munger
Many people know the famous investor Warren Buffet and his famous quote: “Be fearful when others are greedy, and be greedy when others are fearful.” But many people don’t know that Warren had a fellow billionaire partner in Berkshire Hathaway named Charlie Munger. Charlie just passed away in 2023 at the age of 99, and Charlie had a famous quote of his own:
“The world is full of foolish gamblers, and they will not do as well as the patient investors.”
Living in a world of FOMO (Fear Of Missing Out), patience is probably the most difficult investment discipline to master, but I personally have found it to be the most rewarding discipline during my 20+ year career in the investment industry. The year 2024 may be lining up to be another history lesson as FOMO investors fail to recognize the historical pattern between interest rates and the economy dating back 50 years but time will tell.
About Michael……...
Hi, I’m Michael Ruger. I’m the managing partner of Greenbush Financial Group and the creator of the nationally recognized Money Smart Board blog . I created the blog because there are a lot of events in life that require important financial decisions. The goal is to help our readers avoid big financial missteps, discover financial solutions that they were not aware of, and to optimize their financial future.

So Where Is The Recession?
Toward the end of 2022 and for the first half of this year, many economics and market analysts were warning investors of a recession starting within the first 6 months of 2023. Despite those widespread warnings, the S&P 500 Index is up 16% YTD as of July 3, 2023, notching one of the strongest 6-month starts to a year in history. So why have so many people been wrong about their prediction and off by so much?
Toward the end of 2022 and for the first half of this year, many economists and market analysts were warning investors of a recession starting within the first 6 months of 2023. Despite those widespread warnings, the S&P 500 Index is up 16% YTD as of July 3, 2023, notching one of the strongest 6-month starts to a year in history. So why have so many people been wrong about their prediction and off by so much?
The primary reason is that the U.S. economy and the U.S. stock market are telling us two different stories. The U.S. stock market seems to be telling the story that the worst is behind us, inflation is coming down, and we are at the beginning of a renewed economic growth cycle fueled by the new A.I. technology. But the U.S. economy is telling a very different story. The economic data suggests that the economy is slowing down quickly, higher interest rates are taking their toll on bank lending, the consumer, commercial real estate, and many of the economic indicators that have successfully forecasted a recession in the past are not only flashing red but have become progressively more negative over the past 6 months despite the rally in the stock market.
So are the economists that predicted a recession this year wrong or just early? In this article, we will review both sides of the argument to determine where the stock market may be heading in the second half of 2023.
The Bull Case
Let’s start off by looking at the bull case making the argument that the worst is behind us and the stock market will continue to rally from here.
Strong Labor Markets
The bulls will point to the strength of the U.S. labor market. Due to the shortage of workers in the labor market, companies are still desperate to find employees to hire, and even companies that have experienced a slowdown within the last 6 months are reluctant to layoff employees for fear that they will not be able to hire them back if either a recession is avoided or if it’s just a mild recession.
I agree that the labor market environment is different than previous market cycles, as a business owner myself, I cannot remember the last time it was this difficult to find qualified employees to hire. From the research that we have completed, the main catalyst of this issue stems from a demographic issue within the U.S. labor force. It’s the simple fact that there are a lot more people in the U.S. ages 50 to 70 than there are people ages 20 – 40. You have people retiring in droves, dropping out of the workforce, and there are just not enough people to replace them.
The bulls are making the case that because of this labor shortage, the unemployment rate will remain low, the consumer will retain their spending power, and a recession will be avoided.
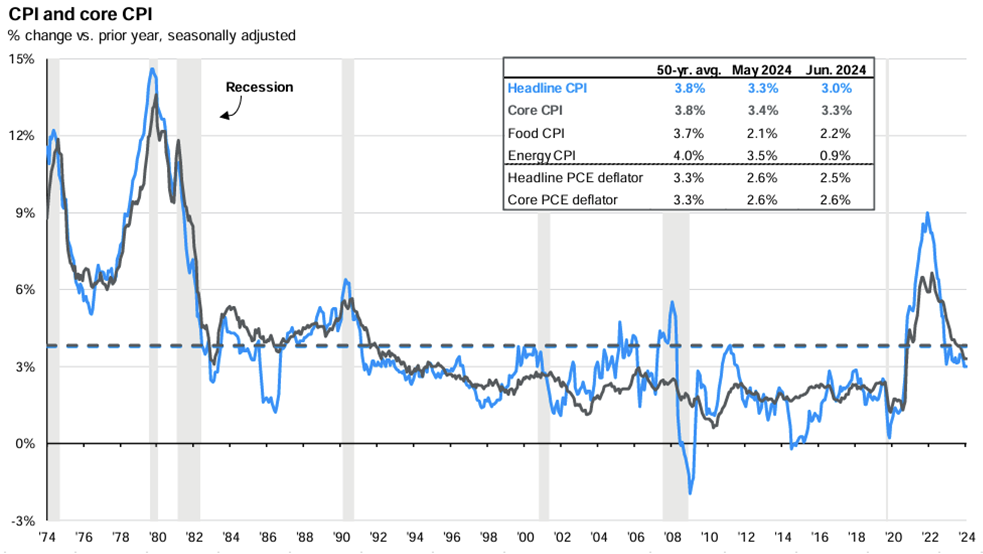
Inflation is Dropping Fast
The main risk to the economy over the past 18 months has been the rapid rise in inflation. The bulls will highlight that not only has the inflation dropped but it has dropped quickly. Inflation peaked in June 2022 at around 9% and as of May 2023, the inflation rate has dropped all of the way down to 4% with the Fed’s target at 2% - 3%. The inflation battle is close to being won. As a result of the rapid drop in inflation, the Fed made the decision to pause as opposed to raising the Fed Fund Rate at their last meeting, which is also welcomed news for bullish investors since avoiding additional interest rate hikes and shifting the discussion to Fed Fund rate cuts could eliminate some of the risks of a Fed-induced recession.
The Market Has Already Priced In The Recession
Some bulls will argue that the stock market has already priced in a mild recession which is the reason why the S&P 500 Index was down 19% in 2022, so even if we end up in a recession, the October 2022 market lows will not be retested. Also, since the market was down in 2022, historically it’s a rare occurrence that the market is down two years in a row.
The Bear Case
Now let’s shift gears over to the bear case that would argue that while a recession has not surfaced yet, there are numerous economic indicators that would suggest that there is a very high probability that the U.S. economy will enter a recession within the next 12 months. Full disclosure, we are in this camp and we have been in this camp since December 2021. Admittedly, I am surprised at the “magnitude” of the rally this year but not necessarily surprised at the rally itself.
Bear Market Rallies Are Common
Rarely does the stock market fire a warning shot and then proceed to enter a recession. Historically, it is more common that the stock market experiences what we call a “false rally”, right before the stock market wakes up to the fact that the economy is headed for a recession, followed by a steep selloff but there is always a bull market case that exists that investors want to believe.
The last real recession that we had was the 2008 housing crisis and while investors remember how painful that recession was for their investment accounts, they typically don’t remember what was happening prior to the recession beginning. Leading into the 2008/2009 recession, the S&P 500 Index had rallied 12%, the housing market issues were beginning to surface, but there was still a strong case for a soft landing as the Fed paused interest rate hikes, and began decreasing the Fed Funds Rate at the beginning of 2008, but as we know today the Great Recession occurred anyways.
The Fed Has Never Delivered A Soft Landing
While there is talk of a soft landing with no recession, if you look back in history, anytime the Fed has had to reduce the inflation rate by more than 2%, the Fed rate hike cycle has been followed by a recession every single time. As I mentioned above, the inflation rate peaked at 9% and their target is 2% - 3% so they have to bring down the inflation rate by much more than 2%. If they pull off a soft landing with no recession, it would be the first time that has ever happened.
The Market Bottom
For the bulls that argue that the market is expecting a mild recession and has already priced that in, that would also be the first time that has ever happened. If you look back at the past 9 recessions, how many times in the past 9 recessions did the market bottom PRIOR to the recession beginning? Answer: Zero. In each of the past 9 recessions, the market bottomed at some point during the recession but not before it.
Also, the historical P/E ratio of the S&P 500 Index is a 17. P/E ratios are a wildly used metric to determine whether an investment or index is undervalued, fairly valued, or overvalued. As I write this article on July 3, 2023, the forward P/E of the S&P 500 Index is 22 so the stock market is already arguably overvalued or as others might describe it as “priced to perfection”. So not only is the stock market priced for no recession, it’s priced for significant earnings growth from the companies that are represented within the S&P 500 Index.
A Rally Fueled by 6 Tech Companies
The S&P 500 Index, the stock market, is comprised of 500 of the largest publicly traded companies in the U.S. The S&P Index is a “cap-weighted index” which means the larger the company, the larger the impact on the direction of the index. Why does this matter? In 2023, many of the big tech companies in the U.S. have rallied substantially on the back of the artificial intelligence boom.
As of June 2, 2023, the S&P 500 Index was up 11.4% YTD, and at that time Nvidia one of the top ten largest companies in the S&P 500 was up 171%, Amazon up 49%, Google up 41%. If instead you ignored the size of the companies in the S&P 500 Index and gave equal weight to each of the 500 companies that make up the stock index, the S&P 500 Index would have only been up 1.2% YTD as of June 2, 2023. So this has not been what we consider a broad rally where most of the companies are moving higher. (Data Source for this section: Reuters)
Why is this important? In a truly sustainable growth environment, we tend to see a broad market rally where a large number of companies within the index see a meaningful amount of appreciation and just doesn’t seem to be the case with the stock market rally this year.
2 Predictors of Coming Recessions
There are two economic indicators that have historically been very good at predicting recessions; the yield curve and the Leading Economic Indicators Index. Both started the year flashing red warning signals and despite the stock market rally so far this year, both indicators have moved even more negative within the first 6 months of 2023.
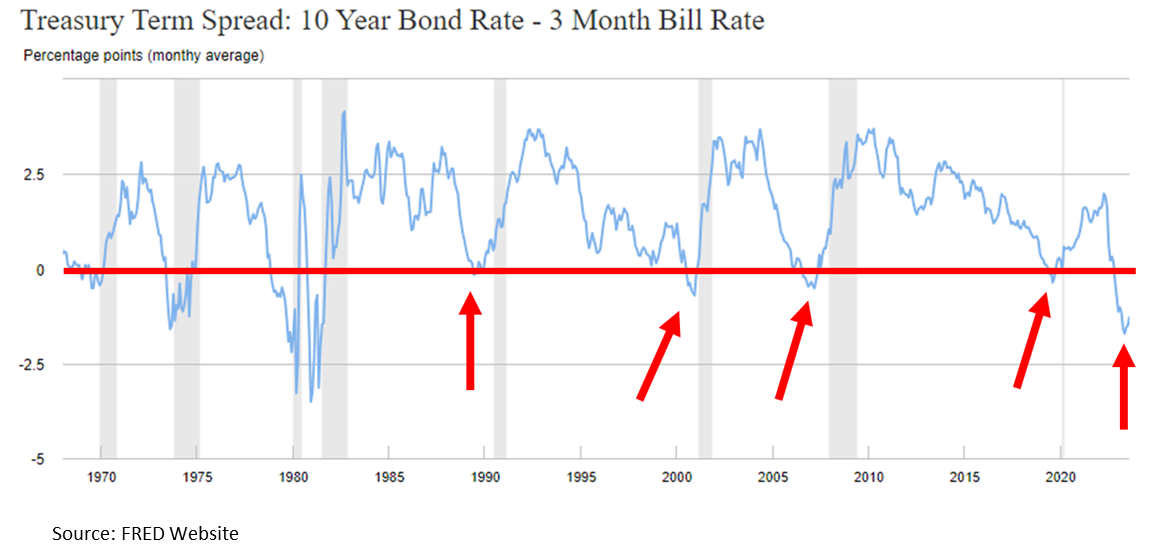
Inverted Yield Curve
The yield curve right now is inverted which historically is a very accurate predictor of a coming recession. Below is a chart of the yield curve going back to 1977, anytime the grey line moved below the red line in the chart, the yield curve is inverted. As you can see, each time the yield curve inverts it’s followed by a recession which are the grey shaded areas within the graph. On the far right side of the chart is where we are now, heavily inverted. If we don’t get a recession within the next 12 months, it would be the first time ever that the yield curve was this inverted and a recession did not occur.
The duration of the inversion is also something to take note of. As of July 2, 2023 the yield curve has been inverted for 159 trading days, since 1962 the longest streak that the yield curve was inverted was 209 trading days ending May 2008 (the beginning of the Great Recession). If the current yield curve stays inverted until mid-September, which is likely, it will break that record.
Leading Economic Indicators Index (LEI Index)
The Leading Economic Indicators index is the second very accurate predictor of a coming recession because as the name suggests the index is comprised of forward-looking economic data including but not limited to manufacturing hours works, building permits, yield curve, consumer confidence, and weekly unemployment claims. The yield curve is a warning from the bond market and the LEI index is a warning from the U.S. economy.
In the chart below, when the blue drops below the red line (where the red arrows are) the LEI index has turned negative, indicating that the forward-looking economic indicators in the U.S. economy are slowing down. The light grey areas are the recessions. As you can see in the chart, shortly after the LEI index goes negative, historically a recession appears shortly after. If you look at where are now on the righthand side of the chart, not only are we negative on the LEI, but we have never been this negative without already being in a recession. Again, if we don’t get a recession within the next 12 months, it would be the first time ever that this indicator did not accurately predict a recession at its current level.

“Well…..This Time It’s Different”
A common phrase that you will hear from the bulls right now is “well…..this time is different” followed by a list of all the reasons why the yield curve, LEI index, and other indicators that are flashing red are no longer a creditable predictor of a coming recession. After being in the investment industry for over 20 years and experiencing the tech bubble bust, housing crisis, Eurozone crisis, and Covid, from my experience, it’s rarely different which is why these predictors of recessions have been so accurate over time. Yes, the market environment is not exactly the same in each time period, sometimes there is a house crisis, other times an energy crisis, or maybe a pandemic, but the impact that monetary policy and fiscal policy have on the economy tend to remain constant over longer periods of time.
Market Timing
It’s very difficult to time the market. I would love to be able to know exactly when the market was peaking and bottoming in each market cycle but the stock market itself throws off so many false readings that become traps for investors. While we rely more heavily on the economic indicators because they have a better track record of predicting market outcomes over the long term, the timing is never spot on but what I have learned over time is that if you are able to sidestep the recessions, and avoid the big 25%+ downturns in an investment portfolio, it often leads to greater outperformance over the long term. Remember, mathematically, if your portfolio drops by 50%, you have to earn a 100% rate of return to get back to breakeven. But it takes discipline to watch these market rallies happen and not feel like you are missing out.
The Consumer’s Uphill Battle
Consumer spending is the number one driver of the U.S. economy and the consumer is going to face multiple headwinds in the second half of 2023. First, student loan payments are set to restart in October. Due to the Covid relief, many individuals with student loans have not been required to make a payment for the past three years and the $10,000 student loan debt cancellation that many people were banking on was recently struck down by the Supreme Court.
Second, while inflation has dropped, the interest rates on mortgages, car loans, and credit cards have not. The inflation rate dropped from 9% in June 2022 to 4% in May 2023 but the 30-year fixed mortgage rate peaked in November at around 7% and as of July 2023 still remains around 6.8%, virtually unchanged, so not a lot of relief for individuals that are trying to buy a house.
This is largely attributed to the third headwind for consumers which is that banks are tightening their lending practices. The banks see the same charts of the economy that we do and when the economy begins slowing down banks begin to tighten their lending standards making it more difficult for consumers and businesses to obtain loans. Even though the stock market has rallied in 2023, banks have continued to tighten their lending standards over the past 6 months and with more limited access to credit, that could put pressure on the economy in the second half of 2023.
Consumer spending has been stronger than expected in 2023 which has helped fuel the stock market rally this year but we can see in the data that a lot of this spending has been done using credit cards and default rates on credit cards and auto loans are rising quickly. So now many consumers have not only spent through their savings but by the end of the year they could have large credit card payments, car payments, higher mortgage/rent payments, and student loan payments.
Reasons for Recession Delay
With all of these clear headwinds for the market, why has the recession not begun yet as so many economists had forecasted at the beginning of 2023? In my opinion, the primary reason for the delay is that it typically takes 9 to 12 months for each Fed rate hike to impact the economy. When the Fed is raising rates, they are intentionally trying to slow down the economy to curb inflation. The Fed just paused for the first time in June 2023 but all of the rate hikes that were implemented in the first half of 2023 have yet to work their way into the economy. This is why you see yet another very consist historically pattern with the Fed Funds Rate. A pattern that I call the “Fed Table Top”. Here is a chart showing the last three Fed rate hike cycles going back to 2000:

You will see the same pattern over time, the Fed raises interest rates to fight inflation which are the moves higher in the chart, they pause at the top of their rate hike cycle which is the “Table Top”, and then a recession appears as a result of their tightening cycle, and they begin dropping interest rates. Once the Fed has reached its pause status or “table top”, some of those pauses last over a year, while other pauses only last a few months. The pause makes sense because again it takes time for all of those rate hikes to impact the economy so it’s never just a straight up and then a straight down in interest rates.
So then that raises the question, how long will this pause be? Honestly, I have no idea, and this is the tricky part again about timing but the pattern has repeated itself time and time again. However, as you can also see in the Fed chart above when you compare the current Fed rate hike cycle to those of the previous 3 cycles, the Fed just raised rates by more than the previous three cycles in a much shorter period of time, that would lead me to believe that this Fed Table Top could be shorter because the 9-month lag of the interest rate hikes on the economy will happen at a greater magnitude compared to the Fed rating rates at 0.25% - 0.50% per meeting as they did in the previous two Fed rate hike cycles.
Bulls or the Bears?
Only time will tell if the economic patterns of the past will remain true and a recession will emerge within the next 12 months or if this time it is truly different, and a recession will be avoided. For investors that have chosen the path of the bull, they will have to remain on their toes, because historically when the turn comes, it comes fast, and with very little warning.
About Michael……...
Hi, I’m Michael Ruger. I’m the managing partner of Greenbush Financial Group and the creator of the nationally recognized Money Smart Board blog . I created the blog because there are a lot of events in life that require important financial decisions. The goal is to help our readers avoid big financial missteps, discover financial solutions that they were not aware of, and to optimize their financial future.