
Volatility, Market Timing, and Long-Term Investing
For many savers, the objective of a retirement account is to accumulate assets while you are working and use those assets to pay for your expenses during retirement. While you are in the accumulation phase, assets are usually invested and hopefully earn a sufficient rate of return to meet your retirement goal. For the majority,
Volatility, Market Timing, and Long-Term Investing
For many savers, the objective of a retirement account is to accumulate assets while you are working and use those assets to pay for your expenses during retirement. While you are in the accumulation phase, assets are usually invested and hopefully earn a sufficient rate of return to meet your retirement goal. For the majority, these accounts are long-term investments and there are certain investing ideas that should be taken into consideration when managing portfolios. This article will discuss volatility, market timing and their role in long-term retirement accounts.
“Market timing is the act of moving in and out of the market or switching between asset classes based on using predictive methods such as technical indicators or economic data” (Investopedia). In other words, trying to sell investments when they are near their highest and buy investments when they are near their lowest. It is difficult, some argue impossible, to time the market successfully enough to generate higher returns. Especially over longer periods. That being said, by reallocating portfolios and not experiencing the full loss during market downturns, investors could see higher returns. When managing portfolios over longer periods, this should be done without the emotion of day to day volatility but by analyzing greater economic trends.
So far, the stock market in 2018 has been volatile; particularly when compared to 2017. Below are charts of the S&P 500 from 1/1/2018 – 10/21/2018 and the same period for 2017.
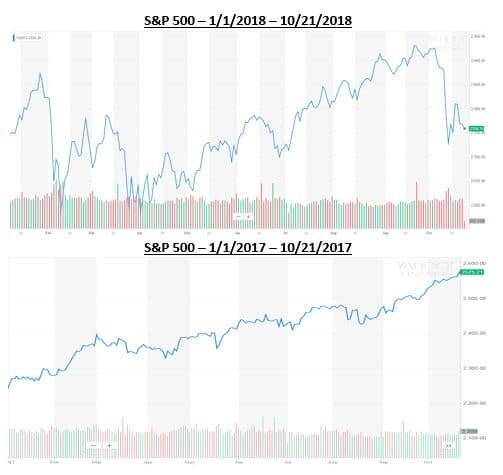
Source: Yahoo Finance. Information has been obtained from sources believed to be reliable and are subject to change without notification.
Based on the two charts above, one could conclude the majority of investors would prefer 2017 100% of the time. In reality, the market averages a correction of over 10% each year and there are years the market goes up and there are years the market goes down. Currently, the volatility in the market has a lot of investors on edge, but when comparing 2018 to the market historically, one could argue this year is more typical than a year like 2017 where the market had very little to no volatility.
Another note from the charts above are the red and green bars on the bottom of each year. The red represent down days in the market and the green represent up days. You can see that even though there is more volatility in 2018 compared to 2017 when the market just kept climbing, both years have a mixture of down days and up days.
A lot of investors become emotional when the market is volatile but even in the midst of volatility and downturns, there are days the market is up. The chart below shows what happens to long-term portfolio performance if investors miss the best days in the market during that period.
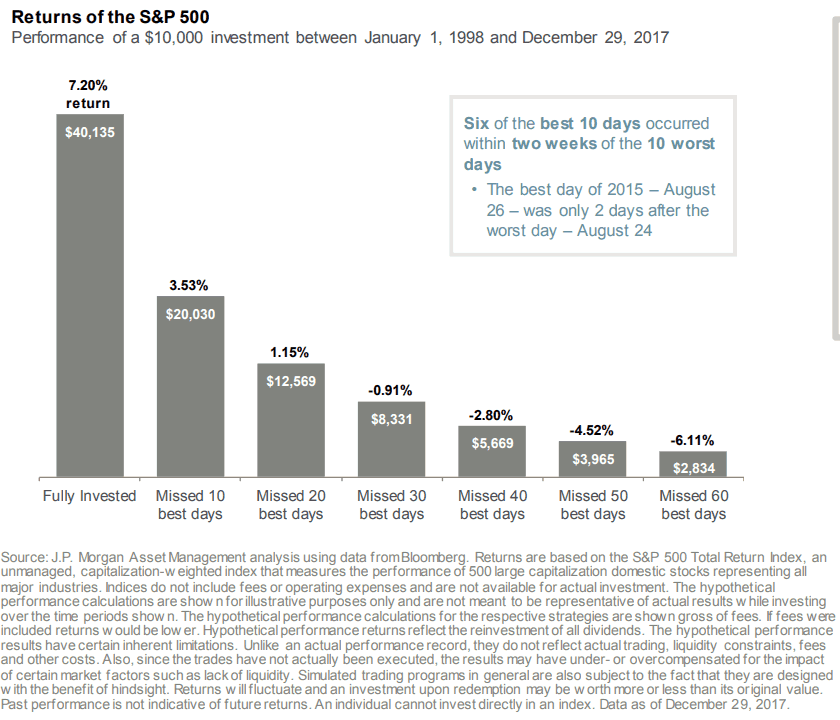
Source: JP Morgan. Information has been obtained from sources believed to be reliable and are subject to change without notification.
Two main takeaways from the illustration above are; 1) missing the best days over a period in the market could have a significant impact on a portfolios performance, and 2) some of the best days in the market over the period analyzed came shortly after the worst days. This means that if people reacted on the worst days and took their money from the market then they likely missed some of the best days.
Market timing is difficult over long periods of time and making drastic moves in asset allocation because of emotional reactions to volatility isn’t always the best strategy for long-term investing. Investors should align their portfolios taking both risk tolerance and time horizon into consideration and make sure the portfolio is updated as each of these change multiple times over longer periods.
When risk tolerance or time horizon do not change, most investors should focus on macro-economic trends rather than daily/weekly/monthly volatility of the market. Not experiencing the full weight of stock market declines could generate higher returns and if data shows the economy may be slowing, it could be a good time to take some “chips off the table”. That being said, looking at past down markets, some of the best days occur shortly after the worst days and staying invested enough to keep in line with your risk tolerance and time horizon could be the best strategy.
It is difficult to take the emotion out of investing when the money is meant to fund your future needs so speaking with your financial consultant to review your situation may be beneficial.
About Rob……...
Hi, I’m Rob Mangold. I’m the Chief Operating Officer at Greenbush Financial Group and a contributor to the Money Smart Board blog. We created the blog to provide strategies that will help our readers personally, professionally, and financially. Our blog is meant to be a resource. If there are questions that you need answered, please feel free to join in on the discussion or contact me directly.


Target Date Funds: A Public Service Announcement
Before getting into the main objective of this article, let me briefly explain a Target Date Fund. Investopedia defines a target date fund as “a fund offered by an investment company that seeks to grow assets over a specified period of time for a targeted goal”. The specified period of time is typically the period until the date you “target” for retirement

Target Date Funds: A Public Service Announcement
Before getting into the main objective of this article, let me briefly explain a Target Date Fund. Investopedia defines a target date fund as “a fund offered by an investment company that seeks to grow assets over a specified period of time for a targeted goal”. The specified period of time is typically the period until the date you “target” for retirement or to start withdrawing assets. For this article, I will refer to the target date as the “retirement date” because that is how Target Date Funds are typically used.
Target Date Funds are continuing to grow in popularity as Defined Contribution Plans (i.e. 401(k)’s) become the primary savings vehicle for retirement. Per the Investment Company Institute, as of March 31, 2018, there was $1.1 trillion invested in Target Date Mutual Funds. Defined Contribution Plans made up 67 percent of that total.
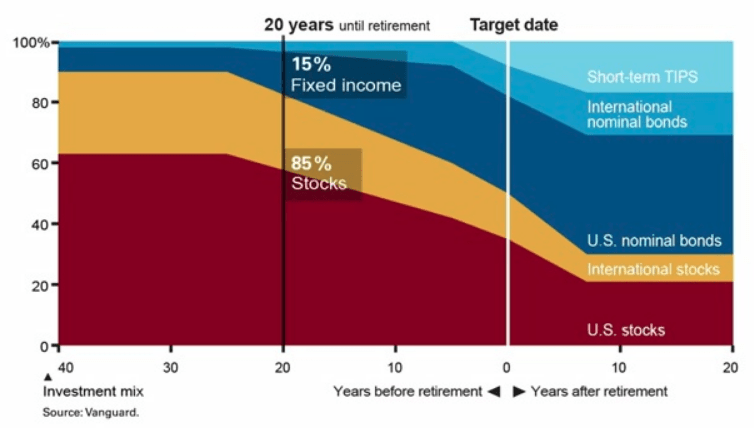
Target Date Funds are often coined as the “set it and forget it” of investments for participants in retirement plans. Target Date Funds that are farther from the retirement date will be invested more aggressively than target date funds closer to the retirement date. Below is a chart showing the “Glide Path” of the Vanguard Target Date Funds. The horizontal access shows how far someone is from retirement and the vertical access shows the percentage of stocks in the investment. In general, more stock means more aggressive. The “40” in the bottom left indicates someone that is 40 years from their retirement date. A common investment strategy in retirement accounts is to be more aggressive when you’re younger and become more conservative as you approach your retirement age. Following this strategy, someone with 40 years until retirement is more aggressive which is why at this point the Glide Path shows an allocation of approximately 90% stocks and 10% fixed income. When the fund is at “0”, this is the retirement date and the fund is more conservative with an allocation of approximately 50% stocks and 50% fixed income. Using a Target Date Fund, a person can become more conservative over time without manually making any changes.
Note: Not every fund family (i.e. Vanguard, American Funds, T. Rowe Price, etc.) has the same strategy on how they manage the investments inside the Target Date Funds, but each of them follows a Glide Path like the one shown below.
The Public Service Announcement
The public service announcement is to remind investors they should take both time horizon and risk tolerance into consideration when creating a portfolio for themselves. The Target Date Fund solution focuses on time horizon but how does it factor in risk tolerance?Target Date Funds combine time horizon and risk tolerance as if they are the same for each investor with the same amount of time before retirement. In other words, each person 30 years from retirement that is using the Target Date strategy as it was intended will have the same stock to bond allocation.This is one of the ways the Target Date Fund solution can fall short as it is likely not possible to truly know somebody’s risk tolerance without knowing them. In my experience, not every investor 30 years from retirement is comfortable with their biggest retirement asset being allocated to 90% stock. For various reasons, some people are more conservative, and the Target Date Fund solution may not be appropriate for their risk tolerance.The “set it and forget it” phrase is often used because Target Date Funds automatically become more conservative for investors as they approach their Target Date. This is a strategy that does work and is appropriate for a lot of investors which is why the strategy is continuing to increase in popularity. The takeaway from this article is to think about your risk tolerance and to be educated on the way Target Date Funds work as it is important to make sure both are in line with each other.For a more information on Target Date Funds please visit https://www.greenbushfinancial.com/target-date-funds-and-their-role-in-the-401k-space/
About Rob……...
Hi, I’m Rob Mangold. I’m the Chief Operating Officer at Greenbush Financial Group and a contributor to the Money Smart Board blog. We created the blog to provide strategies that will help our readers personally, professionally, and financially. Our blog is meant to be a resource. If there are questions that you need answered, please feel free to join in on the discussion or contact me directly.


What Does Tax Reform Mean For The Markets In 2018?
2017 ended up being a huge year for the U.S. stock market. The rally in the stock market was unmistakably driven by the anticipated passing of tax reform and Congress delivered. However, the sheer magnitude of the stock market rally has presented investors with a moment of pause and a lot of unanswered questions as we enter into the first quarter

2017 ended up being a huge year for the U.S. stock market. The rally in the stock market was unmistakably driven by the anticipated passing of tax reform and Congress delivered. However, the sheer magnitude of the stock market rally has presented investors with a moment of pause and a lot of unanswered questions as we enter into the first quarter of 2018. The two main questions being:
What does tax reform mean for the markets in 2018?
We are now in the second longest economic expansion of ALL TIME!!! I know what goes up, eventually comes down. Are we overdue for a major correction in the stock market?
Without a crystal ball, no one knows for sure. However, the purpose of this article is to identify indicators in the economy and the financial markets that may help us gauge the direction of the U.S. economy and equity markets as we progress through 2018.
Tax Reform: Uncharted Waters
While tax reform is a welcome friend for corporate America, we have to acknowledge that this also puts us in uncharted waters. Looking back, there has never been a time in history where the U.S. has injected fiscal stimulus (tax reform) into an economy that is already healthy. The last major tax reform was in the early 1980’s when the U.S. economy was trying to dig itself out of the long 1970’s recession.
When the economy is in a recession, the U.S. can either inject fiscal stimulus or monetary stimulus to get the economy growing again. The U.S. used monetary stimulus to dig us out of the Great Recession of 2008 – 2009. They lowered interest rates to basically 0%, pumped cash into the economy in the form of bond buying, and provided a financial back stop for the U.S. banking system.
These economic stimulus tools are similar to the concept of giving a patient in a hospital a shot of adrenaline. If a patient is flat lining, it provides that patient with a huge surge of energy. The patient’s body goes from 0% to 60%+ in under a minute. So what happens when you give someone who is completely healthy a shot of adrenaline? Do they go from 100% to 110%? My point is a healthy patient does not go from 100% to 160%. Both patients get a boost but the boost to the healthy patient is much lower as a percentage of where they started.
While we have never given the U.S. economy an adrenaline shot after a long economic expansion, I think it’s reasonable to apply the same general concept as our two hospital patients. Tax reform may very well lead to another year of positive returns for the stock market in 2018 but I think it’s very important for investors to set a reasonable expectation of return for the U.S. equity markets given the fact that we are injecting growth into an economy that is already at “full employment”.
Not Enough Workers
One of the greatest challenges that the U.S. economy may face in 2018 is a shortage of qualified workers. Prior to tax reform being passed, companies both large and small, have had plenty of job openings but have not been able to find the employees with the skills necessary to fill those positions.
For example, if Apple had 1000 job openings in November 2017 just to meet the current demand for their goods and services but in 2018, due to tax reform, consumers have more money to spend, and the demand for Apple products increases further, Apple may need to find another 2000 employee to meet the increase in demand. They are having trouble now finding the 1000 employees to meet their current demand, how are they going to find another 2000 quick enough in 2018 to meet the increase in demand? If they can’t make the phones, they can’t sell the phones. Fewer sales equals less revenue, which equals less net profit, which may lead to a lower appreciation rate of the stock price. For disclosure purposes, I’m not picking on Apple. I’m just highlighting an issue that may be common among the companies that make up the S&P 500 Index if tax reform leads to a spike in demand in 2018. If Wall Street is expecting accelerated earnings, how are the companies expected to deliver those enhanced earnings without the employees that they need to increase supply?
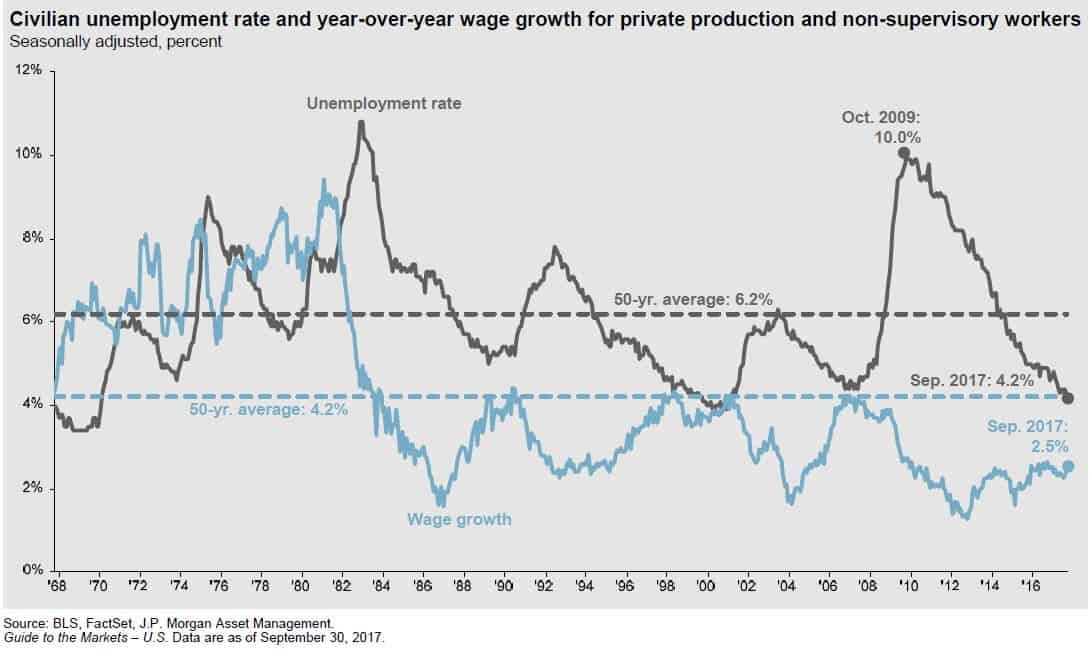
The unemployment rate in the U.S. is currently 4.1%. You have to go all the way back to the late 1960’s to find an employment rate below 4%. So we are essentially at “full employment”.
Rising Wages
The blue line in the chart above is also very important. The blue line represents wage growth. This answers the question: "Are people making more for doing the same amount of work?" If you look back historically on the chart, when the unemployment rate was falling, typically wage growth was increasing. It makes sense. When the economy is good and the job market is healthy, companies have to pay their employees more to keep them. Otherwise they will go work for a competitor, who has 10 job openings, and they get paid more. Wage growth is good for employees but it's bad for companies. For companies, employee wages are usually their largest expense. If you increase wages, you are increasing expenses, which decreases profits. Lower profits typically results in lower stock prices. Companies in 2017 had the luxury of strong demand but limited wage growth. My guess is you will begin to see meaningful wage growth in 2018 as companies see an increase in demand as a result of tax reform and end up having to raise wages to retain and attract employees. This is just another reason why 2018 may be a good year for the stock market but not a great one.
What Fuels GDP Growth?
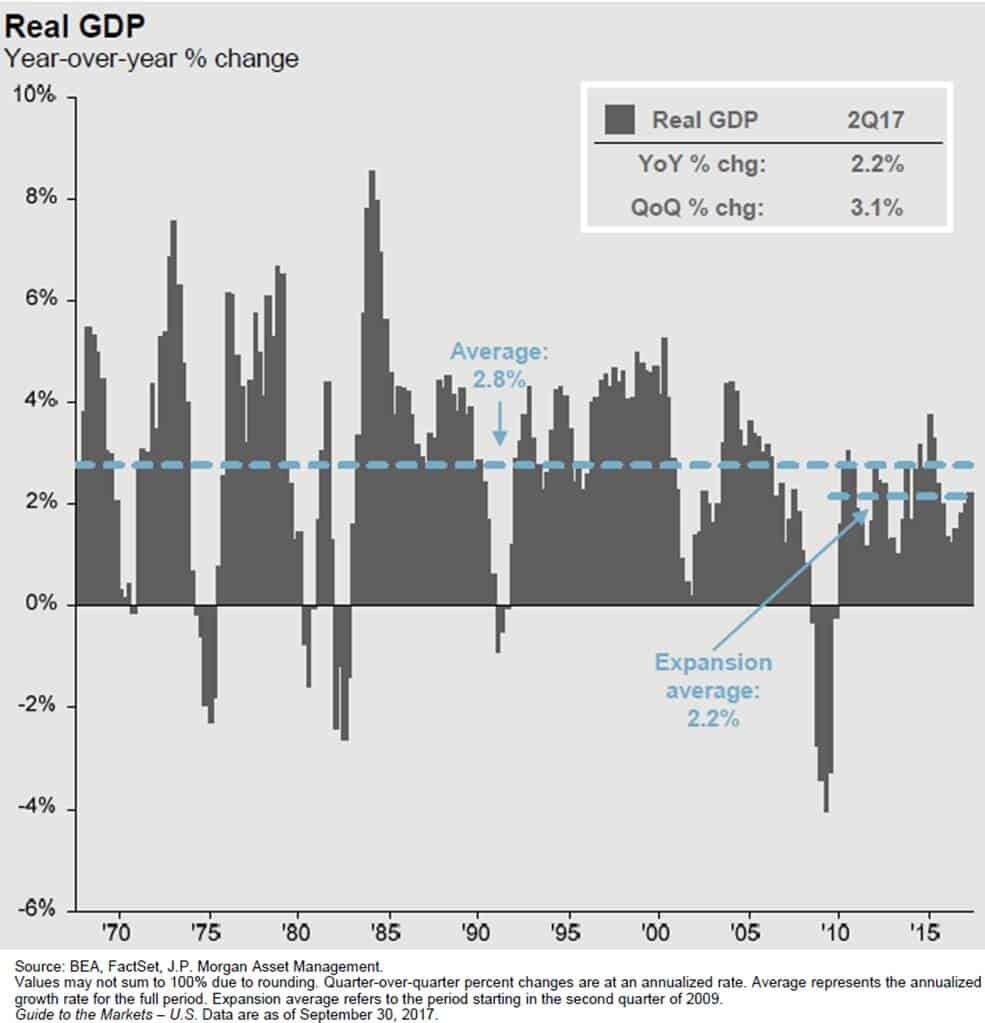
Gross Domestic Product ("GDP") is the economic indicator that is used to measure how much the U.S. economy produces in a year. It's how we gauge whether our economy is growing or contracting. Since March 2009, the GDP growth rate has averaged about 2.2% per year. This is subpar by historic standards. In most economic expansions, GDP is growing at an annual rate of 4%+.
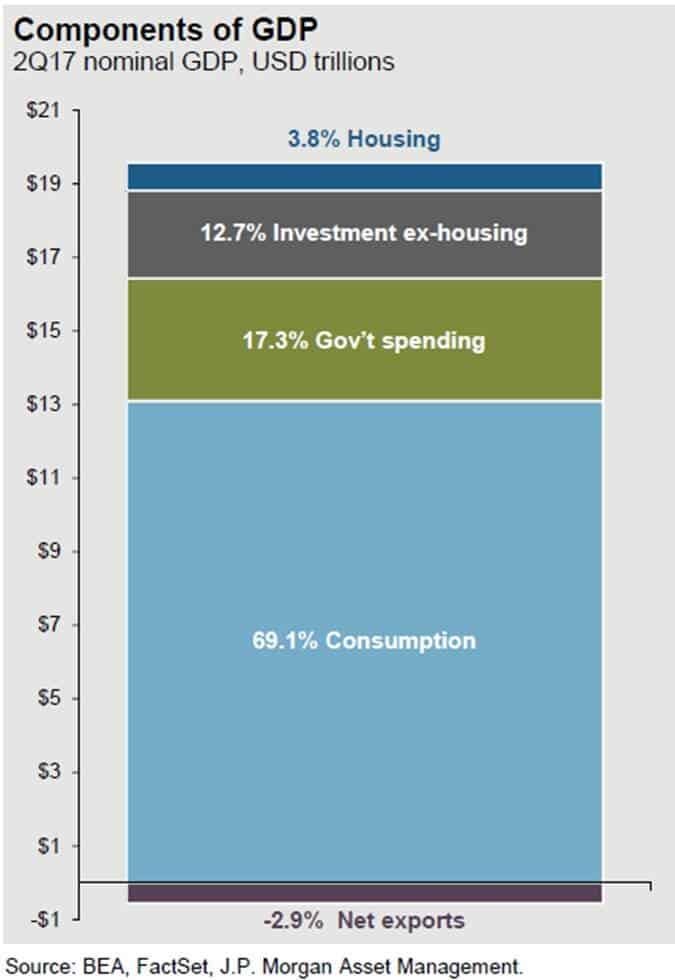
Before we get into what pieces of tax reform may help to increase the GDP growth rate, let us first look at what GDP is made of. Our GDP is comprised of 5 categories (for my fellow econ nerds that assign 4 categories to GDP, we split capital spending into two separate categories):
Consumption or "Consumer Spending" 69.1%
Government Spending (includes defense) 17.3%
Investment (ex-housing) – "Business Spending 12.7%
Housing 3.8%
Net Exports -2.9%
Consumer Spending (+)
Consumer spending which makes up 69.1% of our GDP should increase as a result of tax reform in 2018. In general, if people have more discretionary income, they will spend all or a portion of it. Tax reform will lower the tax bill, for not all, but many U.S. households, increasing their disposable income. Also, if we see an increase in wage growth in 2018, people will be taking home more in their paychecks, allowing them to spend more.
Dr James Kelly, the chief economist of JP Morgan, made a very interesting observation about the evolution of the tax bill. When the tax bills were in their proposed state, one for the Senate and a separate bill for the House, each bill to stay under the $1.5 Trillion 10 year debt cap reduced taxes by about $150 Billion dollars per year. 50% of the annual tax reduction was going to businesses with the other 50% going to individual tax payers.
In order to get the bill passed before the end of the year, Congress was forced to shift a larger proportion of the $150 billion in tax brakes per year to individual taxpayers. In the tax bill’s final form, Dr Kelly estimated that approximately 75% of the tax reductions were now being retained by individual taxpayers with only 25% going to businesses. With a larger proportion of the tax breaks going to individual taxpayers that could increase the amount of discretionary income available to the U.S. consumer.
Government Spending (Push)
The anticipated increase in government spending really stems from the Trump agenda that has been communicated. One of the items that he campaigned on was increasing government spending on infrastructure. At this point we do not have many details as to when the infrastructure spending will begin or how much will be spent. Whatever ends up happening, we are not forecasting a dramatic increase or decrease in government spending in 2018.
Investment - Business Spending (+)
Even though business spending only represents 12.7% of our GDP, we could see a sizable increase in spending by businesses in 2018 for the following reasons:
Corporate tax rate is reduced from 35% to 21%
The repatriation tax will allow companies to bring cash back from overseas at a low tax rate
Prior to tax reform, companies already had historically high levels of cash on their balance sheet. What are they going to do with more cash? (See the chart below)
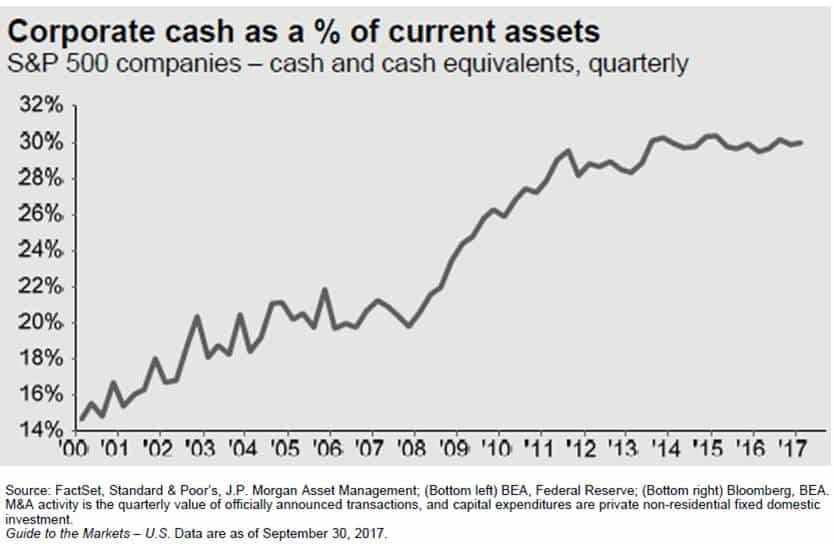
If having more cash was not a large enough incentive by itself for companies to spend money, the new tax rules allowing immediate expensing of the full cost of most assets purchased for the next five years should be. Under the current tax rules, when a business purchases a new piece of equipment, a fleet of trucks, office furniture, whatever it is, the IRS does not allow them to deduct 100% of purchase price in the year that they buy it. They have to follow a "depreciation schedule" and they can only realize a piece of that expense each year. The current tax rules put companies at a tax disadvantage because companies are always trying to shelter as much income as possible from taxation. If Company XYZ buys a piece of equipment that cost $1,000,000, the IRS may require Company XYZ to depreciate that expense over a 10 year period. Meaning they can only realize $100,000 in expenses each year over that 10 year period, even though they already paid the full $1,000,000 for that new piece of equipment.Under the new tax reform, if Company XYZ buys that same new piece of equipment for $1,000,000, they can deduct the full $1,000,000 expense against their income in 2018. Whoa!!! That's huge!! Yes it is and it's a big incentive for companies to spend money over the next five years.
Housing & Net Exports (Push)
We do not expect any significant change from either of these two categories and they represent the smallest portion of our total GDP.
Watch GDP In 2018
The GDP growth rate in 2018 may give us the first indication as to how many "extra innings" we have left in this already long bull market rally. If we do not see a meaningful acceleration in the annual growth rate of GDP above its 2.2% average rate, the rally could be very short lived. On the flip side, if due to tax reform consumer spending and business spending leaps forward in 2018 and 2019, we may be witnessing the longest economic expansion of all time. Time will tell.
Share Buybacks
You will undoubtedly hear a lot about “Share Buybacks” in 2018. Remember, U.S. corporations will most likely have piles of cash on their balance sheets. Instead of spending that money on hiring new employees, buying new equipment, or building a new plant, what else might they do with the cash? The answer, share buybacks.
If a public company like Nike has extra cash, they can go into the market, purchase their own stock, and then get rid of those outstanding shares. Basically it increases the earnings per share for the remaining shareholders.
Example: Let’s assume there are only 4 shares of Nike owned by 4 different people and Nike is worth $100,000. That means that each shareholder is entitled to 25% of that $100,000 or $25,000 each. Now because of tax reform, Nike has $50,000 of extra cash just sitting in its coffers that it otherwise would have paid to the government in taxes. Nike can go into the market with $50,000, purchase 2 shares back from 2 of the shareholders (assuming they would be willing to sell), and then “retire” those two outstanding shares. After that is done, there are 2 outstanding shares remaining but the value of Nike did not change. So the two remaining shareholders, without paying anything extra, now own 50% of Nike, and their shares are worth $50,000 each.
Share buyback may push stock prices higher from a simple math standpoint. If the formula is the value of the company divided by the number of shares outstanding, the fewer shares there are, assuming the value of the company stays the same, the price per share will go up. The incentive for these share buybacks will most likely be there in 2018. Not only will companies have the cash but share buybacks are a way that public companies can reward their current shareholders..
Is The Stock Market Too Expensive?
The P/E ratio of the S&P 500 Index is another barometer that investors will need to keep a close eye on in 2018. P/E ratios help us to answer the questions: “Is the stock market cheap, fairly valued, or expensive at this point?” The “Forward P/E Ratio” divides the price of a stock by the estimated future 12 months of earnings. The average Forward P/E ratio for the S&P 500 Index between December 1989 – September 30, 2017 was 16.0. As of December 22, 2017, the Forward P/E ratio of the S&P 500 Index is 19.99. In other words, it’s running at 25% above its 25 year historic average. See the chart below:
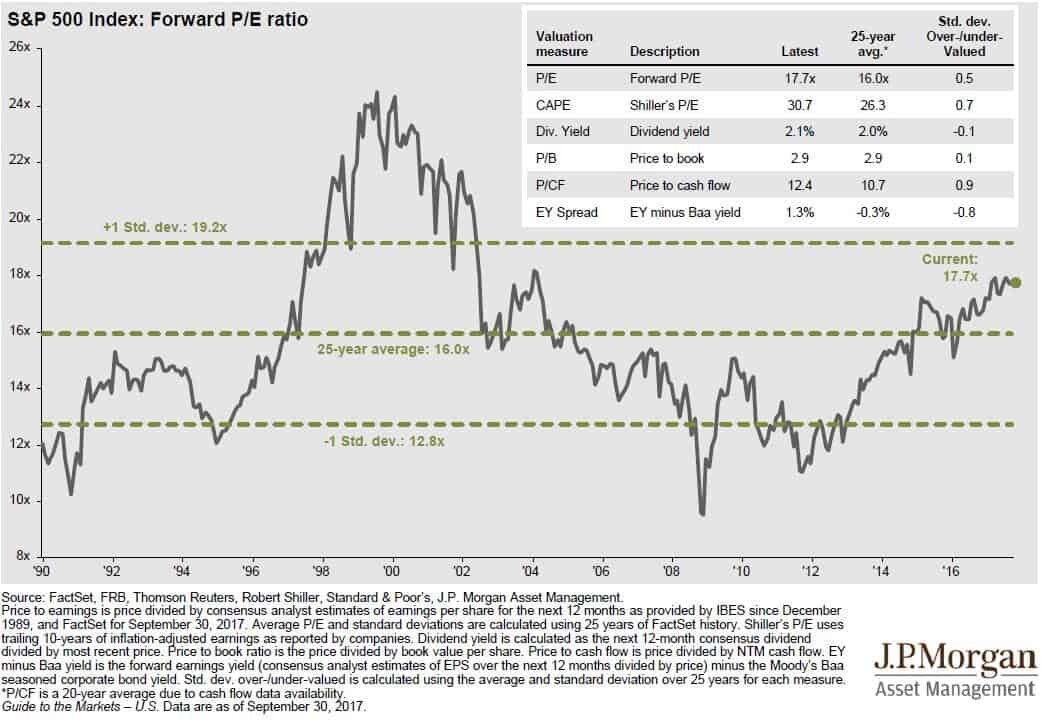
Conclusion, the U.S. stock market is not “cheap” and it’s a stretch to even classify it as “fairly valued”. I think we are well into what I would consider “expensive territory”. What does that mean for investors? You have to stay on your toes!!
Now, we have an anomaly in the mix with tax reform and history does not speak to how this could play out. If tax reform leads to an acceleration in corporate earnings, that in turn could slow the steady climb in the P/E ratio of the S&P 500 because earnings are the denominator in the formula. If stock prices and earnings are accelerating at the same pace, the stock market can go up without a further acceleration of the P/E ratio. Thus, keeping the stock market from becoming more overpriced and further increasing the risk of owning stocks in the S&P 500.
Summary
In 2018, investors should keep a close eye on the U.S. GDP growth rate, the level of spending by corporations and consumers, the volume of share buybacks by U.S. companies, and the P/E ratio of the S&P 500 Index.

About Michael.........
Hi, I’m Michael Ruger. I’m the managing partner of Greenbush Financial Group and the creator of the nationally recognized Money Smart Board blog . I created the blog because there are a lot of events in life that require important financial decisions. The goal is to help our readers avoid big financial missteps, discover financial solutions that they were not aware of, and to optimize their financial future.


