
Manufacturing Is Contracting: Another Economic Indicator Flashes Red
Yet another important economic indicator rolled over this week which has triggered a sell-off in the U.S. equity markets. Each month the Institute of Supply Management (“ISM”) issues two reports: Manufacturing ISM ReportNon-
Yet another important economic indicator rolled over this week which has triggered a sell-off in the U.S. equity markets. Each month the Institute of Supply Management (“ISM”) issues two reports:
Manufacturing ISM Report
Non-Manufacturing ISM Report
A reading above 50 indicates an expansion and a reading below 50 indicates a contraction. The Manufacturing ISM Report was released on Tuesday and it showed a reading of 47.8 for September indicating that manufacturing in the U.S. is beginning to contract. Not only was it the first contraction of the index within the last few years but the index reached a level not seen since 2009. In this article we will cover:
Why the ISM Index is important
Historically what happens to the stock market after the reading goes below 50?
What caused the unexpected drop in the ISM index?
Manufacturing trends around the globe and how they could impact the U.S. stock market
Why The ISM Index Is Important
The ISM Manufacturing Index tells us how healthy the manufacturing sector of the U.S. economy is. This index is also referred to as the Purchasing Managers Index (PMI) and I will explain why. The ISM issues a monthly survey to more than 300 manufacturing companies. The purchasing managers at these big manufactures are on the front line when it comes to getting a read on the pulse of business conditions. The survey includes questions on the trends in new orders, production, inventories, employment, supply chain, and backlog orders. The ISM assigns weightings to each metric, aggregates all of the responses together, and it results in the data point that signals either an expansion or a contraction.
If most of the manufactures in the U.S. have a ton of new orders, inventories are low, and they are looking to hire more people, that would most likely produce a reading above 50, implying that the outlook is positive for the U.S. economy as these big manufactures ramp up production to meet the increase in demand for their products.
On the other hand, if these surveys show a drop off in new orders, inventories are rising, or hiring has dropped off, that would most likely produce a reading below 50, implying that manufacturing and in turn the U.S. economy is slowing down. Analysts will use the ISM index to get a read on what corporate earnings might look like at the end of the quarter. If the index is dropping during the quarter, this could be foreshadowing a shortfall in corporate earnings for the quarter which the stock market will not find out about until after the quarter end.
Here is a historic snapshot of the ISM’s Manufactures Index:
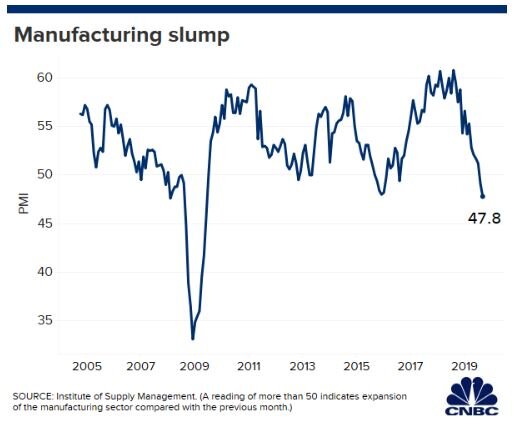
As you will see in the chart, manufacturing has been slowing over the course of the past year but up until September, it was still expanding at a moderate pace. For September, economists had broadly expected a reading of 50.4 but the ISM report produced a result of 47.8 signaling a contraction for the first time since 2016.
What Does This Mean For The Stock Market?
So in the past, when the ISM Index has gone below 50, what happened to the stock market? To answer that question, let’s start by looking at a chart that shows the correlation between the ISM Index and the S&P 500 Index:
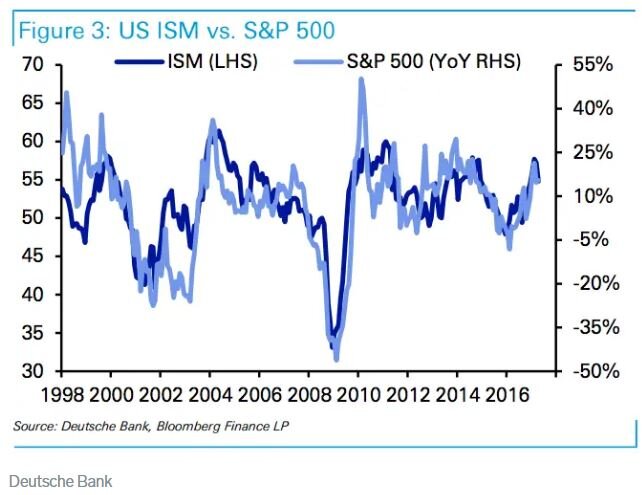
The dark blue line is the ISM index and the light blue line is the S&P 500 Index. Looking at this data, I would highlight the following points:
The ISM Index and the S&P 500 Index seem to move in lockstep. While the ISM might give you a preview of what quarterly earnings might look like, it does not give you a big forward looking preview of bad things to come. By the time the ISM index starts dropping, the stock market is already dropping with it.
We need more data. There have been a few times that the index has gone below 50 within the last 20 years and it has not been followed by a recession. Look at 2016 for example. The ISM index dropped below 50, but if you trimmed your equity positions at that point, you missed the big rally from January 2017 through September 2019. We need more data because historically multiple back to back months of readings below have signaled a recession.
If the index hits 45 or lower within the next few months, watch out below!!
What Caused The Most Recent Drop In The ISM Manufactures Index?
When it comes to unexpected market events, there is usually a wide mote of differing opinions. But it seems like the most recent drop could be attributed to a continued weakening of spending by U.S. businesses. While the U.S. consumer seems to still be strong and spending money, spending by businesses on big ticket items has tapered off over the past few months.
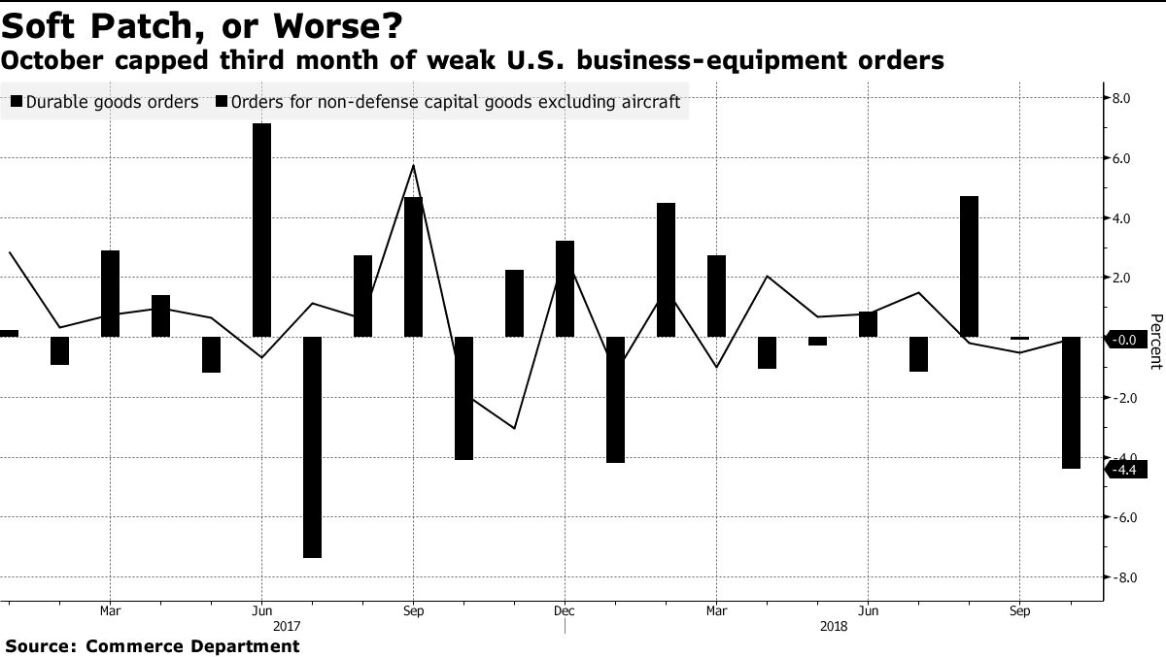
As you will see in the chart above, durable goods orders have dropped over the past two months which is the main barometer for business spending. When businesses are uncertain about the future, they tend to not spend money and business owners have no lack of things to be worried about going into 2020. The growth rate of the U.S. economy has been slowing, uncertainty surrounding global trade continues, and 2020 is an election year. One or more of these uncertainties may need to resolve themselves before businesses are willing to resume spending.
Global Manufacturing Trends
While manufacturing in the U.S. just started contracting in September, the picture is a little darker when we look at the manufacturing trends in other parts of the world. Below is a heat map that shows the PMI Index for countries all around the world. Here is how you read it:
Green is good. Manufacturing is expanding
Yellow is neutral: Manufacturing is flat
Red is bad: Manufacturing is contracting
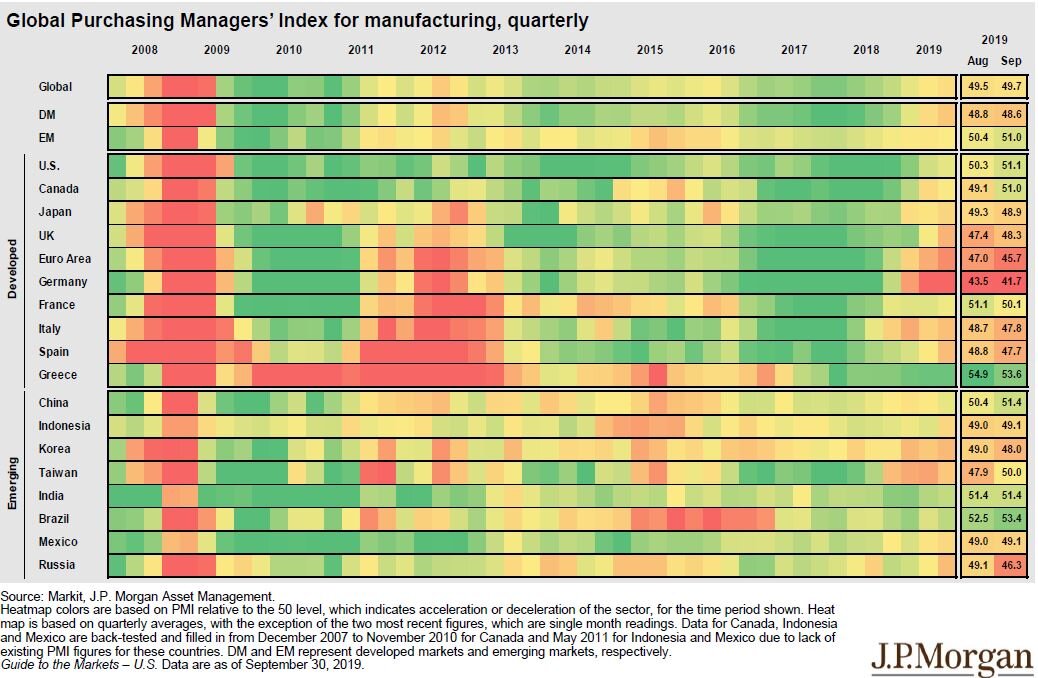
If you look at 2017 and 2018, there was a lot of green all around the world indicating that manufacturing was expanding around the globe. As we have progressed further into 2019, you are beginning to see more yellow and in some areas of the world there is red indicating contraction. Look at Germany in particular. There has been big change in the economic conditions in Europe and the global economy is very interconnected. The weakness that started in Europe seems to be spreading to other places throughout the globe.
ISM Non-Manufacturing Index
Now, you could make the argument that the U.S. is a services economy and it does not rely heavily on manufacturing, so how much does this contraction in manufacturing really matter? Well, if we switch gears to the ISM Non-Manufacturing Index which surveys the services sector of the US economy, the September report just came out with a reading of 52.6 compared to the 55.3 that the market was expecting. This is also down sharply from the 56.4 reported for August.
While the services sector of the U.S. economy is not contracting yet, it seems like the numbers may be headed in that direction.
What Investors Should Expect
There are pluses and minuses to this new ISM data. The contraction of the ISM Manufactures Index and the deceleration of the growth rate of the ISM Non-Manufactures Index in September is just another set of key economic indicators that are now flashing red. Implying that we may be yet another step closer to the arrival of the next recession in the U.S. economy.
The only small positive that can be taken away from this data is that the Fed now has the weak economic data that it needs to begin aggressively reducing interest rates in the U.S. which could boost stock prices in the short term. But investors have to be ready for the rollercoaster ride that the stock market may be headed towards as these two forces collide in the upcoming months.

About Michael……...
Hi, I’m Michael Ruger. I’m the managing partner of Greenbush Financial Group and the creator of the nationally recognized Money Smart Board blog . I created the blog because there are a lot of events in life that require important financial decisions. The goal is to help our readers avoid big financial missteps, discover financial solutions that they were not aware of, and to optimize their financial future.


What Is An Inverted Yield Curve?
Today, August 14, 2019, the main part of the yield curveinverted. This is an important event because an inverted yield curve hashistorically been a very good predictor of a coming recession. In this articlewe will review

Today, August 14, 2019, the main part of the yield curveinverted. This is an important event because an inverted yield curve hashistorically been a very good predictor of a coming recession. In this articlewe will review
What the yield curve is
What it means when the yield curve inverts
Historical data showing why it’s been a goodpredictor of recessions
What it means for investors today
Understanding the Yield Curve
The yield curve is an economic indicator that originates from the bond market. It’s basically a chart that shows the yield of government bonds at different durations. For example, the yield on a two-year treasury note versus a 10 year government bond. In a healthy economic environment, the curve is positively sloped as is illustrated by the chart below.

In a positively sloped yield curve, longer-term bonds have higher yields. Here’s a hypothetical example using CDs. Let’s say you go into that bank and you are trying to decide between buying a 1 year CD or a 5 year CD. In most cases you would naturally expect the 5 year CD to give you a higher level of interest because the bank is locking up your money for 5 years instead of 1 year. If a 1 year CD gives you 1% interest, you might expect a five-year CD to give you 3% interest in a bond market that has a positively sloped yield curve, because the further you go out in duration, the higher the current yield.
However, sticking to our hypothetical example using CD's, there are periods of time when you go into the bank and the 1 year CD has a higher interest rate than a 5 year CD. That would make you ask the obvious question, “Why would anyone to buy a 5 year CD at a lower interest-rate than a 1 year CD? You get a higher investment return on your money for the next year and you get your money back faster?”.
The answer is as such, in the bond market, investors willsometimes buy bonds for a longer duration at a lower current yield because theyexpect a recession to come. When arecession hits, typically the Federal Reserve will start lowering interestrates to help stimulate the economy. When that happens, interest ratestypically drop. Anticipating this drop in interest rates, bond investors are willingto buy bonds today that lock up their money for a longer period of time with alower yield because they expect interest rates to drop in the near future.
So, let’s use the hypothetical CD example again. You go into the bank and the 1 year CD rate is 3% and the 5 year CD rate is 2.5%. In an inverted yield curve situation, investors are buying those 5 year CD’s even though they have a lower interest-rate, because when the recession hits and the Fed starts lowering interest rates when that 1 year CD matures a year from now, the new rate on CD’s may be a 1 year CD at 1% and 1.5% on a 5 year CD. So from an investment standpoint today, it’s a better move to lock in your 2.5% interest rate for 5 years even though the yield is lower than the 1 year CD today. You can see in this example why an inverted yield curve is such a bearish signal for the markets.
Below is an illustration of an inverted yield curve:

It’s a Very Good Predicator of Recessions
When you look at the historical data, it shows how frequently an inverted yield curve has preceded a coming recession. Below is a chart that shows the spread between a 2 year government bond and a 10 year government bond. The yield curve is positively sloped when the blue line is above the dark black line. When the blue line falls below the dark black line, that means that the yield curve is inverted. The grey areas in the chart indicate recessions.

Today, the main part of the yield curve which means the 2year vs the 10 year bonds inverted. However, it’s important to point out that earlier in 2019, the yield onthe 10 year treasury bond dropped below the yield on the 3 month treasury note,so technically this is the second time the yield curve is inverted in 2019.
What Does That Mean for Investors?
If we use history as our guide, the inverted yield curve is a caution light for investors. Historically, the main question people ask next is, “How long after the yield curve inverts does the recession usually begin?”. Here is the chart:

As you can see, the problem with using this data to build an estimates timeline until the next recession is the variance in the data. Even though, in the past 5 recessions, the “average” period of time between the inversion of the yield curve and the subsequent recession was about 12 months, in 2 out of the 5 recessions, the inversion happened within 2 months of the beginning of the next recession. Timing the markets is very difficult and as we get into the later innings of this long economic expansion, the risks begin to mount. For this reason, it very important for investors to revisit their exposure to risk asset to make sure they are properly diversified.

About Michael……...
Hi, I’m Michael Ruger. I’m the managing partner of Greenbush Financial Group and the creator of the nationally recognized Money Smart Board blog . I created the blog because there are a lot of events in life that require important financial decisions. The goal is to help our readers avoid big financial missteps, discover financial solutions that they were not aware of, and to optimize their financial future.


The Top 4 Things That You Need To Know About The Trade War With China
The trade negotiations between the U.S. and China have been the center of the stock market’s attention for the past 6 months. One day it seems like they are close to a deal and then the next day both countries are launching new tariffs against each other. While many investors in the U.S. understand the trade wars from the vantage point of the United
The trade negotiations between the U.S. and China have been the center of the stock market’s attention for the past 6 months. One day it seems like they are close to a deal and then the next day both countries are launching new tariffs against each other. While many investors in the U.S. understand the trade wars from the vantage point of the United States, very few people understand China’s side of the equation. The more we learn about China’s motivation and viewpoint, the more we realize that this could be a very long, ugly, and drawn out battle. The main risk is if this battle is not resolved soon it could lead to a recession in the U.S. sooner than expected.
1: China Is Tired Of Being On The Losing End Of Trade Deals
When you look back through history, going as far back as the mid 1800’s, China has been on the losing end of many of it’s trade deals. To summarize that history, when you are a very poor country, and your economy is based primarily on exporting goods to other countries, those countries that are buying your goods have a lot of power over you. If you don’t agree to their terms, they stop buying from you, and your economy collapses. China’s history is filled with trade deals where terms were dictated to them so they feel like they have been taken advantage of.
Now that China has the fastest growing middle class in the world, they are less reliant on trade to fuel their economy. Also, the size of China’s economy is growing extremely fast. The size of a country’s economy is measured by their GDP (Gross Domestic Product). A country’s annual GDP is the dollar value of all the goods and services that are produced in that country in a single year. It’s fascinating to see how quickly China has grown over the past 20 years compared to the U.S.
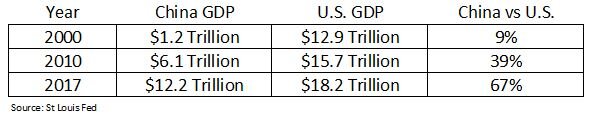
The numbers speak for themselves. In 2000, the size of China’s economy was only 9% of the U.S. economy. In only a 17-year period, China’s economy is now 67% the size of the U.S. economy and based on current GDP data from both countries, they are still growing at a pace that is about three times faster than the U.S. economy.
China seems to be making a statement to the world in these negotiations that terms will no longer be dictated to them. China now has the economic firepower to negotiate terms as an equal which could drag out the trade negotiations longer than investors expect.
2: Tariff Impact On China vs U.S.
In May, the U.S. raised the tariffs on select goods imported from China from 10% to 25%. China then retaliated by raising their tariffs on US imports from 10% to 25%. We have heard in the news that these tariffs hurt China more than they hurt the U.S. In the short term this would seem to be true. The U.S. imports about $500 Billion in goods from China compared to the $100 Billion in goods that China imports from the U.S.
But the next question is, “if it hurts China more, does it hurt them a lot or a little from the standpoint of their overall economy?” The answer; not as much as you would think. The chart below shows China’s total exports as a percentage of their GDP.
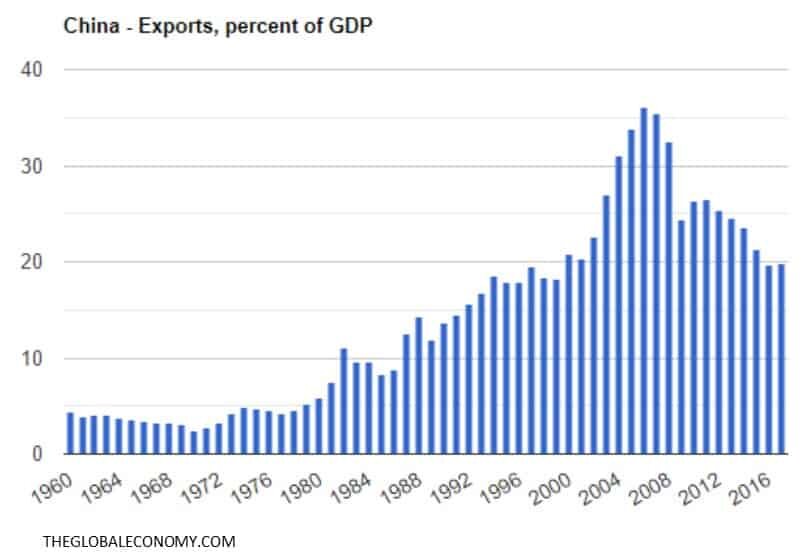
Back in 2007, exports contributed to over 35% of China’s total GDP. As of 2018, exports represent less than 20% of China’s annual GDP. Of their total exports about 18% go to the U.S. So if you do the math, exports to the U.S. equal about 3.6% of China’s total annual GDP. Personally, I was surprised how low that number was. Based on what we have been hearing about the negotiations and how the U.S. is in such a strong position to negotiate, I would have expected the export number to be much larger, but it’s less than 4% of their total GDP. This again may lead investors to conclude that the volatility we are seeing in the markets surrounding the trade negotiations may be an unwelcomed guest that is here to stay for longer than expected.
3: The Impact of Tariffs On The US Economy
While the U.S. is using tariffs as a negotiating tool, it may be the U.S. consumer that ends up paying the price. That washing machine that was $500 in April may end up costing $625 in June. Companies that are importing goods from China and selling them to the U.S. consumer will have to decide whether to absorb the cost of the tariffs which would decrease their net profits or pass those costs onto the consumer in the form of higher prices.
The other problem that you can see in this example is tariffs are inflationary. Meaning they push prices higher. The Fed announced at their last meeting that they were content with keeping interest rates where they are for the remainder of 2019 given the slowing economic growth rate and tame inflation. But if tariffs spark inflation, they may have to reverse course and raise rates unexpectedly to keep the inflation rate under control which would be bad news for the stock market.
4: Global uncertainty
Companies typically do not invest or make plans for growth if the global economy is filled with uncertainty, they pause and wait for the smoke to clear. The longer the trade uncertainty between the U.S. and China persists, the more downward pressure there will be on global economic growth around the world.
Summary
It’s unclear how this situation between the U.S. and China will play out and how long it will be before there is a resolution. In times of uncertainty, investors need to be very aware of how these trends could potentially impact their investment portfolio and it may be the appropriate time to begin building some defensive positions if you have not done so already.
About Michael……...
Hi, I’m Michael Ruger. I’m the managing partner of Greenbush Financial Group and the creator of the nationally recognized Money Smart Board blog . I created the blog because there are a lot of events in life that require important financial decisions. The goal is to help our readers avoid big financial missteps, discover financial solutions that they were not aware of, and to optimize their financial future.


Volatility, Market Timing, and Long-Term Investing
For many savers, the objective of a retirement account is to accumulate assets while you are working and use those assets to pay for your expenses during retirement. While you are in the accumulation phase, assets are usually invested and hopefully earn a sufficient rate of return to meet your retirement goal. For the majority,
Volatility, Market Timing, and Long-Term Investing
For many savers, the objective of a retirement account is to accumulate assets while you are working and use those assets to pay for your expenses during retirement. While you are in the accumulation phase, assets are usually invested and hopefully earn a sufficient rate of return to meet your retirement goal. For the majority, these accounts are long-term investments and there are certain investing ideas that should be taken into consideration when managing portfolios. This article will discuss volatility, market timing and their role in long-term retirement accounts.
“Market timing is the act of moving in and out of the market or switching between asset classes based on using predictive methods such as technical indicators or economic data” (Investopedia). In other words, trying to sell investments when they are near their highest and buy investments when they are near their lowest. It is difficult, some argue impossible, to time the market successfully enough to generate higher returns. Especially over longer periods. That being said, by reallocating portfolios and not experiencing the full loss during market downturns, investors could see higher returns. When managing portfolios over longer periods, this should be done without the emotion of day to day volatility but by analyzing greater economic trends.
So far, the stock market in 2018 has been volatile; particularly when compared to 2017. Below are charts of the S&P 500 from 1/1/2018 – 10/21/2018 and the same period for 2017.
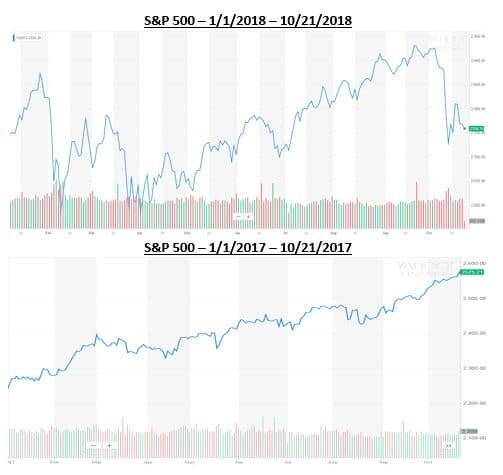
Source: Yahoo Finance. Information has been obtained from sources believed to be reliable and are subject to change without notification.
Based on the two charts above, one could conclude the majority of investors would prefer 2017 100% of the time. In reality, the market averages a correction of over 10% each year and there are years the market goes up and there are years the market goes down. Currently, the volatility in the market has a lot of investors on edge, but when comparing 2018 to the market historically, one could argue this year is more typical than a year like 2017 where the market had very little to no volatility.
Another note from the charts above are the red and green bars on the bottom of each year. The red represent down days in the market and the green represent up days. You can see that even though there is more volatility in 2018 compared to 2017 when the market just kept climbing, both years have a mixture of down days and up days.
A lot of investors become emotional when the market is volatile but even in the midst of volatility and downturns, there are days the market is up. The chart below shows what happens to long-term portfolio performance if investors miss the best days in the market during that period.
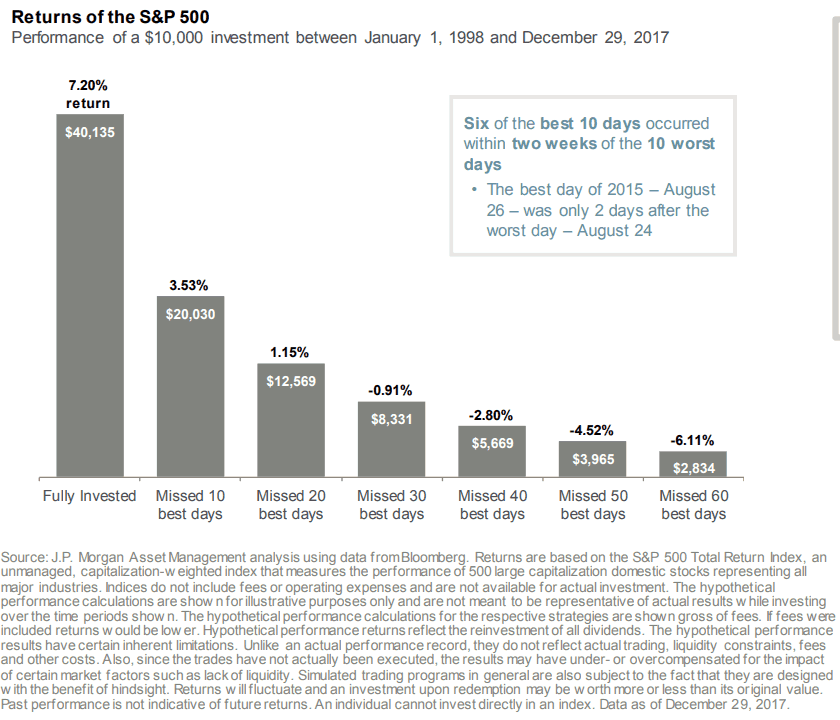
Source: JP Morgan. Information has been obtained from sources believed to be reliable and are subject to change without notification.
Two main takeaways from the illustration above are; 1) missing the best days over a period in the market could have a significant impact on a portfolios performance, and 2) some of the best days in the market over the period analyzed came shortly after the worst days. This means that if people reacted on the worst days and took their money from the market then they likely missed some of the best days.
Market timing is difficult over long periods of time and making drastic moves in asset allocation because of emotional reactions to volatility isn’t always the best strategy for long-term investing. Investors should align their portfolios taking both risk tolerance and time horizon into consideration and make sure the portfolio is updated as each of these change multiple times over longer periods.
When risk tolerance or time horizon do not change, most investors should focus on macro-economic trends rather than daily/weekly/monthly volatility of the market. Not experiencing the full weight of stock market declines could generate higher returns and if data shows the economy may be slowing, it could be a good time to take some “chips off the table”. That being said, looking at past down markets, some of the best days occur shortly after the worst days and staying invested enough to keep in line with your risk tolerance and time horizon could be the best strategy.
It is difficult to take the emotion out of investing when the money is meant to fund your future needs so speaking with your financial consultant to review your situation may be beneficial.
About Rob……...
Hi, I’m Rob Mangold. I’m the Chief Operating Officer at Greenbush Financial Group and a contributor to the Money Smart Board blog. We created the blog to provide strategies that will help our readers personally, professionally, and financially. Our blog is meant to be a resource. If there are questions that you need answered, please feel free to join in on the discussion or contact me directly.


The Stock Market Dropped 800 Points Today. Is This A Warning Sign?
There was a large sell off in the stock market today. The Dow, S&P 500, and Nasdaq all dropped by over 3% in today’s trading session. After a long bull rally, big drops in the stock market often lead investors to the question: “Is this big drop in the market the beginning of something worse to come?” To answer that question, you have to identify what
There was a large sell off in the stock market today. The Dow, S&P 500, and Nasdaq all dropped by over 3% in today’s trading session. After a long bull rally, big drops in the stock market often lead investors to the question: “Is this big drop in the market the beginning of something worse to come?” To answer that question, you have to identify what changed and more importantly what did not change in the economy and the markets over the past two weeks.
Interest Rates Have Spiked
If there is a single indicator or event that we can point to that has triggered the recent sell-off, it would be the dramatic rise in interest rates. Between September 17th and October 10th, the yield on a 10 year government bond went from 3% to 3.23%. Now that may not sound like a big move but interest rates on a 10 year bond moving by 0.23% in less than a month is a big move.
When interest rates go higher, it increases the cost associated with borrowing money. Mortgage News Daily reported yesterday that the average interest rate on a 30-year fixed mortgage is currently at 5% compared to just below 4% a year ago. As interest rates move higher, it may prevent some individuals from being able to finance a mortgage, get a car loan, or it may cause a business to forgo taking that loan to expand their business.
When interest rates rise gradually as they have over the past three years it historically does not prompt a big sell off because those higher rates are slowly integrated into the economy. The yield on the 10 Year Treasury bottomed in May 2016 at 1.46% and has been steadily climbing ever since. In May 2018, the 10 Year Treasury Bond was yielding around 2.80% so it took 2 years from the yield to go up by 1.34% compared to the 0.23% jump that we experience over the past 2 weeks.
Will The Rise In Rates Continue?
We could see a further rise in rates over the next few weeks but at this point, we have probably seen the majority of the big move up. Even though the Fed is expected to raise rates in December and possibly three to four times in 2019, there are other forces at work that are anchoring our rates to lower levels.
The first being the lower level of global interest rates. As you will see on the chart below, as of September 30, 2018, the U.S. is issuing 10 year bonds at 3.46%. When you look at other “credit worthy” counties like Germany, they are issuing their 10 year bonds at 0.69%. So when foreign countries have cash to park, they will gladly take the 3.46% interest rate for 10 years as opposed to 0.69% for 10 years. This makes the demand for US debt high around the global and we are not pressured to issue our debt at higher rates to entice buyers because our rates are already a lot higher than debt being issued by other governments around the world.
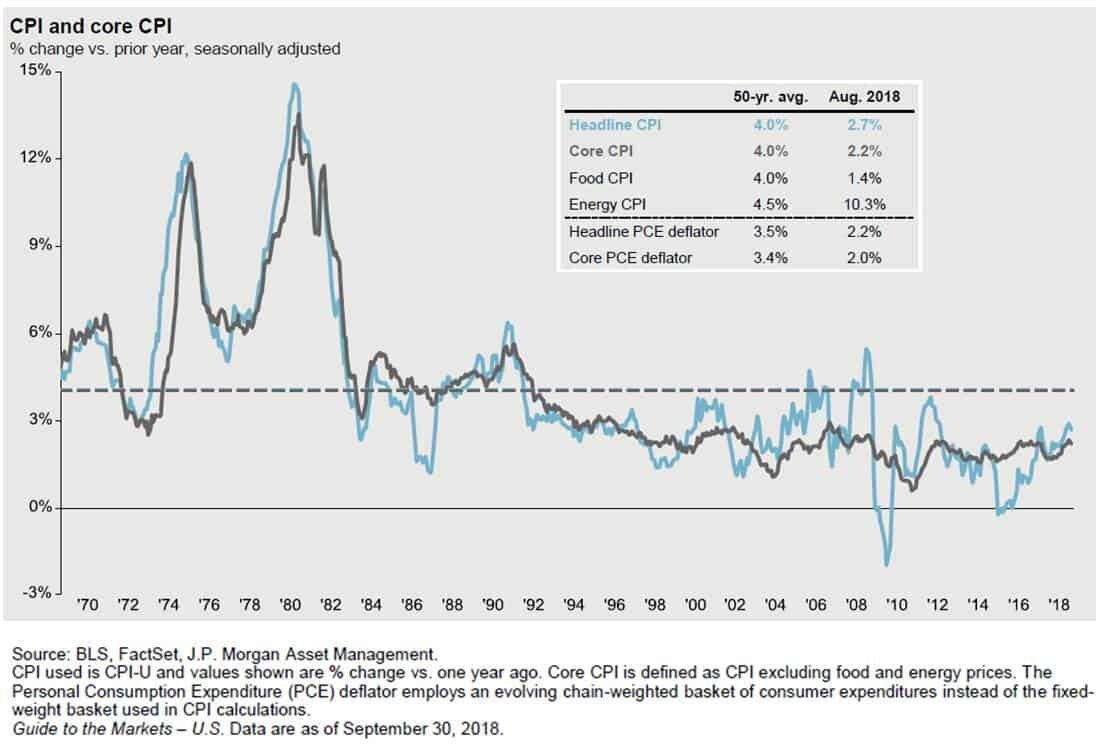
The second reason that rates are most likely to remain at lower levels over the next few months is tame inflation. When inflation rises above the Fed’s 2% target rate, they often respond by raising the Fed Funds Rate either more frequently or by larger increments. As you will see in the chart below, the annual year over year change in the core Consumer Price Index (CPI) as of August 2018, which is the Fed’s primary measure of inflation, was only up 2.2%. Very close to the Fed’s target range so the Fed is not behind the inflation curve. If inflation was roaring ahead at 3% or higher it would probably prompt the Fed to raise the Fed Funds rate faster than the market expects.
Rates Are Still At Healthy Levels
Even though interest rates are rising, they are still at historically low levels. Which then prompts the question: “At what level do interest rates become problematic?” If we use history as a guide, it would seem that once the yield on the U.S. 10 year treasury bond reach 4.50%, returns from the stock market come under pressure in the two year following the breach of that threshold. But historically, when rate are where they are now and moving higher, the stock market has traditionally moved higher as interest rates were rising.
See the chart below which illustrated the correlation between interest rates and stock prices. Each dot on this chart represents a 2 year return from the stock market between 1963 and 2018. If there is a positive correlation, that means interest rates are moving higher and stock prices are moving higher at the same time. This is illustrated with a dot placed above the line in the chart. Those are favorable environments and it makes sense because in the early stages of a rising rate environment the Fed is raising rates because the economy is healthy but rates are not higher enough yet where they are harming the growth rate of the economy.
Visa versa when the dots are below the line that means that there is a negative correlation between interest rates meaning interest rates are going up and stock prices are going down.

If you look at where 3.25% would be on the x axis you will not see any dots below the line. That would imply that between 1963 – 2018 when the interest rate on the 10 year treasury bond were at the current level and moving higher, two years later stock prices were always higher. Otherwise you would see a dot below the line. If the stock market were to be lower 2 years from now and interest rates are at their current rates and moving higher, it would be the first time that has ever happened within the last 55 years.
Could stock prices be lower 2 year from now? Sure they could but if you use history as a guide, it would suggest that such an event would have a low probability of occurrence.
Conclusion
As of right now, it would seem that the recent sell-off in the U.S. stock market was triggered by an unexpected rise in interest rates over the past two week. While higher interest rates are often revered as an unwelcome guest to bull markets, history would suggest that interest rates have not reached levels that would prompt an end to the current economic expansion. We would also add that there are other forces at work such as tame inflation rates and a lower global interest rate environment that may prevent a further dramatic increase in rates from the current levels.
About Michael……...
Hi, I’m Michael Ruger. I’m the managing partner of Greenbush Financial Group and the creator of the nationally recognized Money Smart Board blog . I created the blog because there are a lot of events in life that require important financial decisions. The goal is to help our readers avoid big financial missteps, discover financial solutions that they were not aware of, and to optimize their financial future.

How Could The Midterm Elections Impact The Stock Market?
The most common question that I have been asked over the past few weeks is: “If the Republicans lose control of either the House or the Senate in November, what impact do you think that will have on the markets?” How much the stock market may go up or down in the days leading up to or directly after the midterm elections, regardless of the result, is

The most common question that I have been asked over the past few weeks is: “If the Republicans lose control of either the House or the Senate in November, what impact do you think that will have on the markets?” How much the stock market may go up or down in the days leading up to or directly after the midterm elections, regardless of the result, is anyone’s guess. But if we use history as a guide, investors will probably realize that this situation is not uncommon, and there is probably less to worry about than investors think.
A Shift In Power Is Not Uncommon
If we look back at every midterm election going back to 1934, on average, the president’s party has lost 30 seats in the House and 4 seats in the Senate during a midterm election year. There are only three years in history that the president’s party actually gained seats due to a midterm election: 1934, 1998, and 2002. So if the Republican’s lose seats in Congress in November that would really be the norm instead of the exception to the rule. If it is in fact the norm, investors have to ask themselves, “how much of that shift in power is already priced into the market?”
How Does The Stock Market React During Midterm Election Years?
In attempting to answer this question there are two components: volatility and return. As many would guess, during midterm election years volatility typically rises leading up to the elections. Looking at the S&P 500 Index going all the way back to 1970, the volatility levels in the stock market are typically 10%+ more volatile when compared to the levels of volatility in the S&P 500 when there are no midterm elections.
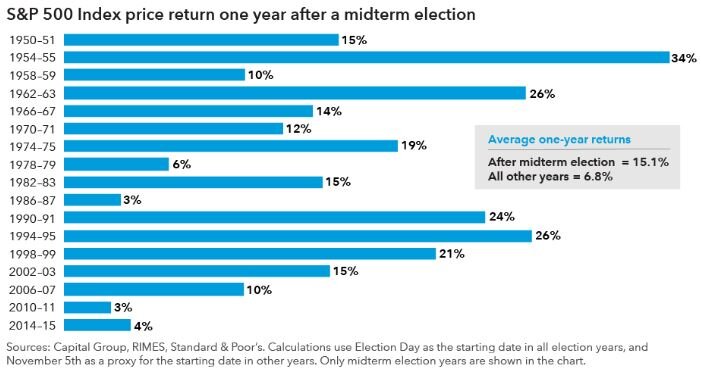
From a return standpoint, the results speak for themselves. Below is a bar chart that shows the return of the S&P 500 Index 12 months following the midterm elections 1950 – 2015:
stock market returns
12 months after a midterm elections the S&P 500 Index averages a 15.1% annual return. In all other years the stock market averages a 6.8% annual return.
But What About A Flip In Control
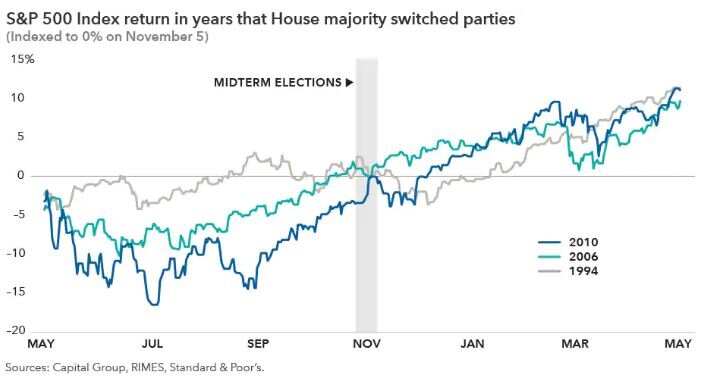
It’s one things to lose seats in Congress but do we have to worry more because it’s not just about losing seats this year, it’s about a shift in power within Congress? Again, using history as a guide, let’s look at what has happened in the past. The House majority switched parties as a result of midterm elections in 1994, 2006, and 2010. In all three of those years where a shift in power was in the cards, the stock market was either down or flat leading up the midterm elections in November. However, in all three of those years the stock market was significantly higher 12 months after the midterm elections. See the chart below:
past returns of S&P 500 Index
The Stock Market Cares More About The Economy
If you asked me which environment I would choose to invest in:
A) Stable political environment and bad economy
B) Unstable political environment and good economy
I would probably choose “B” because at the end of the day the stock market is historically driven by the economy. While politics have the power to influence the economy, if we end up in a gridlock situation after the November elections, that is also the norm. Going back to 1948, we have had a “divided government” 61% of the time. As we get closer to the elections, there is a very good chance that the level of volatility in the markets will increase because the stock market doesn’t like uncertainty. But if we use history as our guide, the 12 months following the midterm elections may reward investors that stay the course.
About Michael……...
Hi, I’m Michael Ruger. I’m the managing partner of Greenbush Financial Group and the creator of the nationally recognized Money Smart Board blog . I created the blog because there are a lot of events in life that require important financial decisions. The goal is to help our readers avoid big financial missteps, discover financial solutions that they were not aware of, and to optimize their financial future.
Patience Should Reward Investors In 2018
Bottom line, the first half of 2018 was a tough pill to swallow for investors. They had to fight a constant rollercoaster. Volatility was high, returns were low, and the news was dominated with fears of trade wars. This environment has left investors questioning if we are on the eve of the next recession. Well I have good news. While trade wars have driven
Bottom line, the first half of 2018 was a tough pill to swallow for investors. They had to fight a constant rollercoaster. Volatility was high, returns were low, and the news was dominated with fears of trade wars. This environment has left investors questioning if we are on the eve of the next recession. Well I have good news. While trade wars have driven fear into the hearts of investors, during that same time period corporate earnings have been soaring and the U.S. economy has continued its growth path. For these reasons, disciplined investors may have good things waiting for them in the second half of 2018.
Coming Off A Big Year
As of the end of the second quarter, the S&P 500 Index was up 2.6% year to date. So why does 2018 seem like such a disappointment? You have to remember that 2017 was a huge year with the added benefit of very little volatility. It was a straight march up the entire year.
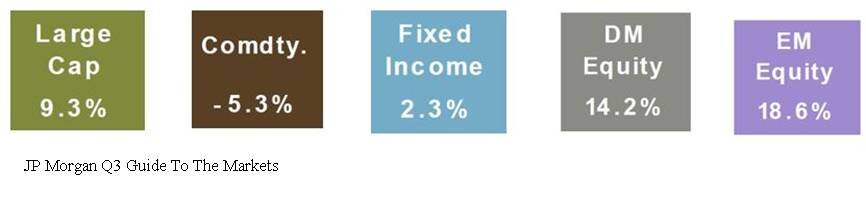
First, let’s compare the performance of the various asset classes in the first half of 2017 versus to first half of 2018. Below are the returns for the various assets classes in the first half of 2017:
Here are those same asset classes in the first half of 2018.
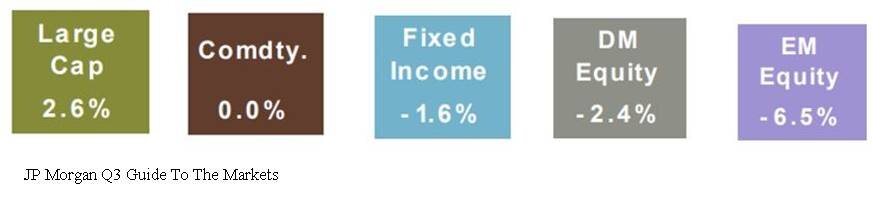
Obviously a huge difference. At this time last year, the S&P 500 Index was already up 9.3% for the year compared to 2.6% in 2018. International and emerging market equities were up over 14% in the first half of 2017. In 2018, those same international stocks were down over 2%. One might guess that bonds would preform better in a year with muted stock returns. Well, one would be wrong because the Barclay’s US Aggregate Bond Index was down 1.6% in the first 6 months of 2018.
Volatility Is Back
Not only has the first half of 2018 been a return drought but the level of volatility in the stock market has also spiked. In the first 6 months of 2017, the S&P 500 Index only had 2 trading days where the stock market moved plus or minus by more than 1% in a day. Guess how many trading days there were in the first half of 2018 where the S&P 500 Index moved up or down by more than 1% in a day.
The answer: 25 Days
That’s a 1,250% increase over 2017. No wonder everyone’s nerves are rattled. So the up 2% YTD in the stock market feels more like a down 10% because a lot has happened in a short period of time. Plus, the only big positive month for the stock market was in January which feels like forever ago.
Recency Bias
Investors are largely suffering for what we call in the investment industry as “recency bias”. In other words, what happened recently has now become the rule in the minds of investors. Investors are largely using 2017 as their measuring stick for 2018 performance and volatility. While it would seem that the dramatic increase in the level of volatility this year would classify 2018 as an abnormally volatile year, it’s actually 2017 that was the anomaly. Below is a chart that shows the annual return of the S&P 500 Index since 1980. The dots below each annual return are the market corrections that took place as some point during each calendar year.
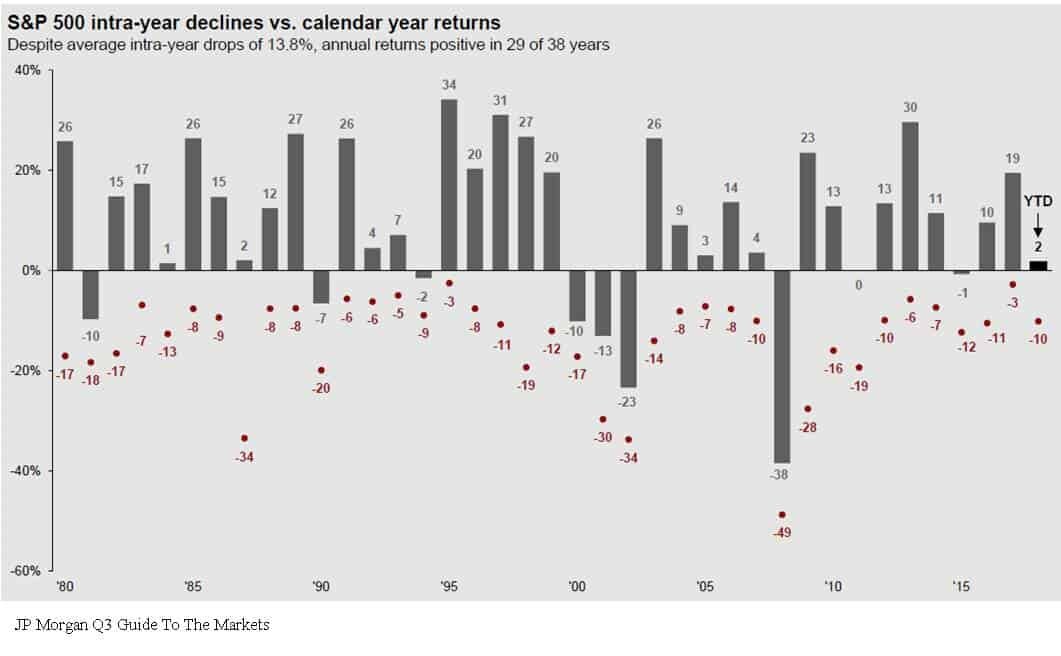
Based on historical data, it’s “normal” for the market to experience on average a 10% correction at some point during the year. Now look at 2017, the stock market was up 19% for the year but the largest correction during the year was 3%. That’s abnormal. By comparison, even though we are only half way through 2018, we have already experienced a 10% correction and as of June 30th, the S&P 500 Index is up 2% for the year.
Earnings Are King
Behind the dark clouds of the media headlines and the increased level of volatility this year is the dramatic increase in corporate earnings. Corporate earnings have not only increased but they have leaped forward. Take a look at the chart below:
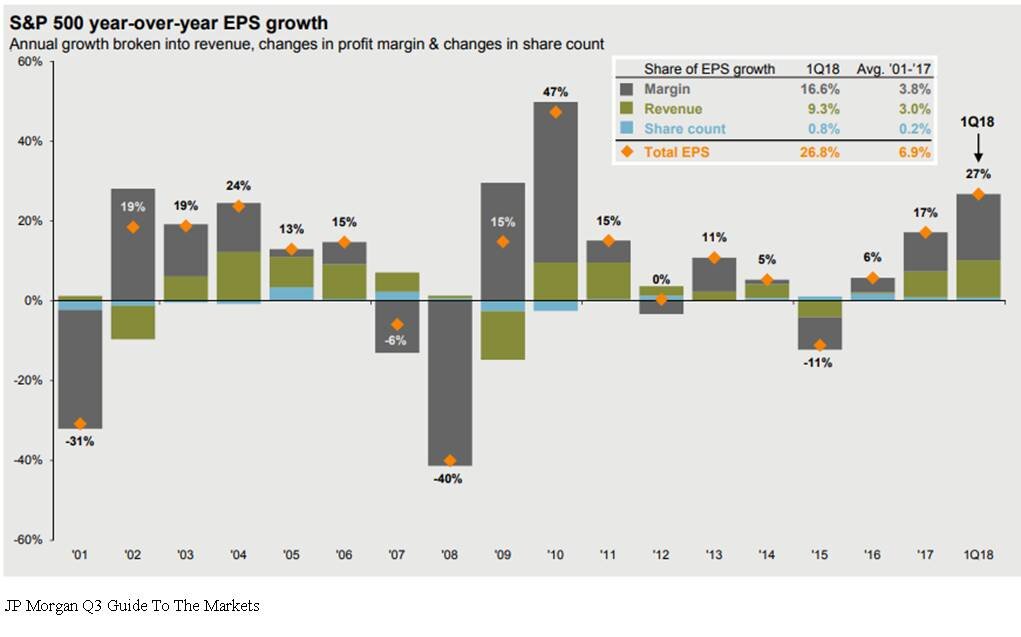
The market traditionally follows earnings. The earnings per share for the S&P 500 Index in 2017 was 17% which is a strong number historically. In the first quarterly of 2018, the year-over-year earnings per share growth was up 27%. That is a surge in corporate earnings. But you would have no idea looking at the meager 2% YTD return from the stock market this year. Pair that with the fact that the P/E of the S&P 500 is around 16 which is in line with its 20 year historic average. See the chart below:
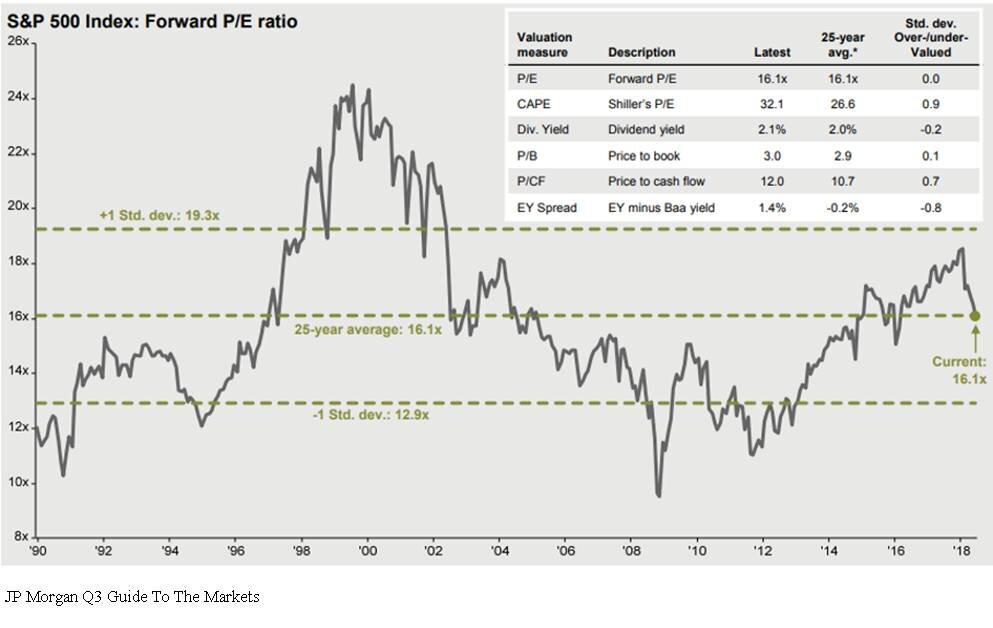
Even though it has been a long expansion, the market is not “over priced” by historic terms. If the stock market is fairly valued and corporate earnings are accelerating, one could make the case that the stock market has some catching up to do in the second half of the year.
The Chances Of A Recession Are Low
With the yield curve still positively sloped and the Composite Index of Leading Indicator, not only positive, but accelerating, a recession within the next 6 to 12 months seems unlikely. It’s like wandering through a jungle. When you are on the ground, the jungle is intimidating, there are plenty of things to be afraid of, and it’s tough to know which direction you should be walking. As investment advisors it’s our job to climb the tallest tree to get above the jungle to determine which way we should be walking.
In summary, 2018 has been an emotional roller coaster for investors. But making sound investment decision is about putting your emotions and gut feelings aside and looking at the hard economic data when making investment decisions. That data is telling us that we may very well be witnessing the soon to be longest economic expansion since 1900. The U.S. economy is strong, tax reform is boosting corporate earnings, interest rates are rising but are still at benign levels, and consumer sentiment is booming. In the later stages of an economic cycle, higher levels of volatility will be here to stay which will test the patience of investors. But overall the second half of the year could prove to be beneficial for investors that choose to climb the trees.
About Michael.........
Hi, I’m Michael Ruger. I’m the managing partner of Greenbush Financial Group and the creator of the nationally recognized Money Smart Board blog . I created the blog because there are a lot of events in life that require important financial decisions. The goal is to help our readers avoid big financial missteps, discover financial solutions that they were not aware of, and to optimize their financial future.

We Are Sleep Walking Into The Next Crisis
The U.S. economy is headed down a dangerous path. In our opinion it has nothing to do with the length of the current economic cycle, valuations, interest rates, or trade wars. Instead, it has everything to do with our mounting government deficits. We have been talking about the federal budget deficits for the past ten years but when does that

The U.S. economy is headed down a dangerous path. In our opinion it has nothing to do with the length of the current economic cycle, valuations, interest rates, or trade wars. Instead, it has everything to do with our mounting government deficits. We have been talking about the federal budget deficits for the past ten years but when does that problem really come home to roost?
A Crisis In Plain Sight
An economic crisis is often easier to spot than you think if you are looking in the right places. Most of the time it involves identifying a wide spread trend that has evolved in the financial markets and the economy, shutting out all of the noise, and then applying some common sense. Looking at the tech bubble, people were taking home equity loans to buy tech stocks that they themselves did not understand. During the housing bubble people that were making $40,000 per year were buying homes for $500,000 and banks were giving loans with no verification of income. Both of the last two recessions you could have spotted by paying attention to the trends and applying some common sense.
Government Debt
Looking at the data, we think there is a good chance that the next economic crisis may stem from reaching unsustainable levels of government debt. Up until now we have just been talking about it but my goal with this article is to put where we are now in perspective and why this "talking point" may soon become a reality.
Debt vs GDP
The primary measuring stick that we use to measure the sustainability of the U.S. debt level is the Debt vs GDP ratio. This ratio compares the total debt of the U.S. versus how much the U.S. economy produces in one year. Think of it as an individual. If I told you that someone has $100,000 in credit card debt, your initial reaction may be “wow, that’s a lot of debt”. But then what if I told you that an individual makes $1,000,000 per year in income? That level of debt is probably sustainable for that person since it’s only 10% of their gross earnings, whereas that amount of credit card debt would render someone who makes $50,000 per year bankrupt.
Our total gross federal deficit just eclipsed $21 trillion dollars. That’s Trillion with a “T”. From January through March 2018, GDP in the U.S. was running at an annual rate of $19.965 trillion dollars (Source: The Balance). Based on the 2018 Q1 data our debt vs GDP ratio is approximately 105%. That’s big number.
The Safe Zone
Before I start throwing more percentages at you let's first establish a baseline for what's sustainable and not sustainable from a debt standpoint. Two Harvard professors, Reinhart and Rogoff, conducted a massive study on this exact topic and wrote a whitepaper titled "Growth in a Time of Debt". Their study aimed to answer the question "how much debt is too much for a government to sustain?" They looked at historic data, not just for the U.S. but also for other countries around the world, to determine the correlation between various levels of Debt vs GDP and the corresponding growth or contraction rate of that economy. What they found was that in many cases, once a government's Debt vs GDP ratio exceeded 90%, it was frequently followed by a period of either muted growth or economic contraction. It makes sense. Even though the economy may still be growing, if you are paying more in interest on your debt then you are making, it puts you in a bad place.
Only One Time In History
There has only been one other time in U.S. history that the Debt vs GDP ratio has been as high as it is now and that was during World War II. Back in 1946, the Debt vs GDP ratio hit 119%. The difference between now and then is we are not currently funding a world war. I make that point because wars end and when they end the spending drops off dramatically. Between 1946 and 1952, the Debt vs GDP ratio dropped from 119% to 72%. Our Debt vs GDP ratio bottomed in 1981 at 31%. Since then it has been a straight march up to the levels that were are at now. We are not currently financing a world war and there is not a single expenditure that we can point to that will all of a sudden drop off to help us reduce our debt level.
Spending Too Much
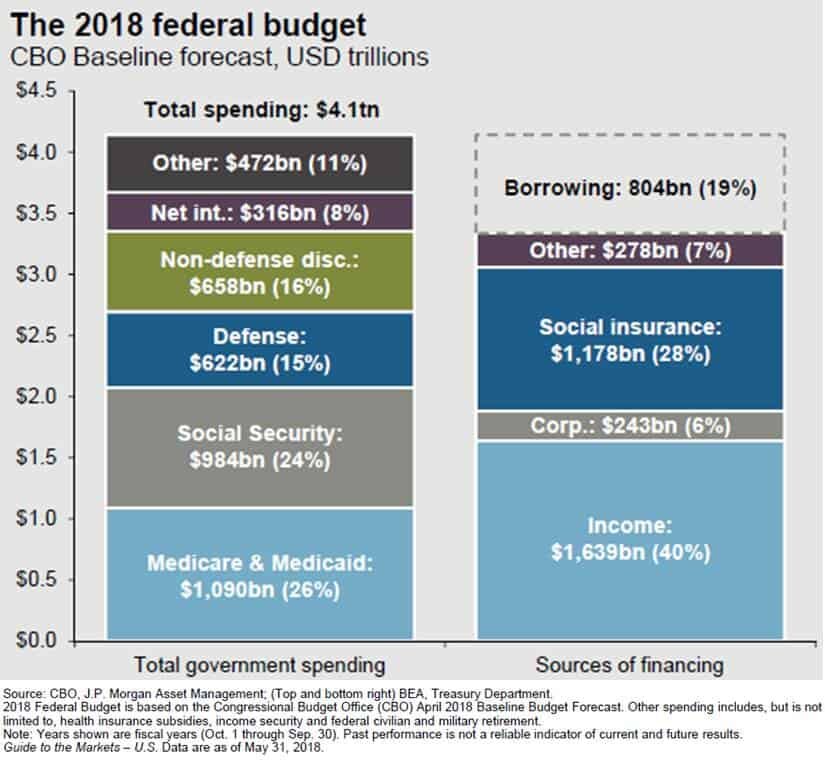
So what is the United States spending the money on? Below is a snapshot of the 2018 federal budget which answers that question. As illustrated by the spending bar on the left, we are estimated to spend $4.1 trillion dollars in 2018. The largest pieces coming from Social Security, Medicare, and Medicaid.
federal deficit
The bar on the right illustrates how the U.S. intends to pay for that $4.1 trillion in spending. At the top of that bar you will see “Borrowing $804 Bn”. That means the Congressional Budget Office estimates that the U.S. will have to borrow an additional $804 billion dollars just to meet the planned spending for 2018. With the introduction of tax reform and the infrastructure spending, the annual spending amount is expected to increase over the next ten years.
Whether you are for or against tax reform, it’s difficult to make the argument that it’s going to “pay for itself in the form of more tax as a result of greater economic growth.” Just run the numbers. If our annual GDP is $19.9 Trillion per year, our 3% GDP growth rate I already factored into the budget numbers, to bridge the $804B shortfall, our GDP growth rate would have to be around 7% per year to prevent further additions to the total government debt. Good luck with that. A 7% GDP growth rate is a generous rate at the beginning of an economic expansion. Given that we are currently in the second longest economic expansion of all time, it’s difficult to make the argument that we are going to see GDP growth rates that are typically associated with the beginning of an expansion period.
Apply Common Sense
Here’s where we apply common sense to the debt situation. Excluding the financing of a world war, the United State is currently at a level of debt that has never been obtained in history. Like running a business, there are only two ways to dig yourself out of debt. Cut spending or increase revenue. While tax reform may increase revenue in the form of economic growth, it does not seem likely that the U.S. economy is at this stage in the economic cycle and be able to obtain the GDP growth rate needed to prevent a further increase in the government deficits.
A cut in spending, in its simplest form, means that something has to be taken away. No one wants to hear that. The Republican and Democratic parties seem so deeply entrenched in their own camps that it will make it difficult, if not impossible, for any type of spending reform to take place before we are on the eve of what would seem to be a collision course with the debt wall. Over the past two decades, the easy solution has been to “just borrow more” which makes the landing even harder when we get there.
Answering the “when” question is probably the most difficult. We are clearly beyond what history has revered as the “comfort zone” when to comes to our Debt vs GDP ratio. However, the combination of the economic boost from tax reform and infrastructure spending in the U.S., the accelerating economic expansion that is happening outside of the U.S., and the low global interest rate environment, could continue to support growth rates even at these elevated levels of government debt.
Debt is tricky. There are times when it can be smart accept the debt, and times where it isn’t helpful. As we know from the not too distant past, it has the ability to sustain growth for an unnaturally long period of time but when the music stops it gets ugly very quickly. I’m not yelling that the sky is falling and everyone needs to go to cash tomorrow. But now is a good time to evaluate where you are risk wise within your portfolio and begin having the discussion with your investment advisor as to what an exit plan may look like if the U.S. debt levels become unsustainable and it triggers a recession within the next five years.
About Michael.........
Hi, I’m Michael Ruger. I’m the managing partner of Greenbush Financial Group and the creator of the nationally recognized Money Smart Board blog . I created the blog because there are a lot of events in life that require important financial decisions. The goal is to help our readers avoid big financial missteps, discover financial solutions that they were not aware of, and to optimize their financial future.

