What Happened The Last Time The Dow Dropped By More Than 4% In A Day?
Yesterday was an “ouch”. The Dow Jones Industrial average dropped by more than 1000 points resulting in a 4.60% drop in the value of the index. While yesterday marked the largest “point” decline in the history of the Dow Jones Index, it was not anywhere near the largest percentage decline which is the metric that we care about.

Yesterday was an “ouch”. The Dow Jones Industrial average dropped by more than 1000 points resulting in a 4.60% drop in the value of the index. While yesterday marked the largest “point” decline in the history of the Dow Jones Index, it was not anywhere near the largest percentage decline which is the metric that we care about.
Below is a chart that shows the largest daily “point” losses in the history of the Dow Jones Industrial Index:
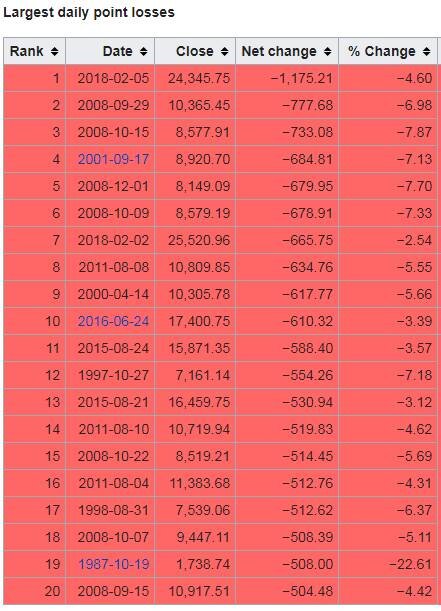
You will find yesterday at the top of the chart. Now look at the column all the way to the right labelled “% change”. You will notice that while yesterday topped the chart from a point decline, it does not come anywhere near the largest percentage decline that we have seen. In fact, it does not even make it in the top 20 worse days for the Dow. See the chart below that shows the largest daily percentage declines in the Dow’s history:

What Happened Last Time?
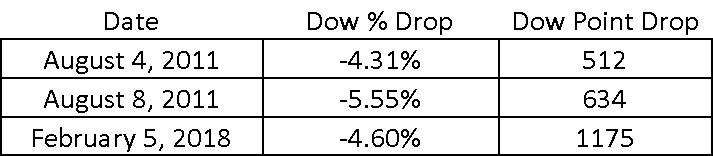
Whenever there is a big drop in the stock market, I immediately start looking back in history to find market events that are similar to the current one. So when was the last time the market dropped by more than 4% in a single day?
The answer: August 8, 2011
If you remember, 2011 was the start of the European Sovereign Debt Crisis. That was when Greece, Portugal, Spain, and Ireland announced that they were unable to repay their government debt and needed a bailout package from the European Union to survive. There were two single day declines in the month of August that rivaled what we saw yesterday.
How Long Did It Take The Market To Come Back?
If we are looking to history as a guide, how long did it take for the market to recoup the losses after these large single day declines? On July 31, 2011 the Dow Jones Industrial closed at 11,444, the Europe debt crisis hit, and the market experienced those two 4%+ decline days on August 4th and August 8th. By September 11, 2011, the Dow Jones closed at 11,509, recouping all of its losses from the beginning of August. Thus making the answer to the question: 38 days. The market took 38 days to recoup all of the losses from not one but two 4%+ decline days in 2011.
We Don’t Have A Crisis
The main difference between 2011 and now is we don’t have a global economic crisis. In my opinion, the market correction in 2011 was warranted. There was a real problem in Europe. We were not sure how and if those struggling Eurozone countries could be saved so the market dropped.
The only trigger that I hear analysts pointing to in an effort to explain the selloff yesterday is the 2.9% wage growth number that we got on Friday. This in turn has sparked inflation fears and in reaction, the Fed may decide to hike rates four times this year instead of three. Hardly a “crisis”. Outside of that nothing else meaningful has happened to trigger the volatility that we are seeing in the stock market. OK……so what should you do in reaction to this? Sometimes the right answer is “nothing”. It’s difficult to hear that because emotionally you want to pull money out of the market and run to cash or bonds but absent a sound economic reason for making that move, at this point, the best investment decision may be to just stay the course.
We Have Forgotten What Volatility Feels Like
When you are in a market environment like 2017, you very quickly forget what normal market volatility feels like. In 2017, the stock market just gradually climbed throughout the year without any hiccups. That’s not normal. Below is a chart that shows the magnitude of market corrections each year going back to 1990. As you will see, on average, when the economy is not in a recession, the market averages an 11.56% correction at some point during the year. In 2017, we only experienced a 3% correction.

intra year drops in the S&P 500 Index
Now the next chart shows you the big picture. Not only does it illustrate the amount of the largest market correction during the year but it also shows the return of the S&P 500 for the year.

Look at 2016. In 2016, at some point in the year the S&P 500 Index dropped by 11%. If you just held through it, the S&P 500 returned 10% for the year.
In 2011, the S&P 500 dropped by 19% during the year!! If you didn’t sell and just held through the volatility, you would have had a breakeven year.
Easier Said Than Done
Every big market correction feels like a new world ending crisis. It’s not. We have been fortunate enough to have a nice easy ride for the past 12 months but it seems like we are returning to more historical levels of volatility. Days like February 5, 2018 will test your patience and make you feel compelled to react. It’s easy to look back and confess that “yes, I should have just held through it” but it’s easier said than done.
It’s important to understand the catalysts that are driving the volatility in the markets. Sometimes the markets are dropping for a good reason and other times it’s just plain old fashion volatility. Based on what we have seen over the past few days and absent the emergence of a new economic, political, or global crisis, we expect it to be the later of the two.

About Michael……...
Hi, I’m Michael Ruger. I’m the managing partner of Greenbush Financial Group and the creator of the nationally recognized Money Smart Board blog . I created the blog because there are a lot of events in life that require important financial decisions. The goal is to help our readers avoid big financial missteps, discover financial solutions that they were not aware of, and to optimize their financial future.


The Dow Dropped 362 Points Yesterday. Now What?
When you hear that the Dow Jones Industrial Average dropped by over 300 points it gets your attention. It triggers that automatic emotional response which leads you to ask, "Is the market rally ending?" I'm going to start this article by saying "I'm not a cheerleader for the stock market". As a cheerleader, it's your job to cheer whether your team is
When you hear that the Dow Jones Industrial Average dropped by over 300 points it gets your attention. It triggers that automatic emotional response which leads you to ask, "Is the market rally ending?" I'm going to start this article by saying "I'm not a cheerleader for the stock market". As a cheerleader, it's your job to cheer whether your team is winning or losing. Sometimes the general public views investment advisors that way. "Of course my advisor has a rosy outlook. He wants me to stay invested".
My view is when the cycle is ending it's ending. When the data tells us that we are headed toward the next recession, you just have to accept a lower expected rate of return and make the necessary allocation changes to preserve principal during the market downturn. The answer is not always "just hold through it" which is unfortunately the answer that some investors receive from their advisor regardless of what's happening in the markets and the economy.
What Has Changed?
Whenever you have a big down day in the market the first question you should ask yourself is "What changed?" I know the value of the stock market changed but the question I'm really asking is what fundamental change happened in the U.S. economy to trigger the selloff?
Did GDP growth rate pull back unexpectedly?
Did the monthly jobs report come up short? Did inflation increase by a large number that wasn't expected?
Are corporate earnings deteriorating?
Has the leading indicators index turned negative?
These are the real questions that you should be asking. Remember, the economy leads the stock market. The stock market does not lead the economy. Watching the fluctuations in the stock market and using that as a tool to make investment decisions is a recipe for disaster. You are much more likely to find success in your investments if you use a trading app uk that is able to help you track prices and automate your trading.
A growing economy typically means higher corporate earnings
Higher corporate earnings often results in higher stock prices
With that said, sometimes the market is down because it's reacting to poor economic data. In those cases, the market downturn may be warranted. However, that is not what I think happened yesterday. We did not get a bad jobs number or shortfall in GDP growth. In short, as of yesterday, nothing has changed from an economic standpoint. Days like yesterday are just a reminder of what volatility in the markets feels like.
Higher Volatility Ahead
If you asked me if I expect more or less days like yesterday in 2018, my guess would be more. We are all suffering from "recency bias". 2017 was this nice smooth ride higher with very few interruptions. When you get used to sailing in smooth waters, a small wave can seem like a tsunami. Below is a chart of the CBEO Vix Index from January 2002 – January 2018 which is used to gauge the level of volatility in the U.S. stock market:
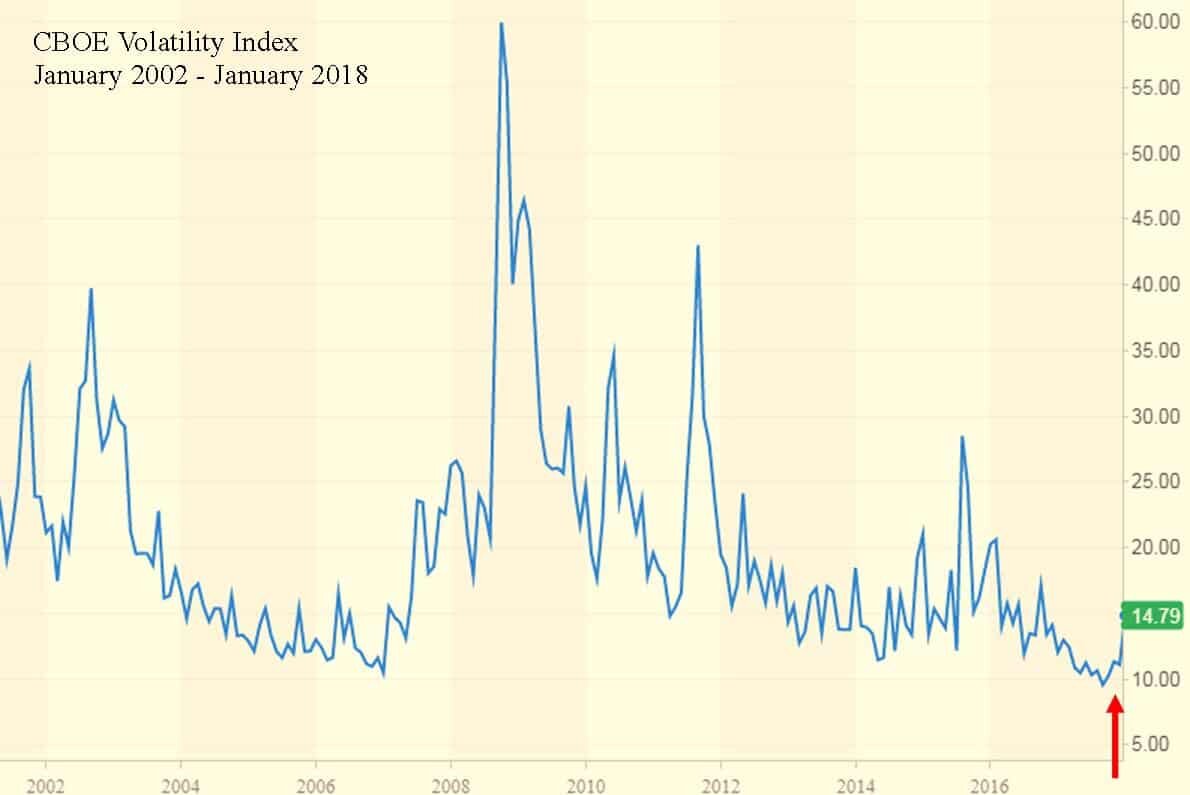
As you can see, we are coming off of historically low levels of volatility and we have to remember that volatility is normal. Every down tick in the stock market is not necessarily a signal that a recession is coming.
The Math Is Different
What if I told you that the market was only down 177 points yesterday? It probably does not trigger the same fear reaction as being down over 350 points. The reason why I ask this question is you have to remember that the price level of the Dow has doubled over the last 6 years. So a 300 point drop in the Dow Jones Industrial Average today does not mean the same thing as a 300 point drop in 2012. On February 17, 2012, the Dow Jones Industrial Average closed at 12,949. Today it sits just above 26,000. In percentage terms, a 300 drop in 2012 equaled a 2.3% drop in the stock market. If you translate that to where the stock market is today, you would need a 598 point drop in a single day to get that same 2.3% drop. It's just math but we have to remember this when the headlines in the media read:
"The Dow Dropped By 300 Points Today. Traders Are Worried That This Could Be The End Of The Rally?"
Never Hesitate
While I write these articles to help our clients and readers to become better investors and to put important market events into perspective, I have a special note that I want to leave off on for our clients. When you have that feeling of uncertainty, never hesitate to contact me. That quick phone call just to ask, "Mike, should I be worried?" That's what I'm here for. Have a great week everyone!!
About Michael.........
Hi, I’m Michael Ruger. I’m the managing partner of Greenbush Financial Group and the creator of the nationally recognized Money Smart Board blog . I created the blog because there are a lot of events in life that require important financial decisions. The goal is to help our readers avoid big financial missteps, discover financial solutions that they were not aware of, and to optimize their financial future.