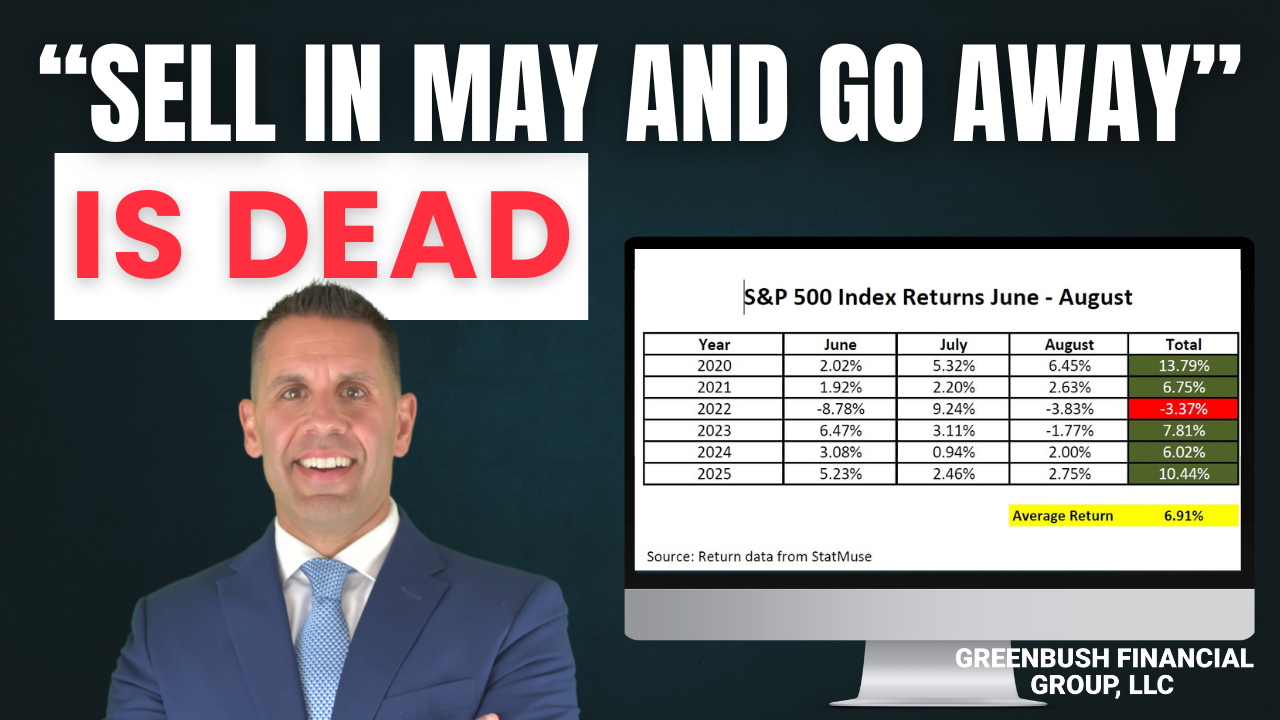
“Sell in May and Go Away” is Dead
“Sell in May and Go Away” sounds clever, but the data tells a different story. Since 2020, investors who followed this rule would have missed out on strong summer gains. We break down why discipline and staying invested consistently beat market timing.
By Michael Ruger, CFP®
Partner and Chief Investment Officer at Greenbush Financial Group
One of the most well-known Wall Street adages is the “Sell in May and go away” strategy. The idea is simple: sell your stock holdings in May, avoid the typically slower summer months, and then re-enter the market in the fall when trading activity and returns supposedly pick back up. On the surface, this strategy sounds appealing—who wouldn’t want to avoid risk and still capture the best gains of the year?
But here’s the problem: if you had followed this strategy over the past six years, you would have missed out on some very strong returns. In fact, staying on the sidelines from June through August would have cost you real money.
In this article, we’ll cover:
A look at the actual S&P 500 returns from June–August over the past few years
Why investors would have been “right” only 1 out of 6 times
The real risk of following catchy headlines instead of hard data.
Why discipline through volatility has historically paid off.
What the Data Really Says
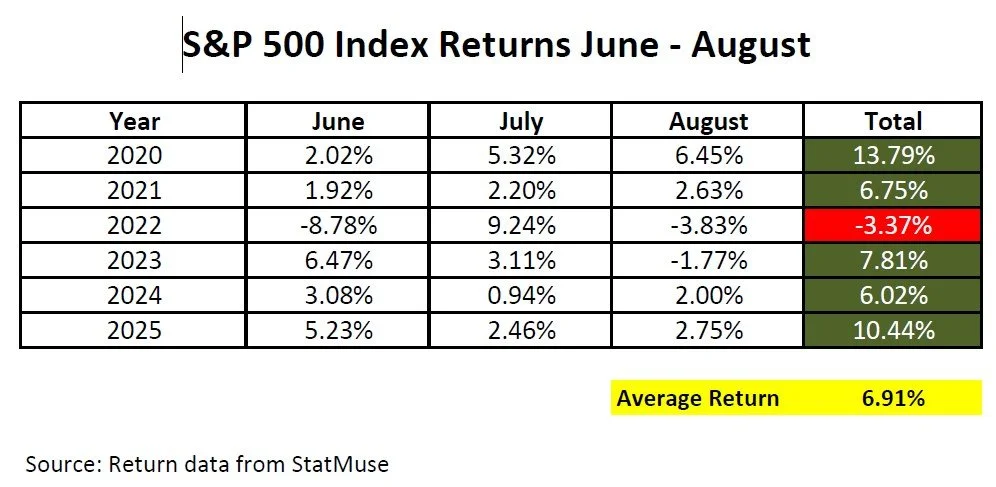
Below is a breakdown of the S&P 500 Index returns from June through August for each year since 2020.
When we look at the data:
Five out of six years, the June – August months produced positive returns.
The average return over this period was 6.91%.
Investors would have only been correct in sitting out one year (2022), when the S&P fell by –3.37%.
Put simply, investors who followed the Sell In May and Go Away strategy for the past 6 years cost themselves about 7% PER YEAR in investment returns.
Why the Temptation is Strong
It’s easy to see how investors get drawn into these types of strategies. A headline or article points out that summer months are historically weaker, or that volatility spikes during this period. On paper, it can sound logical: avoid risk, re-enter later, and come out ahead.
But as the table shows, the reality doesn’t line up with the theory. By relying on the “Sell in May” strategy, investors risk leaving money on the table. That’s the danger of market timing—you need to be right not once, but twice (when to sell, and when to buy back in).
Volatility vs. Discipline
There’s no denying that the summer months often bring more volatility to the stock market. Thinner trading volumes and seasonal economic patterns can cause choppier price action. But investors who have had the discipline to ride through those bumps have been rewarded.
The past six years make this clear: while the S&P 500 had its ups and downs from June to August, the overall trend was solidly positive. That’s why sticking to a long-term investment plan often beats trying to time the market.

About Michael……...
Hi, I’m Michael Ruger. I’m the managing partner of Greenbush Financial Group and the creator of the nationally recognized Money Smart Board blog . I created the blog because there are a lot of events in life that require important financial decisions. The goal is to help our readers avoid big financial missteps, discover financial solutions that they were not aware of, and to optimize their financial future.
Frequently Asked Questions (FAQs)
What does “Sell in May and go away” mean in investing?
“Sell in May and go away” is a market adage suggesting that investors should sell their stock holdings in May, avoid the summer months when returns are thought to be weaker, and reinvest in the fall. The strategy is based on historical seasonal trends but often oversimplifies how markets actually perform.
Has the “Sell in May” strategy worked in recent years?
Recent data shows that this strategy has largely underperformed. Over the past several years, the S&P 500 has delivered positive returns during the summer months more often than not, meaning investors who exited in May would have missed out on gains.
Why can following seasonal market sayings be risky?
Relying on old adages or headlines instead of data can lead to missed opportunities or poorly timed decisions. Markets are influenced by a range of factors—economic trends, interest rates, and company performance—not just the calendar.
What’s the downside of sitting out of the market during the summer?
Missing even a few strong market days can significantly reduce long-term investment returns. Staying invested allows you to participate in rebounds and compounding growth that can happen unexpectedly throughout the year.
Why is discipline so important for investors?
A disciplined, long-term investment approach helps smooth out volatility and avoid emotional decision-making. Sticking with a consistent strategy based on goals and time horizon has historically produced better outcomes than trying to time the market.
What’s a more effective alternative to timing seasonal trends?
Instead of trying to predict short-term market movements, investors can focus on maintaining a diversified portfolio aligned with their risk tolerance and financial objectives. This approach emphasizes consistency and adaptability rather than reacting to temporary patterns.


Does "Sell In May And Go Away" Really Work?
There is a well-known trading strategy that goes by the name of "Sell In May And Go Away". The strategy involves liquidating all of your stock holdings in May and then re-establishing your stock positions in November. The basic premise of this strategy is when you reference performance data from the stock market for the past 100 years, two of

sell in may and go away
There is a well-known trading strategy that goes by the name of "Sell In May And Go Away". The strategy involves liquidating all of your stock holdings in May and then re-establishing your stock positions in November. The basic premise of this strategy is when you reference performance data from the stock market for the past 100 years, two of the three worse months typically occur between May and October. But does it really work?
Losing Strategy
While there are years that we can point to that the "Sell In May" strategy would have worked, it would have been a losing strategy for the past 4 out of 5 years.

The only year that strategy would have worked within the last five years was in 2015 and you avoid a minuscule 1% loss. On the flip side, you missed a huge 11.6% gain in 2017. If you implemented this strategy every year for the past 5 years, it would have cost you 22.4% in investment returns. Not good.
Looking Back Further
Instead of looking back just 5 years, let’s look back 10 years from 2008 to 2017. The “Sell In May” strategy would have only worked 4 out of 10 times. So it would have been the losing strategy 60% of the time. Again, not good.
So why do you hear so much about it? Looking at the market data, even though it has not been a reliable source as to whether or not the stock market will be up or down during the May to October months, the return data of the Dow Jones Industrial Average suggests historically that the largest returns are found during the November through April months.
A perfect example is 2010. In 2010, the Dow Jones Industrial Average produced a return of 1% between May – October. However, the Dow Jones produced a 15.2% rate of return in 2010 between November and April. Implementing the “Sell In May” strategy would have cost you 1% in return since you were not invested during the summer months but you still captured the lion share of the return from the stock market for the year.
Also, when the economy is in a recession, May through October typically contains the months that produce the largest losses for the Dow. During the 2008 recession, the Dow was down 27.3% between May and October but it was only down 12.4% between November and April. Likewise, during the 2001 recession, the Dow was down 15.5% between May and October but it was actually positive 9.6% between November and April.
Measure of Magnitude Not Direction
The further you dig into the data, the more it seems that the "Sell In May" strategy is a more accurate measure of "magnitude" instead of direction. Let's compare the May to October vs. the November to April return data of the Dow Jones Industrial Average 2008 – 2015 from Stock Almanac.

stock market returns
Looking at this time period, the losses were either less severe or the gains were greater between the November and April time frame 6 out of 8 years or 75% of the time. Compared with only 3 out of the 8 years where the direction of the returns were different when comparing those two time frames or 37.5% of the time.
Recession vs. Expansion
I think there are a number of takeaways from looking at this data. One might conclude that when U.S. economy is in a period of expansion, the "Sell In May" strategy has less than a coin flip chance of creating a more favorable investment return. However, when the economy is in a recession, the historical data may also suggest that more weight be given to the strategy since May through October in the past two recessions has contained the largest drops in the stock market.With all of that said, timing the market is very difficult and many investment professionals even label it as foolish. In general, long term investors are often better served by selecting an asset allocation that is appropriate for their risk tolerance and time horizon and staying the course.
About Michael.........
Hi, I’m Michael Ruger. I’m the managing partner of Greenbush Financial Group and the creator of the nationally recognized Money Smart Board blog . I created the blog because there are a lot of events in life that require important financial decisions. The goal is to help our readers avoid big financial missteps, discover financial solutions that they were not aware of, and to optimize their financial future.