
Will There Be A Santa Claus Rally This Year?
Going back 120 years, December has traditionally been a very good month for the stock market. Within the last 120 years the S&P 500 has been positive in December 73% of the time. The Russell 2000, which is the index for small cap stocks, has been up 87% of the time in December. This boost in the final month of the year is known to traders as the

Going back 120 years, December has traditionally been a very good month for the stock market. Within the last 120 years the S&P 500 has been positive in December 73% of the time. The Russell 2000, which is the index for small cap stocks, has been up 87% of the time in December. This boost in the final month of the year is known to traders as the “Santa Claus Rally”. Should investors expect a Santa Claus rally in 2018 given the recent sell off in the markets? The answer may hinge on the results of the Federal Reserve Meeting on December 19th.
The Fed Decision
The fate of the Santa Claus rally may very well be in the hands of the Federal Reserve Committee this year. The Committee’s decision regarding the Fed Fund Rate could either cause the market to rally if the Fed decides to keep rates unchanged or it could push the markets lower if they decide to move forward with the anticipated quarter point rate hike. The Fed has a really tough decision to make this year. The goal of the Fed is to keep interest rates at a level that promotes full employment and a target inflation rate of 2%. In periods of economic expansion, it’s the Fed’s job to make sure the economy does not overheat which in turn could lead to prices of goods and services in the U.S. spiraling out of control.
Over the past few years, the U.S. economy has continued to expand and the Fed has been raising rates in quarter point increments. A very slow pace by historic standards. The Fed has already raised the Fed Funds Rate three times in 2018. What are the chances that the Fed raises rates again in December?
Solid Employment & Inflation In Check
The good news is there is not a lot of pressure for the Fed to raise rates in December. As of October, the unemployment rate sits at 3.7% and the employment data that we have seen throughout November has been strong. Historically, a strong job market usually results in higher wages for employees which is the main driver of inflation. So in the current economic environment, the Fed’s main focus is keeping inflation within its 2% target range. The Fed’s measuring stick for the rate of inflation is the Personal Consumption Expenditures Index. Otherwise known as the “PCE”.
There is a “Headline PCE” and a “Core PCE”. The Core PCE excludes prices for food and energy which is the Fed’s main barometer. Why does the Fed use Core PCE? Food and Energy prices can fluctuate significantly over short periods of time which can distort the results of the PCE index.
Below is a chart of both the Headline PCE and the Core PCE:
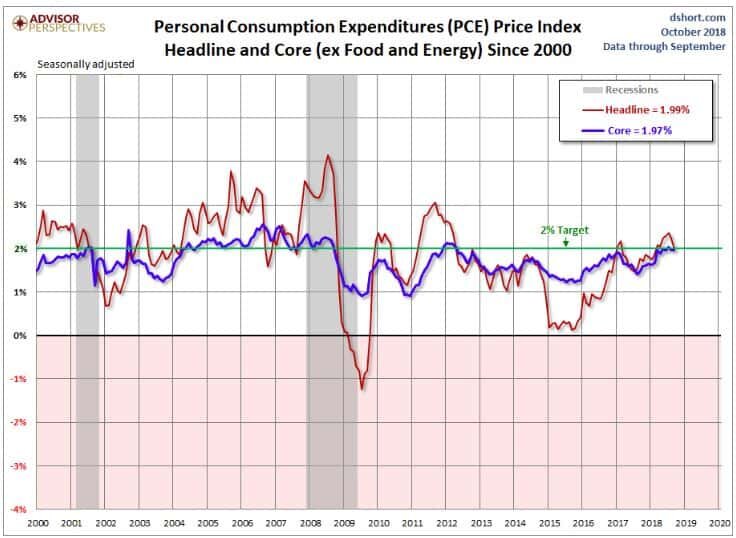
As you can see in the chart, the blue line that represents the Core PCE is right below the Fed’s 2% target. The PCE index is reported monthly and in October the PCE came in at a year-over-year change of 1.97%. Also you will see in the chart, due to the drop in the price of oil over the past two months, the Headline PCE is also dropping. While Headline PCE is not the Fed’s main measuring stick, there does seem to be a correlation between Headline PCE and Core PCE. It makes sense because regardless of the price of the product that you are taking a sample of, that product needs to be transported from the producer to the end user, and that transportation cost, which is largely influenced by the price of oil, will have an impact on the price of product within the Core PCE index.
This is good news for the stock market going into the December Fed meeting. With the Core PCE running just below the Fed’s target 2% rate and the Headline PCE declining, there is not a big push for the Fed to raise the Fed Funds Rate in December. I would even make the argument that raising the Fed Funds Rate in December would be a mistake.
The Fed & The Stock Market
The Fed is not a slave to the stock market. It’s not the Fed’s job to make sure the stock market continues to go up. Just because the stock market has experienced a large sell off over the past two months does not mean that the Fed will come to the market’s rescue and not raise rates. But remember, the Fed’s job is to keep the U.S. economy at full employment and keep inflation in check. Since inflation remains in check, it would seem that the prudent decision would be for the Fed to pause in December. If the Fed decides to raise rates in December, I have a difficult time understanding the catalyst for that decision.
Drivers Of The Recent Sell Off
It’s been a frustrating year for investors. Over the past 7 weeks, the U.S. large cap index, mid cap index, and small cap index have forfeited all of their gains for the year. International equity markets have been crushed this year. In a year like this, normally investors could turn to the bond portion of their portfolio for some support but that has not been the case this year either. The Barclays US Aggregate Bond index is down 2.38% year-to-date in 2018. It’s been a return drought this year with a double dose of volatility.
While the rapid rise in interest rates at the beginning of October may have triggered the market sell off, the downturn has been sustained by revisions to the forward guidance offered by corporations within their third quarter earnings report. While it has been another solid quarter of earnings for U.S. corporations, many of the companies that have been leading the bull market rally revised their forward earnings guidance down for the next few quarters. U.S. corporations seem to be embracing the uncertainty created by the trade wars and the tight labor market going into 2019.
It’s important to understand that as of today corporate earnings have not fallen short of expectations. As of November 14, 2018, 456 of the 500 companies in the S&P 500 had reported 3rd quarter earnings. 77.6% of those companies reported earnings above analyst expectations. This is above the long-term average of 64% and in line with the prior four quarter averaging of 77% exceeding expectations.
What really changed was the gross revenue numbers. Of those 456 companies that reported, 60.4% of those companies reported Q3 revenue above analyst expectations. That puts it in-line with the long-term average of 60% but below the average of the prior four quarters at 73%. While the U.S. economy continues to show strength, U.S. corporations have largely built an “earnings buffer” into their forecasts.
Economic Expansions Do Not Die Of Old Age
Everyone is on the lookout for the next recession. Each market sell off that we experience in this prolonged bull market rally makes investors question if they should run for hills. As one would expect, as you enter the later innings of an economic expansion the markets will begin to become more volatile. It’s easy for investors to hold their positions when the markets are going straight up with no volatility like 2017. It’s much more difficult to hold positions when it feels like you’re on a boat, in a storm, in the middle of an ocean. The temptation to try and jump in and out of the market in these volatile market conditions becomes much greater.
It’s very difficult to predict the future direction of the stock market using the recent fluctuations in the stock market as your barometer for future performance. If we look at many of the economic expansions in the past, we historically do not enter recession because the market calls it a day and just decides to go into a downward death spiral. In the past, there was typically a single event or a series of events that caused the economy to go from a period of expansion to a period of contraction. It’s for this reason that during these periods of heightened volatility that we rely heavily on the economic indicators that we track to determine how worried we should really be.
One of the main indicators that we track that I have shown you in previous updates is the Composite of Leading Indicators. It aggregates a number of forward looking economic and market indicators in an effort to provide a measurement of the health of the U.S. economy. See the chart below.
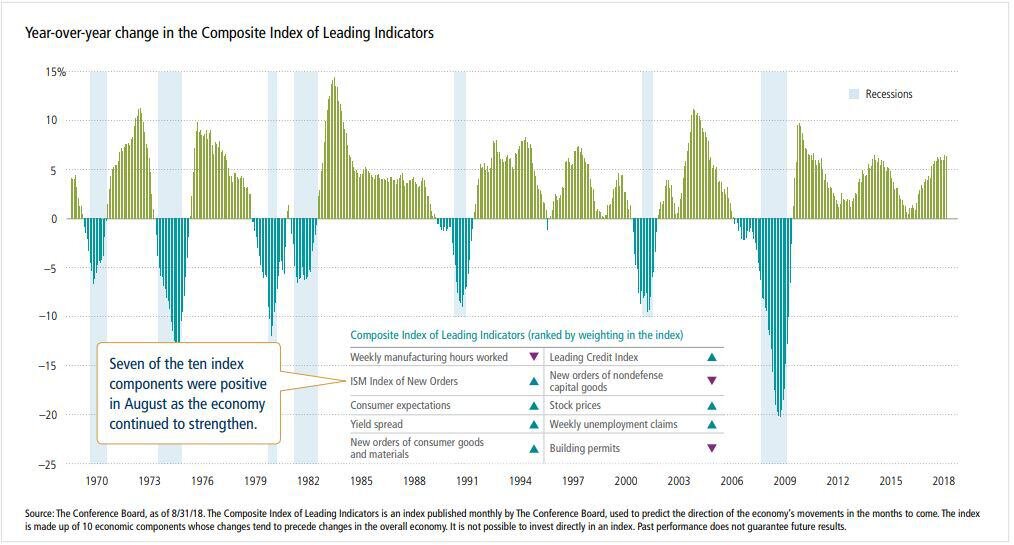
Each of the light blue areas shows when a recession took place going back to 1970. As you will see, in most cases this indicator turned negative before the economy entered a recession. If you look at what this indicator is telling us now, not only is the U.S. economy healthy, but over the past year it has strengthened. If you look at where we are now, there has never been a time since 1970 that this economic indicator has been at its current level, and a recession just shows up out of nowhere 12 months later.
Conclusion
We have no way of knowing what action the Fed will take on December 19th. However, given the tame level of inflation and the 3.7% unemployment rate, we would not be surprised if the Fed pauses at the December meeting which could lead to a health rally for the markets in December. Even if the Fed throws the market a curve ball and moves forward with the quarter point rate hike, while this move may seal the markets hopes of posting a positive return for the 2018 calendar year, the economy is still healthy, the probability of a recession within the next 12 months is still very low, and interest rates, although rising, are still at historically low levels. This economic environment may reward investors that have the discipline to make sound investment decision during these periods of heightened market volatility. The “easy years” are clearly behind us but that does not mean that the economic expansion is over. Have a safe and happy Thanksgiving everyone!!

About Michael……...
Hi, I’m Michael Ruger. I’m the managing partner of Greenbush Financial Group and the creator of the nationally recognized Money Smart Board blog . I created the blog because there are a lot of events in life that require important financial decisions. The goal is to help our readers avoid big financial missteps, discover financial solutions that they were not aware of, and to optimize their financial future.


The Stock Market Dropped 800 Points Today. Is This A Warning Sign?
There was a large sell off in the stock market today. The Dow, S&P 500, and Nasdaq all dropped by over 3% in today’s trading session. After a long bull rally, big drops in the stock market often lead investors to the question: “Is this big drop in the market the beginning of something worse to come?” To answer that question, you have to identify what

There was a large sell off in the stock market today. The Dow, S&P 500, and Nasdaq all dropped by over 3% in today’s trading session. After a long bull rally, big drops in the stock market often lead investors to the question: “Is this big drop in the market the beginning of something worse to come?” To answer that question, you have to identify what changed and more importantly what did not change in the economy and the markets over the past two weeks.
Interest Rates Have Spiked
If there is a single indicator or event that we can point to that has triggered the recent sell-off, it would be the dramatic rise in interest rates. Between September 17th and October 10th, the yield on a 10 year government bond went from 3% to 3.23%. Now that may not sound like a big move but interest rates on a 10 year bond moving by 0.23% in less than a month is a big move.
When interest rates go higher, it increases the cost associated with borrowing money. Mortgage News Daily reported yesterday that the average interest rate on a 30-year fixed mortgage is currently at 5% compared to just below 4% a year ago. As interest rates move higher, it may prevent some individuals from being able to finance a mortgage, get a car loan, or it may cause a business to forgo taking that loan to expand their business.
When interest rates rise gradually as they have over the past three years it historically does not prompt a big sell off because those higher rates are slowly integrated into the economy. The yield on the 10 Year Treasury bottomed in May 2016 at 1.46% and has been steadily climbing ever since. In May 2018, the 10 Year Treasury Bond was yielding around 2.80% so it took 2 years from the yield to go up by 1.34% compared to the 0.23% jump that we experience over the past 2 weeks.
Will The Rise In Rates Continue?
We could see a further rise in rates over the next few weeks but at this point, we have probably seen the majority of the big move up. Even though the Fed is expected to raise rates in December and possibly three to four times in 2019, there are other forces at work that are anchoring our rates to lower levels.
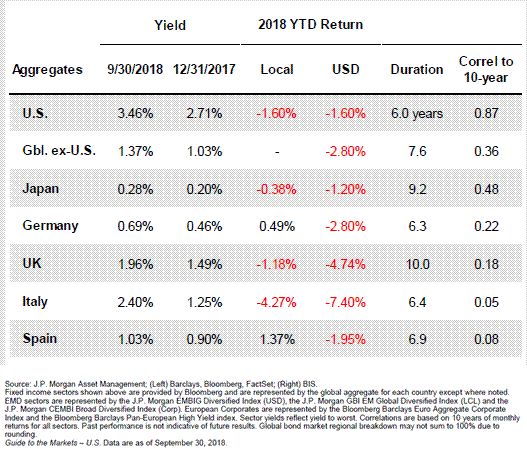
The first being the lower level of global interest rates. As you will see on the chart below, as of September 30, 2018, the U.S. is issuing 10 year bonds at 3.46%. When you look at other “credit worthy” counties like Germany, they are issuing their 10 year bonds at 0.69%. So when foreign countries have cash to park, they will gladly take the 3.46% interest rate for 10 years as opposed to 0.69% for 10 years. This makes the demand for US debt high around the global and we are not pressured to issue our debt at higher rates to entice buyers because our rates are already a lot higher than debt being issued by other governments around the world.
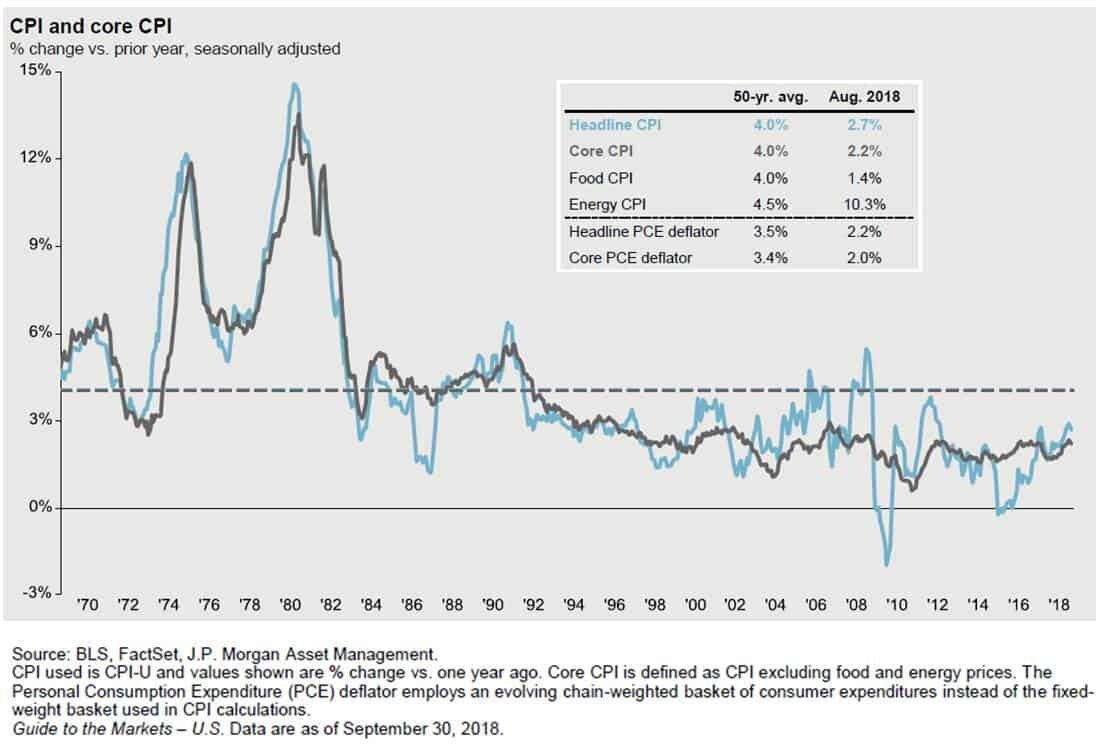
The second reason that rates are most likely to remain at lower levels over the next few months is tame inflation. When inflation rises above the Fed’s 2% target rate, they often respond by raising the Fed Funds Rate either more frequently or by larger increments. As you will see in the chart below, the annual year over year change in the core Consumer Price Index (CPI) as of August 2018, which is the Fed’s primary measure of inflation, was only up 2.2%. Very close to the Fed’s target range so the Fed is not behind the inflation curve. If inflation was roaring ahead at 3% or higher it would probably prompt the Fed to raise the Fed Funds rate faster than the market expects.
Rates Are Still At Healthy Levels
Even though interest rates are rising, they are still at historically low levels. Which then prompts the question: “At what level do interest rates become problematic?” If we use history as a guide, it would seem that once the yield on the U.S. 10 year treasury bond reach 4.50%, returns from the stock market come under pressure in the two year following the breach of that threshold. But historically, when rate are where they are now and moving higher, the stock market has traditionally moved higher as interest rates were rising.
See the chart below which illustrated the correlation between interest rates and stock prices. Each dot on this chart represents a 2 year return from the stock market between 1963 and 2018. If there is a positive correlation, that means interest rates are moving higher and stock prices are moving higher at the same time. This is illustrated with a dot placed above the line in the chart. Those are favorable environments and it makes sense because in the early stages of a rising rate environment the Fed is raising rates because the economy is healthy but rates are not higher enough yet where they are harming the growth rate of the economy.
Visa versa when the dots are below the line that means that there is a negative correlation between interest rates meaning interest rates are going up and stock prices are going down.

If you look at where 3.25% would be on the x axis you will not see any dots below the line. That would imply that between 1963 – 2018 when the interest rate on the 10 year treasury bond were at the current level and moving higher, two years later stock prices were always higher. Otherwise you would see a dot below the line. If the stock market were to be lower 2 years from now and interest rates are at their current rates and moving higher, it would be the first time that has ever happened within the last 55 years.
Could stock prices be lower 2 year from now? Sure they could but if you use history as a guide, it would suggest that such an event would have a low probability of occurrence.
Conclusion
As of right now, it would seem that the recent sell-off in the U.S. stock market was triggered by an unexpected rise in interest rates over the past two week. While higher interest rates are often revered as an unwelcome guest to bull markets, history would suggest that interest rates have not reached levels that would prompt an end to the current economic expansion. We would also add that there are other forces at work such as tame inflation rates and a lower global interest rate environment that may prevent a further dramatic increase in rates from the current levels.
About Michael……...
Hi, I’m Michael Ruger. I’m the managing partner of Greenbush Financial Group and the creator of the nationally recognized Money Smart Board blog . I created the blog because there are a lot of events in life that require important financial decisions. The goal is to help our readers avoid big financial missteps, discover financial solutions that they were not aware of, and to optimize their financial future.

How Could The Midterm Elections Impact The Stock Market?
The most common question that I have been asked over the past few weeks is: “If the Republicans lose control of either the House or the Senate in November, what impact do you think that will have on the markets?” How much the stock market may go up or down in the days leading up to or directly after the midterm elections, regardless of the result, is

The most common question that I have been asked over the past few weeks is: “If the Republicans lose control of either the House or the Senate in November, what impact do you think that will have on the markets?” How much the stock market may go up or down in the days leading up to or directly after the midterm elections, regardless of the result, is anyone’s guess. But if we use history as a guide, investors will probably realize that this situation is not uncommon, and there is probably less to worry about than investors think.
A Shift In Power Is Not Uncommon
If we look back at every midterm election going back to 1934, on average, the president’s party has lost 30 seats in the House and 4 seats in the Senate during a midterm election year. There are only three years in history that the president’s party actually gained seats due to a midterm election: 1934, 1998, and 2002. So if the Republican’s lose seats in Congress in November that would really be the norm instead of the exception to the rule. If it is in fact the norm, investors have to ask themselves, “how much of that shift in power is already priced into the market?”
How Does The Stock Market React During Midterm Election Years?
In attempting to answer this question there are two components: volatility and return. As many would guess, during midterm election years volatility typically rises leading up to the elections. Looking at the S&P 500 Index going all the way back to 1970, the volatility levels in the stock market are typically 10%+ more volatile when compared to the levels of volatility in the S&P 500 when there are no midterm elections.
From a return standpoint, the results speak for themselves. Below is a bar chart that shows the return of the S&P 500 Index 12 months following the midterm elections 1950 – 2015:
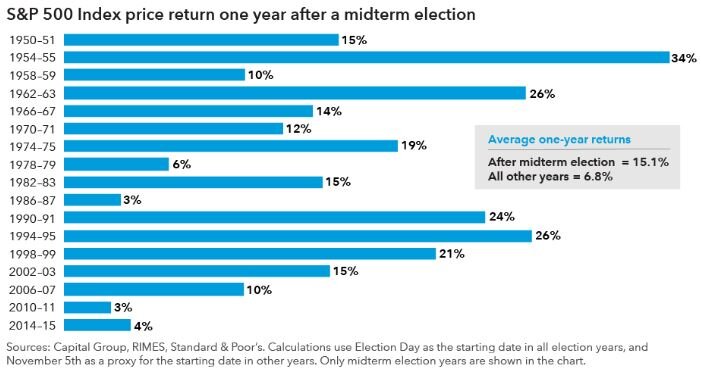
stock market returns
12 months after a midterm elections the S&P 500 Index averages a 15.1% annual return. In all other years the stock market averages a 6.8% annual return.
But What About A Flip In Control
It’s one things to lose seats in Congress but do we have to worry more because it’s not just about losing seats this year, it’s about a shift in power within Congress? Again, using history as a guide, let’s look at what has happened in the past. The House majority switched parties as a result of midterm elections in 1994, 2006, and 2010. In all three of those years where a shift in power was in the cards, the stock market was either down or flat leading up the midterm elections in November. However, in all three of those years the stock market was significantly higher 12 months after the midterm elections. See the chart below:
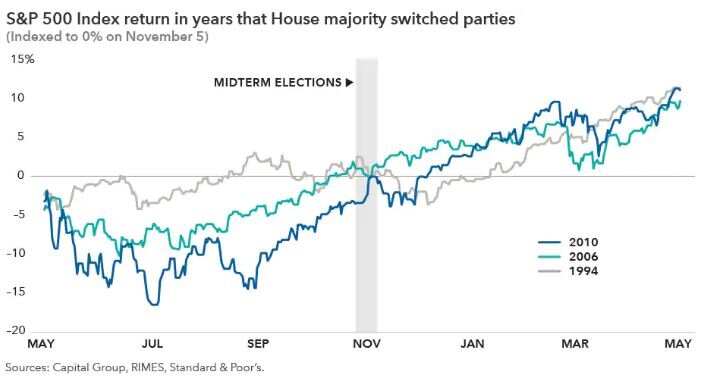
past returns of S&P 500 Index
The Stock Market Cares More About The Economy
If you asked me which environment I would choose to invest in:
A) Stable political environment and bad economy
B) Unstable political environment and good economy
I would probably choose “B” because at the end of the day the stock market is historically driven by the economy. While politics have the power to influence the economy, if we end up in a gridlock situation after the November elections, that is also the norm. Going back to 1948, we have had a “divided government” 61% of the time. As we get closer to the elections, there is a very good chance that the level of volatility in the markets will increase because the stock market doesn’t like uncertainty. But if we use history as our guide, the 12 months following the midterm elections may reward investors that stay the course.
About Michael……...
Hi, I’m Michael Ruger. I’m the managing partner of Greenbush Financial Group and the creator of the nationally recognized Money Smart Board blog . I created the blog because there are a lot of events in life that require important financial decisions. The goal is to help our readers avoid big financial missteps, discover financial solutions that they were not aware of, and to optimize their financial future.
Patience Should Reward Investors In 2018
Bottom line, the first half of 2018 was a tough pill to swallow for investors. They had to fight a constant rollercoaster. Volatility was high, returns were low, and the news was dominated with fears of trade wars. This environment has left investors questioning if we are on the eve of the next recession. Well I have good news. While trade wars have driven

Bottom line, the first half of 2018 was a tough pill to swallow for investors. They had to fight a constant rollercoaster. Volatility was high, returns were low, and the news was dominated with fears of trade wars. This environment has left investors questioning if we are on the eve of the next recession. Well I have good news. While trade wars have driven fear into the hearts of investors, during that same time period corporate earnings have been soaring and the U.S. economy has continued its growth path. For these reasons, disciplined investors may have good things waiting for them in the second half of 2018.
Coming Off A Big Year
As of the end of the second quarter, the S&P 500 Index was up 2.6% year to date. So why does 2018 seem like such a disappointment? You have to remember that 2017 was a huge year with the added benefit of very little volatility. It was a straight march up the entire year.
First, let’s compare the performance of the various asset classes in the first half of 2017 versus to first half of 2018. Below are the returns for the various assets classes in the first half of 2017:
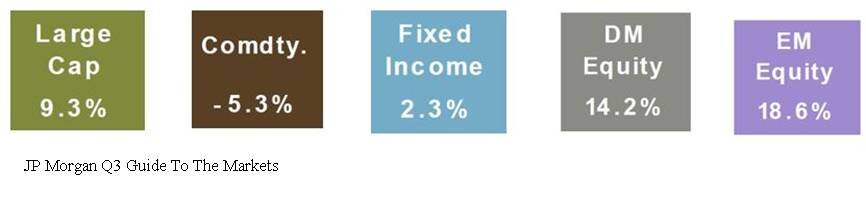
Here are those same asset classes in the first half of 2018.
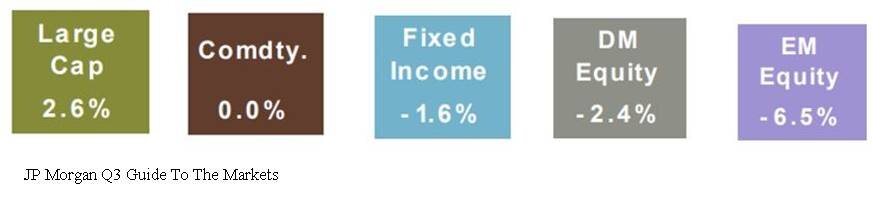
Obviously a huge difference. At this time last year, the S&P 500 Index was already up 9.3% for the year compared to 2.6% in 2018. International and emerging market equities were up over 14% in the first half of 2017. In 2018, those same international stocks were down over 2%. One might guess that bonds would preform better in a year with muted stock returns. Well, one would be wrong because the Barclay’s US Aggregate Bond Index was down 1.6% in the first 6 months of 2018.
Volatility Is Back
Not only has the first half of 2018 been a return drought but the level of volatility in the stock market has also spiked. In the first 6 months of 2017, the S&P 500 Index only had 2 trading days where the stock market moved plus or minus by more than 1% in a day. Guess how many trading days there were in the first half of 2018 where the S&P 500 Index moved up or down by more than 1% in a day.
The answer: 25 Days
That’s a 1,250% increase over 2017. No wonder everyone’s nerves are rattled. So the up 2% YTD in the stock market feels more like a down 10% because a lot has happened in a short period of time. Plus, the only big positive month for the stock market was in January which feels like forever ago.
Recency Bias
Investors are largely suffering for what we call in the investment industry as “recency bias”. In other words, what happened recently has now become the rule in the minds of investors. Investors are largely using 2017 as their measuring stick for 2018 performance and volatility. While it would seem that the dramatic increase in the level of volatility this year would classify 2018 as an abnormally volatile year, it’s actually 2017 that was the anomaly. Below is a chart that shows the annual return of the S&P 500 Index since 1980. The dots below each annual return are the market corrections that took place as some point during each calendar year.
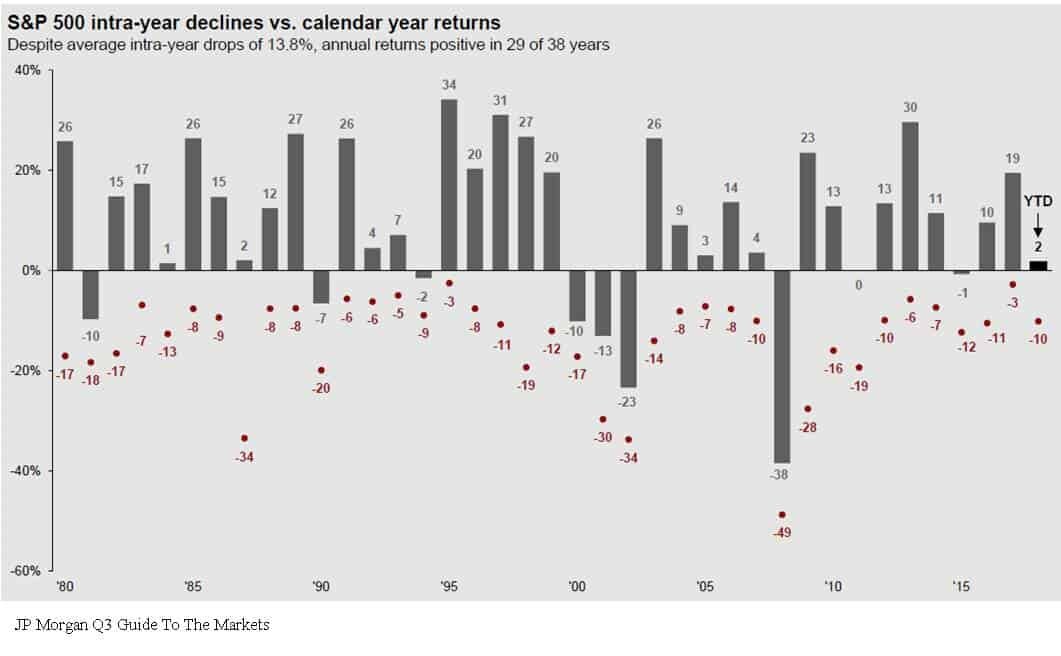
Based on historical data, it’s “normal” for the market to experience on average a 10% correction at some point during the year. Now look at 2017, the stock market was up 19% for the year but the largest correction during the year was 3%. That’s abnormal. By comparison, even though we are only half way through 2018, we have already experienced a 10% correction and as of June 30th, the S&P 500 Index is up 2% for the year.
Earnings Are King
Behind the dark clouds of the media headlines and the increased level of volatility this year is the dramatic increase in corporate earnings. Corporate earnings have not only increased but they have leaped forward. Take a look at the chart below:
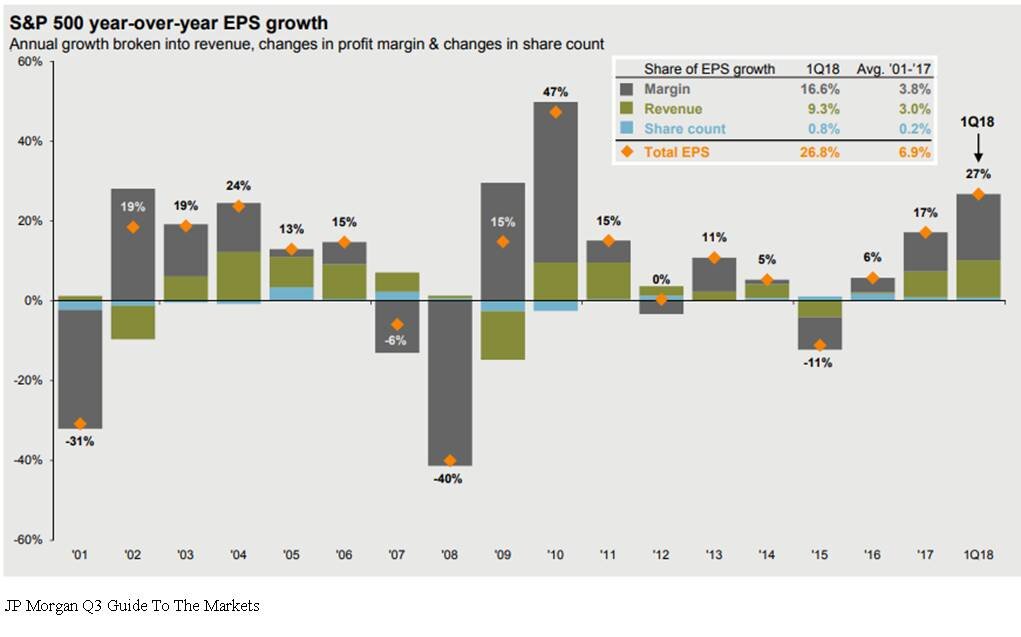
The market traditionally follows earnings. The earnings per share for the S&P 500 Index in 2017 was 17% which is a strong number historically. In the first quarterly of 2018, the year-over-year earnings per share growth was up 27%. That is a surge in corporate earnings. But you would have no idea looking at the meager 2% YTD return from the stock market this year. Pair that with the fact that the P/E of the S&P 500 is around 16 which is in line with its 20 year historic average. See the chart below:
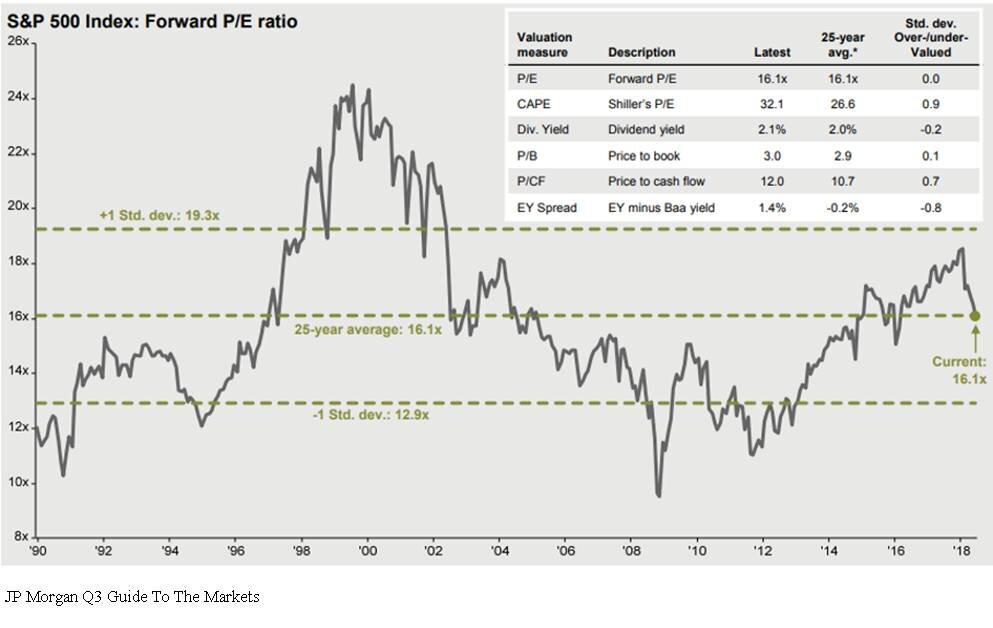
Even though it has been a long expansion, the market is not “over priced” by historic terms. If the stock market is fairly valued and corporate earnings are accelerating, one could make the case that the stock market has some catching up to do in the second half of the year.
The Chances Of A Recession Are Low
With the yield curve still positively sloped and the Composite Index of Leading Indicator, not only positive, but accelerating, a recession within the next 6 to 12 months seems unlikely. It’s like wandering through a jungle. When you are on the ground, the jungle is intimidating, there are plenty of things to be afraid of, and it’s tough to know which direction you should be walking. As investment advisors it’s our job to climb the tallest tree to get above the jungle to determine which way we should be walking.
In summary, 2018 has been an emotional roller coaster for investors. But making sound investment decision is about putting your emotions and gut feelings aside and looking at the hard economic data when making investment decisions. That data is telling us that we may very well be witnessing the soon to be longest economic expansion since 1900. The U.S. economy is strong, tax reform is boosting corporate earnings, interest rates are rising but are still at benign levels, and consumer sentiment is booming. In the later stages of an economic cycle, higher levels of volatility will be here to stay which will test the patience of investors. But overall the second half of the year could prove to be beneficial for investors that choose to climb the trees.
About Michael.........
Hi, I’m Michael Ruger. I’m the managing partner of Greenbush Financial Group and the creator of the nationally recognized Money Smart Board blog . I created the blog because there are a lot of events in life that require important financial decisions. The goal is to help our readers avoid big financial missteps, discover financial solutions that they were not aware of, and to optimize their financial future.

We Are Sleep Walking Into The Next Crisis
The U.S. economy is headed down a dangerous path. In our opinion it has nothing to do with the length of the current economic cycle, valuations, interest rates, or trade wars. Instead, it has everything to do with our mounting government deficits. We have been talking about the federal budget deficits for the past ten years but when does that

The U.S. economy is headed down a dangerous path. In our opinion it has nothing to do with the length of the current economic cycle, valuations, interest rates, or trade wars. Instead, it has everything to do with our mounting government deficits. We have been talking about the federal budget deficits for the past ten years but when does that problem really come home to roost?
A Crisis In Plain Sight
An economic crisis is often easier to spot than you think if you are looking in the right places. Most of the time it involves identifying a wide spread trend that has evolved in the financial markets and the economy, shutting out all of the noise, and then applying some common sense. Looking at the tech bubble, people were taking home equity loans to buy tech stocks that they themselves did not understand. During the housing bubble people that were making $40,000 per year were buying homes for $500,000 and banks were giving loans with no verification of income. Both of the last two recessions you could have spotted by paying attention to the trends and applying some common sense.
Government Debt
Looking at the data, we think there is a good chance that the next economic crisis may stem from reaching unsustainable levels of government debt. Up until now we have just been talking about it but my goal with this article is to put where we are now in perspective and why this "talking point" may soon become a reality.
Debt vs GDP
The primary measuring stick that we use to measure the sustainability of the U.S. debt level is the Debt vs GDP ratio. This ratio compares the total debt of the U.S. versus how much the U.S. economy produces in one year. Think of it as an individual. If I told you that someone has $100,000 in credit card debt, your initial reaction may be “wow, that’s a lot of debt”. But then what if I told you that an individual makes $1,000,000 per year in income? That level of debt is probably sustainable for that person since it’s only 10% of their gross earnings, whereas that amount of credit card debt would render someone who makes $50,000 per year bankrupt.
Our total gross federal deficit just eclipsed $21 trillion dollars. That’s Trillion with a “T”. From January through March 2018, GDP in the U.S. was running at an annual rate of $19.965 trillion dollars (Source: The Balance). Based on the 2018 Q1 data our debt vs GDP ratio is approximately 105%. That’s big number.
The Safe Zone
Before I start throwing more percentages at you let's first establish a baseline for what's sustainable and not sustainable from a debt standpoint. Two Harvard professors, Reinhart and Rogoff, conducted a massive study on this exact topic and wrote a whitepaper titled "Growth in a Time of Debt". Their study aimed to answer the question "how much debt is too much for a government to sustain?" They looked at historic data, not just for the U.S. but also for other countries around the world, to determine the correlation between various levels of Debt vs GDP and the corresponding growth or contraction rate of that economy. What they found was that in many cases, once a government's Debt vs GDP ratio exceeded 90%, it was frequently followed by a period of either muted growth or economic contraction. It makes sense. Even though the economy may still be growing, if you are paying more in interest on your debt then you are making, it puts you in a bad place.
Only One Time In History
There has only been one other time in U.S. history that the Debt vs GDP ratio has been as high as it is now and that was during World War II. Back in 1946, the Debt vs GDP ratio hit 119%. The difference between now and then is we are not currently funding a world war. I make that point because wars end and when they end the spending drops off dramatically. Between 1946 and 1952, the Debt vs GDP ratio dropped from 119% to 72%. Our Debt vs GDP ratio bottomed in 1981 at 31%. Since then it has been a straight march up to the levels that were are at now. We are not currently financing a world war and there is not a single expenditure that we can point to that will all of a sudden drop off to help us reduce our debt level.
Spending Too Much
So what is the United States spending the money on? Below is a snapshot of the 2018 federal budget which answers that question. As illustrated by the spending bar on the left, we are estimated to spend $4.1 trillion dollars in 2018. The largest pieces coming from Social Security, Medicare, and Medicaid.
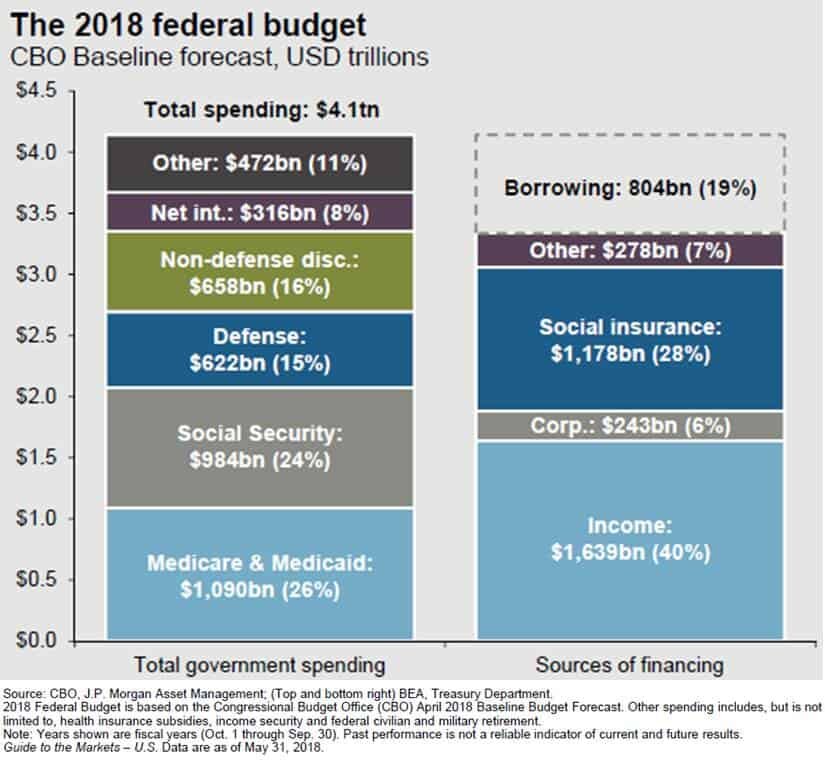
federal deficit
The bar on the right illustrates how the U.S. intends to pay for that $4.1 trillion in spending. At the top of that bar you will see “Borrowing $804 Bn”. That means the Congressional Budget Office estimates that the U.S. will have to borrow an additional $804 billion dollars just to meet the planned spending for 2018. With the introduction of tax reform and the infrastructure spending, the annual spending amount is expected to increase over the next ten years.
Whether you are for or against tax reform, it’s difficult to make the argument that it’s going to “pay for itself in the form of more tax as a result of greater economic growth.” Just run the numbers. If our annual GDP is $19.9 Trillion per year, our 3% GDP growth rate I already factored into the budget numbers, to bridge the $804B shortfall, our GDP growth rate would have to be around 7% per year to prevent further additions to the total government debt. Good luck with that. A 7% GDP growth rate is a generous rate at the beginning of an economic expansion. Given that we are currently in the second longest economic expansion of all time, it’s difficult to make the argument that we are going to see GDP growth rates that are typically associated with the beginning of an expansion period.
Apply Common Sense
Here’s where we apply common sense to the debt situation. Excluding the financing of a world war, the United State is currently at a level of debt that has never been obtained in history. Like running a business, there are only two ways to dig yourself out of debt. Cut spending or increase revenue. While tax reform may increase revenue in the form of economic growth, it does not seem likely that the U.S. economy is at this stage in the economic cycle and be able to obtain the GDP growth rate needed to prevent a further increase in the government deficits.
A cut in spending, in its simplest form, means that something has to be taken away. No one wants to hear that. The Republican and Democratic parties seem so deeply entrenched in their own camps that it will make it difficult, if not impossible, for any type of spending reform to take place before we are on the eve of what would seem to be a collision course with the debt wall. Over the past two decades, the easy solution has been to “just borrow more” which makes the landing even harder when we get there.
Answering the “when” question is probably the most difficult. We are clearly beyond what history has revered as the “comfort zone” when to comes to our Debt vs GDP ratio. However, the combination of the economic boost from tax reform and infrastructure spending in the U.S., the accelerating economic expansion that is happening outside of the U.S., and the low global interest rate environment, could continue to support growth rates even at these elevated levels of government debt.
Debt is tricky. There are times when it can be smart accept the debt, and times where it isn’t helpful. As we know from the not too distant past, it has the ability to sustain growth for an unnaturally long period of time but when the music stops it gets ugly very quickly. I’m not yelling that the sky is falling and everyone needs to go to cash tomorrow. But now is a good time to evaluate where you are risk wise within your portfolio and begin having the discussion with your investment advisor as to what an exit plan may look like if the U.S. debt levels become unsustainable and it triggers a recession within the next five years.
About Michael.........
Hi, I’m Michael Ruger. I’m the managing partner of Greenbush Financial Group and the creator of the nationally recognized Money Smart Board blog . I created the blog because there are a lot of events in life that require important financial decisions. The goal is to help our readers avoid big financial missteps, discover financial solutions that they were not aware of, and to optimize their financial future.

Does "Sell In May And Go Away" Really Work?
There is a well-known trading strategy that goes by the name of "Sell In May And Go Away". The strategy involves liquidating all of your stock holdings in May and then re-establishing your stock positions in November. The basic premise of this strategy is when you reference performance data from the stock market for the past 100 years, two of

sell in may and go away
There is a well-known trading strategy that goes by the name of "Sell In May And Go Away". The strategy involves liquidating all of your stock holdings in May and then re-establishing your stock positions in November. The basic premise of this strategy is when you reference performance data from the stock market for the past 100 years, two of the three worse months typically occur between May and October. But does it really work?
Losing Strategy
While there are years that we can point to that the "Sell In May" strategy would have worked, it would have been a losing strategy for the past 4 out of 5 years.

The only year that strategy would have worked within the last five years was in 2015 and you avoid a minuscule 1% loss. On the flip side, you missed a huge 11.6% gain in 2017. If you implemented this strategy every year for the past 5 years, it would have cost you 22.4% in investment returns. Not good.
Looking Back Further
Instead of looking back just 5 years, let’s look back 10 years from 2008 to 2017. The “Sell In May” strategy would have only worked 4 out of 10 times. So it would have been the losing strategy 60% of the time. Again, not good.
So why do you hear so much about it? Looking at the market data, even though it has not been a reliable source as to whether or not the stock market will be up or down during the May to October months, the return data of the Dow Jones Industrial Average suggests historically that the largest returns are found during the November through April months.
A perfect example is 2010. In 2010, the Dow Jones Industrial Average produced a return of 1% between May – October. However, the Dow Jones produced a 15.2% rate of return in 2010 between November and April. Implementing the “Sell In May” strategy would have cost you 1% in return since you were not invested during the summer months but you still captured the lion share of the return from the stock market for the year.
Also, when the economy is in a recession, May through October typically contains the months that produce the largest losses for the Dow. During the 2008 recession, the Dow was down 27.3% between May and October but it was only down 12.4% between November and April. Likewise, during the 2001 recession, the Dow was down 15.5% between May and October but it was actually positive 9.6% between November and April.
Measure of Magnitude Not Direction
The further you dig into the data, the more it seems that the "Sell In May" strategy is a more accurate measure of "magnitude" instead of direction. Let's compare the May to October vs. the November to April return data of the Dow Jones Industrial Average 2008 – 2015 from Stock Almanac.

stock market returns
Looking at this time period, the losses were either less severe or the gains were greater between the November and April time frame 6 out of 8 years or 75% of the time. Compared with only 3 out of the 8 years where the direction of the returns were different when comparing those two time frames or 37.5% of the time.
Recession vs. Expansion
I think there are a number of takeaways from looking at this data. One might conclude that when U.S. economy is in a period of expansion, the "Sell In May" strategy has less than a coin flip chance of creating a more favorable investment return. However, when the economy is in a recession, the historical data may also suggest that more weight be given to the strategy since May through October in the past two recessions has contained the largest drops in the stock market.With all of that said, timing the market is very difficult and many investment professionals even label it as foolish. In general, long term investors are often better served by selecting an asset allocation that is appropriate for their risk tolerance and time horizon and staying the course.
About Michael.........
Hi, I’m Michael Ruger. I’m the managing partner of Greenbush Financial Group and the creator of the nationally recognized Money Smart Board blog . I created the blog because there are a lot of events in life that require important financial decisions. The goal is to help our readers avoid big financial missteps, discover financial solutions that they were not aware of, and to optimize their financial future.


Don't Let Taxes Dictate Your Investment Decisions
Everyone hates to pay more in taxes. But this is something that has to be done. Sometimes taxes can often lead investors to make foolish investment decisions. The stock market bottomed in March 2009 and since then we have experienced the second-longest bull market rally of all time. This type of market environment typically creates a

Everyone hates to pay more in taxes. But this is something that has to be done. Sometimes taxes can often lead investors to make foolish investment decisions. The stock market bottomed in March 2009, and since then, we have experienced the second-longest bull market rally of all time. This type of market environment typically creates a stockpile of unrealized gains in the equity portion of your portfolio. When you go to sell one of your investment holdings that has appreciated in value over the past few years, there may be a big tax bill waiting for you. But when is it the right time to ignore the tax hit and execute the trade?
Do The Math
What sounds worse? Writing a check to the government for $10,000 in taxes or experiencing a 3% loss in your investment accounts? Most people would answer paying taxes. After all, who wants to write a check to the government for $10,000 after you have already paid your fair share of taxes throughout the year. It’s this exact situation that gets investors in a lot of trouble when the stock market turns or when that concentrated stock position takes a nosedive.
Before making this decision make sure you do the math. If you have $500,000 in your taxable investment account and the account value drops by 3%, your account just lost $15,000. It would have been better to sell the holding, pay the $10,000 in taxes, and you would still be ahead by $5,000. Before making the decision not to sell for tax reasons, make sure you run this calculation.
Gains Are Good
While most of us run from paying taxes like the plague, remember that gains are good. It means that you made money on the investment. At some point, you are going to have to pay tax on that gain unless you are purposefully waiting for the investment to lose value or if you plan to die with that holding in your estate.
If you put $100,000 in an aggressive investment a year ago and it’s now worth $200,000, if you sell it all today, you will have to pay long-term cap gains tax and possibly state tax on the $100,000 realized gain. However, remember that what goes up by 100% can also go down by 100%. To avoid the tax bill, you make the decision to just sit on the investment, and 3 months from now, the economy goes into a recession. The value of that investment drops to $125,000 and you sell it before things get worse. While you successfully decreased your tax liability, the tax hit would have been a lot better than saying goodbye to $75,000.
As financial planners, we are always looking for ways to reduce the tax bill for our clients, but sometimes paying taxes is unavoidable. The more you make, the more you pay in taxes. In most tax years, investors try to use investment losses to help offset some of the realized taxable gains. However, since most assets classes have appreciated in value over the last few years, investors may be challenges to find investment losses in their accounts.
Capital Gains Tax
A quick recap of capital gains tax rates. There are long-term and short-term capital gains. They apply to investments that are held in non-retirement account. IRA’s, 401(k), and 403(b) plans are all tax deferred vehicles so you do not have worry about realizing capital gains tax when you sell a holding within those types of accounts.
In a taxable brokerage account, if you buy an investment and sell it in less than 12 months, if it made money, you realize a short-term capital gain. Short-term gains do not receive preferential tax treatment. You pay tax at the ordinary income tax rates.
However, if you buy an investment and hold it for more than a year before selling it, the gain is taxed at the preferential long-term capital gain rates. At the federal level, there are three flat rates: 0%, 15%, and 20%. At the state level, it varies based on what state you live in. If you live in New York, where we are headquartered, long-term capital gains do not have preferential tax treatment for state income tax purposes. They are taxed as ordinary income. While other states like Alaska, Florida, and Texas assess no taxes at the state level on capital gains.
Here are the updated thresholds for 2026:
2026 Long-Term Capital Gains Tax Brackets:
Single Filers:
0%: $0 to $49,449
15%: $49,450 to $545,499
20%: Over $545,500
Married Filing Jointly:
0%: $0 to $98,900
15%: $98,901 to $613,699
20%: Over $613,700
Head of Household:
0%: $0 to $66,199
15%: $66,200 to $579,599
20%: Over $579,600
Long term cap gains rates
A special note for investors that fall in the 20% category, in addition to being taxed at the higher rate, there is also a 3.8% Medicare surtax that is tacked onto the 20% rate. So the top long-term capital gains rate for high-income earners is really 23.8%, not 20%.
Don't Forget About The Flat Rate
Investors forget that long-term capital gains are taxed, for the most part, at a flat rate. If your AGI is $200,000 and you are considering selling an investment that would cause you to incur a $100,000 long-term capital gain, it may not matter from a tax standpoint whether you sell it all this year or if you split the gain between two different tax years. You are still taxed at that flat 15% federal tax rate on the full amount of the gain, regardless of when you sell it. There are, of course, exceptions to this rule. Here is a list of some of the exceptions that you need to be aware of:
Your AGI limit for the year
The impact of the long-term capital gain on your AGI
College financial aid
Social security taxation
Health insurance through the exchange
First exception is the one-time income event that pushes your income dramatically higher for the year. This could be a big bonus, a good year for the company that you own, or you sell an investment property. In these cases you have to mindful of the federal capital gains tax thresholds. If it’s toward the end of the year and you are thinking about selling an investment that has a good size unrealized gain built up into it, it may be prudent to sell enough to keep yourself out of the top long-term capital gains bracket and then sell the rest in January when you enter the new tax year. That move could save you 8.8% in taxes on the realized gains. The 23.8% to tax rate minus the 15% median rate. If you are at the beginning or in the middle of a tax year trying to make this decision, the decision is more difficult. You will have to weigh the risk of the investment losing value before you flip into a new tax year versus paying a slightly higher tax rate on the gain.
To piggyback on the first exception, you have to remember that long-term capital gains increase your AGI. If you make $300,000 and you realize a $200,000 long-term capital gain on an investment, it’s going to bump you up into the highest federal long-term capital gains tax rate.
College financial aid can be a big exception. If you have a child in college or a child who will be going to college within the next two years, and you expect to receive some type of financial aid based on income, be very careful about when you realize capital gains in your investment portfolio. The parents’ investment income can count against a student’s financial aid package. Also, FASFA looks back two years for purposes of determining your financial aid package, so conducting this tax versus risk analysis requires some advanced planning.
For those receiving social security benefits, capital gains can impact how much of your social security benefit is subject to taxation.
For individuals that receive their health insurance through a state exchange platform (Obamacare) and qualify for income subsidies, the capital gains income could decrease the amount of the subsidy that you receive for that year. Be careful.
Don't Make This Mistake
Bottom line, nothing is ever simple. I wish I could say that in all instances, you should completely ignore the tax ramifications and make the right investment decision. In the real world, it’s about determining the balance between the two. It’s about doing the math to better under the tax hit versus the downside risk of continuing to hold a security to avoid paying taxes.
While the current economic expansion may still have further to go, we are probably closer to the end than we are to the beginning of the current economic expansion. When the expansion ends, investors are going to be tempted to hold onto certain investments within their portfolio longer than they should because they don’t want to take the tax hit. Don’t make this mistake. If you have a stock holding within your portfolio and it drops significantly in value, you may not have the time horizon needed to wait for that investment to bounce back. Or you may have the opportunity to preserve principal during the next market downturn and buy back that same investment at a lower level.
In general, it’s a good time for investors to revisit their investment portfolios from a risk standpoint. You may be faced with some difficult investment decisions within the next few years. Remember, selling an investment that has lost money is ten times easier than selling one of your “big winners”. Do the math, don’t get emotionally attached to any particular investment, and be prepared to make investment changes to your investment portfolios as we enter the later stages of this economic cycle.
About Michael.........
Hi, I’m Michael Ruger. I’m the managing partner of Greenbush Financial Group and the creator of the nationally recognized Money Smart Board blog . I created the blog because there are a lot of events in life that require important financial decisions. The goal is to help our readers avoid big financial missteps, discover financial solutions that they were not aware of, and to optimize their financial future.

Are The New Trade Tariffs Good Or Bad For The Stock Market?
US businesses often imports their manufactured goods from China. This is because the cost of manufacturing products is much lower than in other places so they want to take advantage of this. The government makes money off this relationship by imposing tariffs on certain products coming into the US. President Trump announced on March 8, 2018

US businesses often imports their manufactured goods from China. This is because the cost of manufacturing products is much lower than in other places so they want to take advantage of this. The government makes money off this relationship by imposing tariffs on certain products coming into the US. President Trump announced on March 8, 2018 that the United States will begin imposing a tariff on steel and aluminum imported into the U.S. from countries other than Mexico and Canada. The tariff on steel will be 25% and 10% on aluminum. There are two main questions that we will seek to answer in this article:
What happened the last time the U.S. implemented trade tariffs?
How will the stock market react to the new trade barriers?
What Is A Tariff?
First, let's do a quick recap on what a tariff is. A tariff is a special tax on goods that come into the United States. Tariffs are imposed to make select foreign goods more expensive in an effort to encourage the U.S. consumer to buy more American made goods. For example, if the government puts a 25% tariff on cars that are imported into the U.S., that BMW that was manufactured in Germany and shipped over to the U.S. and sold to you for $70,000 will now cost $87,500 for that same exact car due to the 25% tariff. As a consumer this may cause you not to buy that BMW and instead buy a Corvette that was manufactured in the U.S. and carries a lower price tag.
What Does History Tell Us?
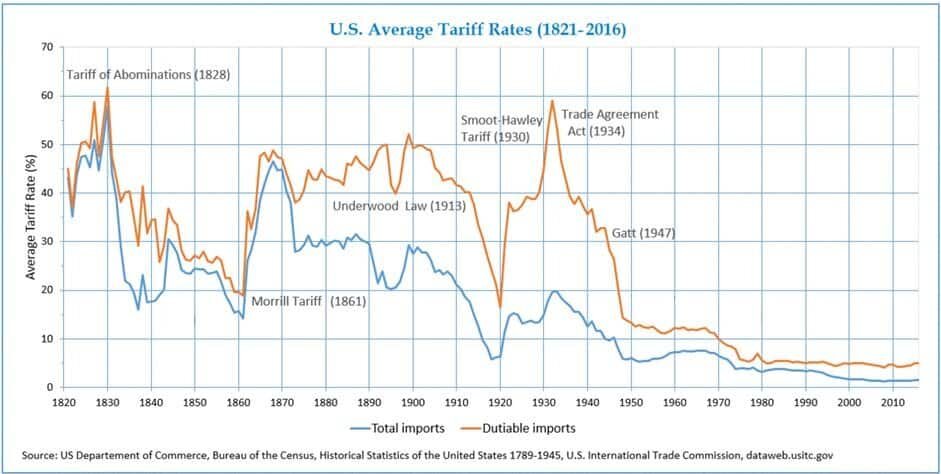
history of tariffs in the US
It’s very clear from this chart that the U.S. has not imposed meaningful tariffs since the early 1900’s. Conclusion, it’s going to be very difficult to predict how these tariffs are going to impact the U.S. economy and global trade. Even though we have some historical references, the world is very different today compared to 1930. The “global economy” did not even really exist back then.
As you can see in the chart, the average import trade tariff in 1930 was about 20%. Since 1975, the average trade tariff on imports has been below 5%. More recently, between 2000 and 2016 the average tariff on imports was below 2%.
History Will Not Be A Useful Guide
As an investment manager, when a big financial event takes place, we start to scour through historical data to determine what happened in the past when a similar event took place. While we have had tariffs implemented in the past, many of those tariffs were implemented for reasons other than the ones that are driving the U.S. trade policy today.
Prior to 1914, tariffs were used primarily to generate revenue for the U.S. government. In 1850, tariffs represented 91% of the government’s total revenue mainly because there was no income tax back then. By 1900 that percentage had dropped to 41%. As many of us are well aware, over time, the main source of revenue for the government has shifted to the receipt of income and payroll taxes with tariff revenue only representing about 2% of the government’s total receipts.
During the Industrial Revolution (1760 – 1840), tariffs were used to protect the new U.S. industries that were in their infancy. Without tariffs it would have been very difficult for these new industries that were just starting in the U.S. colonies to compete with the price of goods coming from Europe. Tariffs were used to boost the domestic demand for steel, wool, and other goods that were being produced in the U.S. colonies. These trade policies helped the new industries get off the ground, expand the workforce, and led to a prosperous century of economic growth.
Today, tariffs are being used for a different reason. To protect our mature industries from the risk of extinction as a result of foreign competition. Since the 1950’s, the global economy has evolved and the trade policies of the U.S. have been largely in support of free trade. While this sounds like a positive approach, free trade policies have taken their toll on a number of industries here in the U.S. such as steel, automobiles, and electronics. Foreign countries like China have access to cheap labor and they are able to produce select goods and services at a much lower cost than here in the United States.
While this a good thing for the U.S. consumer because you can purchase a big screen TV made in China for a lot less than that same TV made in the U.S., there are negative side effects. First and foremost are the U.S. jobs that are lost when a company decides that it can produce the same product for a lot less over in China. We have seen this trend play out over the past 20 or 30 years. Tariffs can help protect some of those U.S. jobs because it makes products purchased from foreign manufactures more expensive and it increases the demand for U.S. goods. The downside to that is the consumer may be asked to pay more for those same products since at the end of the day it costs more to produce those products in the U.S.
In the announcement of the steel and aluminum tariffs yesterday, the White House also acknowledged the national security risk of certain industries facing extinction in the United States. Below is a chart of production of steel in the U.S. from 1970 – 2016.
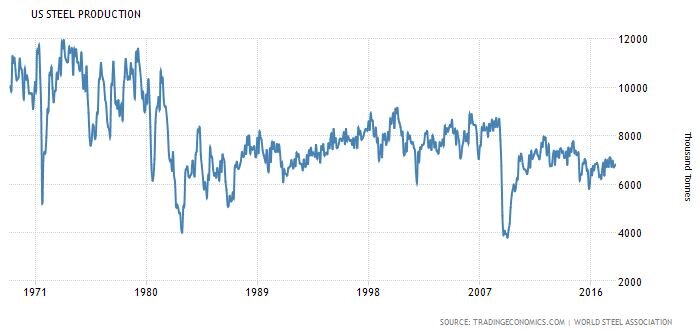
As you can see in the chart, our economy has grown dramatically over this time period but we are producing half the amount of steel in the U.S. that we were 47 years ago. If everything stayed the same, this reduction in the U.S. production of steel would probably continue. It begs the question, what happens 50 years from now if there is a global conflict and we are unable to build tanks, jets, and ships because we import 100% of our steel from China and they decide to shut off the supply? There are definitely certain industries that we will always need to protect here in the U.S. even though they may be “cheaper” to buy somewhere else.
There is also monopoly risk. Once we have to import 100% of a particular good or service, those producers have 100% pricing power over us. While I would be less concerned over TV’s and electronics, I would be more concerned over items like cars, foods, building materials, and other items that many of us consider a necessity to our everyday lives.
Free or Fair?
While we have had “free” trade policies over the past few decades, have they been “fair”? Elon Musk, the CEO of Tesla, recently highlighted that “China isn’t playing fair in the car trade with the U.S.” He goes on to point out that China puts a 25% import tariff on American cars sold to China but the U.S. only has a 2.5% import tariff on cars that are manufactured in China and sold in the U.S.
In response to this, Trump mentioned in his speech that the U.S. will be pursuing “reciprocal” or “mirror” trade policies. Meaning, if a country puts a 25% tariff on U.S. goods imported into their country, the U.S. would put a 25% tariff on those same goods that are imported from their country into the U.S.
Trade Wars
While the reciprocal trade policies seem fair on the surface and it also makes sense to protect industries that are vital to our national security, the greatest risk of transitioning from a “free trade” policy to “protectionism” policy is trade wars. We just put a 25% tariff on all of the steel that is imported from China, how is China going to respond to that? Remember, the U.S. is part of a global economy and trade is important. How important? When you look at the gross revenue of all of the companies that make up the S&P 500 Index, over 50% of their revenue now comes from outside the U.S. If all of a sudden, foreign countries start putting tariffs on U.S. goods sold aboard, that could have a big negative impact on the corporate earnings of our big multinational corporations in the United States. In addition, when you listen to the quarterly earnings calls from companies like Apple, Nike, Pepsi, and Ford, the future growth of those companies are relying heavily on their ability to sell their products to the growing consumer base in the emerging market. Countries like China, India, Russia, and Brazil.
I go back to my initial point, that history will not be a great guide for us here. We have not used tariffs in a very long period of time and the reason why we are using tariffs now is different than it was in the past. Plus the world has changed. There is no clear way to know at this point if these new tariffs are going to help or hurt the U.S. economy over the next year because a lot depends on how these foreign countries respond to the United States moving away from the long standing era of free trade.
Canada & Mexico Exempt
The White House announced yesterday that Canada and Mexico would be exempt from the new tariffs. Why? This is my guess and it's only guess, the U.S. is currently in the process of negotiating the NAFTA terms with Canada and Mexico. NAFTA stands for the North American Free Trade Agreement. Trump has made it clear that if we cannot obtain favorable trade terms, the U.S. will exit the NAFTA agreement. The U.S. may use the recent tariff announcement as a negotiation tool in the talks with Canada and Mexico on NAFTA. "Listen, we gave you an exemption but if you don't give us favorable trade terms, all deals are off."
Coin Flip
While tax reform seems like a clear win for U.S. corporations, only history will tell us whether or not these new trade policies will help or harm the U.S. economy. If we are able to protect more U.S. jobs, protect industries vital to the growth and protection of the U.S., and negotiate better trade deals with our trading partners, we may look back and realize this was the right move at the right time.On the flip side of the coin, if trade wars break out that could lead to a decrease in the demand for U.S. goods around the globe that may cause the U.S. to lose more jobs than it is trying to protect. As a result, that could put downward pressure on corporate earnings and in turn send stock prices lower in the U.S. Only time will tell.
About Michael.........
Hi, I’m Michael Ruger. I’m the managing partner of Greenbush Financial Group and the creator of the nationally recognized Money Smart Board blog . I created the blog because there are a lot of events in life that require important financial decisions. The goal is to help our readers avoid big financial missteps, discover financial solutions that they were not aware of, and to optimize their financial future.

