5 Must-Read Financial Books to Build Wealth and Success at Any Stage of Life
Looking to build wealth and sharpen your money skills? Greenbush Financial Group highlights 5 must-read financial books that cover debt, investing, business strategy, and long-term success. Perfect for every stage of life.

By Michael Ruger, CFP®
Partner and Chief Investment Officer at Greenbush Financial Group
Knowledge is power—especially when it comes to money. The earlier you learn the fundamentals of personal finance and business, the faster you can avoid mistakes and build wealth compared to your peers. But whether you’re just starting out in your career, navigating mid-life financial challenges, or planning for retirement, the right financial knowledge can create opportunities and help you achieve greater freedom.
As the Managing Partner of Greenbush Financial Group, I often recommend books as a way to jump-start that education. The right book can provide not only financial strategies but also the mindset shifts needed to succeed both personally and professionally. Below are five must-read books that cover everything from managing debt to investing to starting a business:
The Total Money Makeover by Dave Ramsey
How to Win Friends and Influence People by Dale Carnegie
Rich Dad Poor Dad by Robert Kiyosaki
Blue Ocean Strategy by W. Chan Kim and Renée Mauborgne
One Up on Wall Street by Peter Lynch

1. The Total Money Makeover by Dave Ramsey
For individuals who find themselves weighed down by student loans, credit card balances, or car payments, this book is the perfect starting point. Ramsey lays out a proven system—his famous “baby steps”—to help readers eliminate debt, build an emergency fund, and begin saving for the future. His approach is straightforward, no-nonsense, and centered on living a debt-free lifestyle.
Key Lessons:
Start with a written budget and tell every dollar where to go.
Attack debt with the “debt snowball” method—paying off the smallest balances first.
Build an emergency fund to protect against unexpected expenses.
Avoid credit cards and debt as a lifestyle—cash is freedom.
Live below your means to create margin for saving and investing.
2. How to Win Friends and Influence People by Dale Carnegie
Originally published in 1936, this timeless classic focuses on building strong relationships—a skill just as valuable in business as it is in everyday life. Carnegie teaches that success often depends more on how you treat people than on technical expertise. For anyone looking to grow their career, improve leadership skills, or strengthen communication, this book remains one of the best guides available.
Key Lessons:
Don’t criticize, condemn, or complain—lead with kindness.
Give honest and sincere appreciation—people thrive on recognition.
Become genuinely interested in others, and remember their names.
Avoid arguments—approach conversations with warmth and curiosity.
Let others feel ownership of ideas—collaboration builds stronger outcomes.
3. Rich Dad Poor Dad by Robert Kiyosaki
This book reshapes the way many people think about money. Through the contrast of his “rich dad” and “poor dad,” Kiyosaki explains why building assets and investing are essential, while relying solely on a paycheck can limit financial growth. The book highlights the benefits of owning a business or investing in income-producing assets versus being stuck in the cycle of working for money.
Key Lessons:
Assets put money in your pocket, liabilities take it out—know the difference.
Don’t work only for money—learn how money works and put it to work for you.
Entrepreneurship and investing create wealth faster than wages.
Financial education is more important than formal education.
Take calculated risks instead of seeking complete security.

4. Blue Ocean Strategy by W. Chan Kim and Renée Mauborgne
For those who aspire to start their own business, this book is essential. The authors explain how companies can break away from crowded, competitive “red oceans” and instead create innovative products or services in uncontested “blue oceans.” This strategy allows entrepreneurs to differentiate themselves, grow faster, and avoid the race-to-the-bottom competition.
Key Lessons:
Don’t compete in crowded markets—create new market space.
Focus on differentiation and value innovation, not price wars.
Eliminate what doesn’t add value, and elevate what customers truly care about.
Small, creative ideas can disrupt entire industries.
Long-term success comes from standing apart, not blending in.

5. One Up on Wall Street by Peter Lynch
Originally published in 1989, this classic investment book remains one of the most practical guides for everyday investors. Lynch, one of the most successful mutual fund managers of all time, explains how average people can use their everyday knowledge—like the products they buy and the companies they interact with—to make smart investment decisions. While the markets have evolved since the book’s release, the core principles remain timeless.
Key Lessons:
Invest in what you know—your everyday life can reveal great companies.
Do your own research before following Wall Street trends.
Long-term investing beats short-term speculation.
A simple, understandable company is often a better investment than a complex one.
Patience and discipline are critical—ignore market noise.
Final Thoughts
Each of these books delivers valuable lessons that can change the way you approach money, career, and business. From getting out of debt, to building stronger relationships, to launching innovative companies, these resources provide a roadmap to success.
No matter your stage of life or career, pick the book that speaks most to your current situation and commit to applying what you learn. Over time, the habits and strategies you gain will compound, setting you apart and positioning you for long-term wealth.

About Michael……...
Hi, I’m Michael Ruger. I’m the managing partner of Greenbush Financial Group and the creator of the nationally recognized Money Smart Board blog . I created the blog because there are a lot of events in life that require important financial decisions. The goal is to help our readers avoid big financial missteps, discover financial solutions that they were not aware of, and to optimize their financial future.
Frequently Asked Questions (FAQs)
Why is financial education so important?
Financial knowledge helps individuals make informed decisions about saving, investing, and managing debt. The earlier you learn core principles, the more effectively you can avoid mistakes, build wealth, and create financial independence over time.
What are the best books to start learning about personal finance?
Books like The Total Money Makeover by Dave Ramsey, Rich Dad Poor Dad by Robert Kiyosaki, and One Up on Wall Street by Peter Lynch offer practical guidance on budgeting, investing, and building long-term wealth. Each provides actionable strategies for different stages of life.
How can The Total Money Makeover help with debt management?
Dave Ramsey’s book focuses on eliminating debt through a structured “baby steps” plan. It teaches readers to live on a budget, build an emergency fund, and use the “debt snowball” method to gain momentum toward financial freedom.
What’s the main takeaway from Rich Dad Poor Dad?
The book emphasizes that wealth comes from owning assets and understanding how money works, not just earning a paycheck. It encourages entrepreneurship, investing, and financial education as the keys to long-term success.
Why is How to Win Friends and Influence People valuable for financial success?
Success in business and personal finance often depends on relationships and communication. Dale Carnegie’s classic teaches principles of empathy, influence, and connection that are vital for leadership, networking, and negotiation.
Who should read Blue Ocean Strategy?
Aspiring entrepreneurs and business leaders can benefit from this book’s insights on creating new markets instead of competing in saturated ones. It provides a framework for innovation, differentiation, and long-term growth.
What investing lessons does One Up on Wall Street teach?
Peter Lynch shows that everyday investors can identify great opportunities by observing products and companies they already know. His approach focuses on patience, research, and long-term investing rather than short-term speculation.


Focusing On Buying Dividend Paying Stocks Is A Mistake
Picking the right stocks to invest in is not an easy process but all too often I see retail investors make the mistake of narrowing their investment research to just stocks that pay dividends. This is a common mistake that investors make and, in this article, we are going to cover the total return approach versus the dividend payor approach to investing.

Picking the right stocks to invest in is not an easy process, but all too often I see retail investors make the mistake of narrowing their investment research to just stocks that pay dividends. This is a common mistake that investors make, and in this article, we are going to cover the total return approach versus the dividend payor approach to investing.
Myth: Stocks That Pay Dividends Are Safer
Retail investors sometimes view dividend paying stocks as a “safer” investment because if the price of the stock does not appreciate, at least they receive the dividend. There are several flaws to this strategy. First, when times get tough in the economy, dividends can be cut, and they are often cut by companies to preserve cash. For example, prior to the 2008/2009 Great Recession, General Electric stock was paying a solid dividend, and some retirees were using those dividends to supplement their income. When the recession hit, GE dramatically cut it dividends, forcing some shareholders to sell the stock at lower levels just to create enough cash to supplement their income. Forcing a buy high, sell low scenario.
The Magnificent 7 Stocks Do Not Pay Dividends
In more recent years, when you look at the performance of the “Magnificent 7” tech stocks which have crushed the performance of the S&P 500 Index over the past 1 year, 5 years, and 10 years, there is one thing most of those Magnificent 7 stocks have in common. As I write this article today, Nvidia, Microsoft, Google, Amazon, and Meta either don’t pay a dividend or their dividend yield is under 1%. So, if you were an investor that had a bias toward dividend paying stocks, you may have missed out on the “Mag 7 rally” that has happened over the past 10 years.
Growth Companies = No Dividends
When a company issues a dividend, they are returning capital to the shareholders as opposed to reinvesting that capital into the company. Depending on the company and the economic environment, a company paying a dividend could be viewed as a negative action because maybe the company does not have a solid growth plan, so instead of reinvesting the money into the company, they default to just returning that excess capital to their investors. It’s may feel good to have some investment income coming back to you, but if you are trying to maximize investment returns over the long term, will that dividend paying stock be able to outperform a growth company that is plowing all of their cash back into more growth?
Companies Taking Loans to Pay Their Dividend
For companies that pay a solid dividend, they are probably very aware that there are subsets of shareholders that are holding their stock for the dividend payments, and if they were to significantly cut their dividend or stop it all together, it may cause investors to sell their stock. When these companies are faced with tough financial conditions, they may resist cutting the dividends long after they really should have, putting the company in a potentially worse financial position knowing that shareholders may sell their stock as soon as the dividend cut is announced.
Some companies may even go to the extreme that since they don’t have the cash on hand to pay the dividend, they will issue bonds (go into debt) to raise enough cash for the sole purpose of being able to continue to pay their dividends, which goes completely against the reason why most companies issue dividends.
If a company generates a profit, they can decide to reinvest that profit back into the company, return that capital to investors by paying a dividend, or some combination of two. However, if a company goes into debt just to avoid having to cut the dividend payments to investors, I would be very worried about the growth prospects for that company.
Focus on Total Return
I’m a huge fan on focusing on total return. The total return of a stock equals both how much the value of the stock has appreciated AND any dividends that the stock pays while the investor holds the stock. If I gave someone the option of owning Stock ABC that does not pay a dividend and Stock XYZ that pays a 5% dividend, a lot of individuals will automatically start to build a strong bias toward buying XYZ over ABC without digging much deeper into the analysis. However, if Stock ABC does not pay a dividend due to its significant growth prospects and rises 30% in a year, while Stock XYZ pays a 5% dividend but only appreciates 8%, the total return for Stock XYZ is just 13%. This means the investor missed out on an additional 17% return by choosing the lower-performing stock.
Diversification Is Still Prudent
The purpose of this article is not to encourage investors to completely abandon dividend paying stocks for growth stocks that don’t pay dividends. Having a diversified portfolio is still a prudent approach, especially since growth stocks tend to be more volatile over time. Instead, the purpose of this article is to help investors understand that just because a stock pays a dividend does not mean it’s a “safer investment” or that it’s a “better” long-term investment from a total return standpoint.
Accumulation Phase vs Distribution Phase
We categorize investors into two phases: the Accumulation Phase and the Distribution Phase. The Accumulation Phase involves building your nest egg, during which you either make contributions to your investment accounts or refrain from taking distributions. In contrast, the Distribution Phase refers to individuals who are drawing down from their investment accounts to supplement their income.
During the Accumulation Phase, a total return approach can be prudent, as most investors have a longer time horizon and can better weather market volatility without needing to sell investments to supplement their income. These investors are typically less concerned about whether their returns come primarily from appreciation or dividends.
As you enter the Distribution Phase, often in retirement, the strategy shifts. Reducing portfolio volatility becomes crucial because you are making regular withdrawals. For instance, if you need to withdraw $50,000 annually from your Traditional IRA and the market drops, you may be forced to liquidate investments at an inopportune time, negatively impacting long-term performance. In the Accumulation Phase, you can ride out market declines since you are not making withdrawals.
Times Are Changing
Traditionally, investors would buy and hold 10 to 30 individual dividend-paying stocks indefinitely. This is why inherited stock accounts often include companies like GE, AT&T, and Procter & Gamble, known for their consistent dividends.
However, the S&P 500 now features seven tech companies that make up over 30% of the index's total market cap, driving a significant portion of stock market returns over the past decade, with very few paying meaningful dividends. This article highlights the need for investors to adapt their stock selection methodologies as the economy evolves. It’s essential to understand the criteria used when selecting investments to maximize long-term returns.
Special Disclosure: This article does not constitute a recommendation to buy or sell any of the securities mentioned and is for educational purposes only.
About Michael……...
Hi, I’m Michael Ruger. I’m the managing partner of Greenbush Financial Group and the creator of the nationally recognized Money Smart Board blog . I created the blog because there are a lot of events in life that require important financial decisions. The goal is to help our readers avoid big financial missteps, discover financial solutions that they were not aware of, and to optimize their financial future.
Frequently Asked Questions (FAQs):
Are dividend-paying stocks safer investments?
Not necessarily. Many investors view dividend-paying stocks as “safer,” but dividends can be reduced or eliminated when companies face financial challenges. For example, during the 2008–2009 recession, General Electric slashed its dividend, forcing some investors to sell shares at depressed prices. A company’s dividend does not guarantee stability or protection against losses.
Why do some high-performing stocks not pay dividends?
Many of the best-performing companies in recent years—such as Nvidia, Google, Amazon, and Meta—pay little to no dividends because they reinvest profits into growth opportunities. This reinvestment strategy has historically produced higher total returns than dividend payouts.
What is the difference between dividend income and total return?
Dividend income only reflects the cash paid to shareholders, while total return measures both price appreciation and dividend income combined. For example, a non-dividend stock that rises 30% may outperform a 5%-dividend stock that only appreciates 8%, producing a higher overall total return.
Can companies borrow money just to keep paying dividends?
Yes, and that’s often a red flag. Some firms issue debt to sustain dividend payments when cash flow is tight, which can signal financial strain. A healthy dividend policy should come from profits, not borrowing.
Should investors focus only on dividend-paying stocks?
No. Focusing solely on dividend payers can cause investors to miss out on major growth opportunities. A balanced portfolio—combining both dividend-paying and growth-oriented stocks—can help manage volatility while capturing more total return potential.
When does a dividend-focused strategy make sense?
Dividend-focused investing can make sense during the distribution phase (retirement), when investors rely on portfolio income and prefer lower volatility. During the accumulation phase (while saving for retirement), focusing on total return and reinvestment often leads to greater long-term wealth.

How Will The Fed’s 50bps Rate Cut Impact The Economy In Coming Months?
The Fed cut the Federal Funds Rate by 0.50% on September 18, 2024 which is not only the first rate cut since the Fed started raising rates in March 2022 but it was also a larger rate cut than the census expected. The consensus going into the Fed meeting was the Fed would cut rates by 0.25% and they doubled it. This is what the bigger Fed rate cut historically means for the economy
The Fed cut the Federal Funds Rate by 0.50% on September 18, 2024, which is not only the first rate cut since the Fed started raising rates in March 2022, but it’s also a larger rate cut than most economists predicted. The consensus going into the Fed meeting was that the Fed would cut rates by 0.25%, and they doubled it. In this article, we will cover:
How is the stock market likely to respond to this larger than anticipated rate cut?
How is this rate cut expected to impact the economy in the coming months?
Do we expect this rate cut trend to continue in the coming months?
Recession trends when the Fed begins cutting rates.
How Rate Cuts Impact The Economy
When the Fed decreases the Federal Funds Rate, it is essentially breathing oxygen back into the economy. Even the anticipation of the Fed lowering rates has an impact on the interest rate on car loans, mortgages, and commercial lending. As interest rates move lower, it usually stimulates the economy by making financing more attractive to the U.S. consumer. For example, a new homebuyer may not be able to afford a new house if it’s financed with a 30-year mortgage with a 7.5% interest rate, but as interest rates move lower, to say 6%, it lowers the monthly mortgage payments, putting the house in reach for that new homebuyer.
6 Month Delay
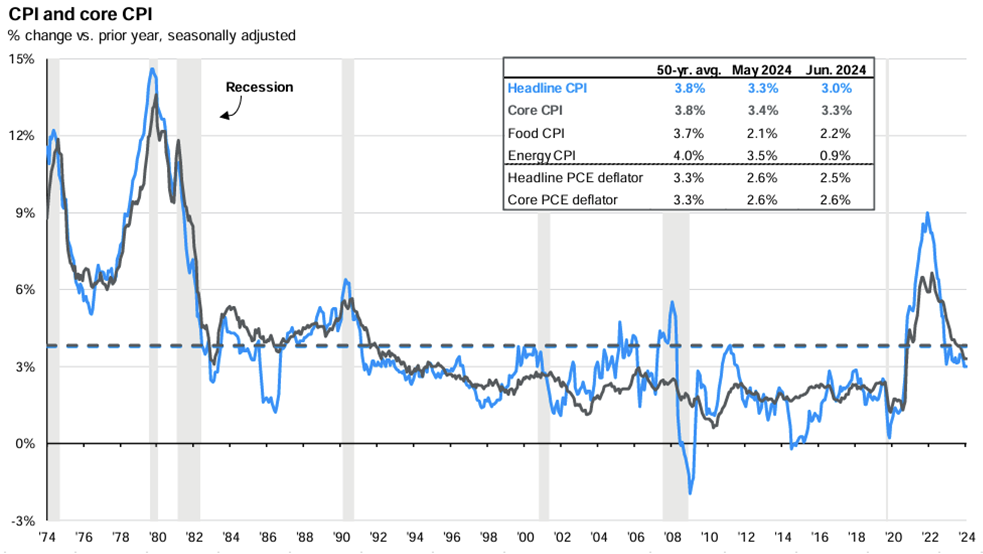
The reason why we support the Fed making a bigger rate cut now is the inflation rate has moved into the Feds 2% to 3% range, the job market has been cooling over the past few months, evident in the unemployment rate rising, and when the Fed cuts rates, it takes 6 to 9 months before that rate cut translates to more economic activity because it takes time for the impact of those lower interest rates to work their way through the economy.
Historically, The Fed Waits Too Long To Cut Rates
It’s reassuring to see the Fed cutting rates before we see significant pain in the U.S. economy because that is not the typical Fed pattern. Historically, the Fed waits too long to begin cutting rates, and only after a recession has arrived from rates being held high for too long does the Fed begin cutting rates. However, then there is a 6-month lag before the economy feels the benefits of those rate cuts and it’s usually an ugly 6 months for the equity market. The fact that the Fed is cutting rates now and by a larger amount than the consensus expects increases the chances that a soft landing will be delivered to the economy coming out of this rate hike cycle.
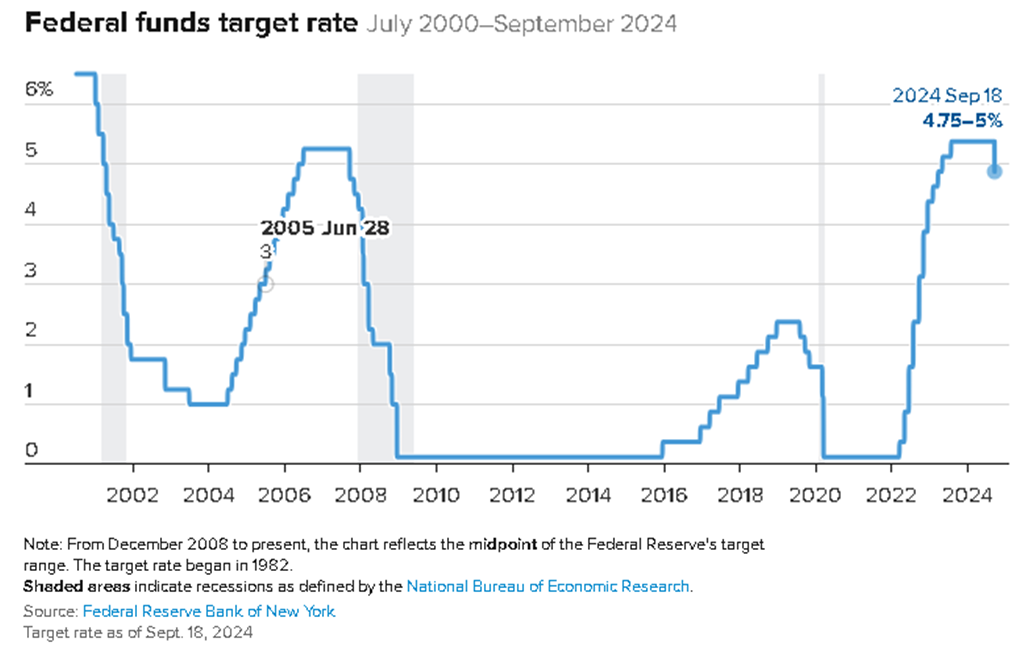
Not Out of The Woods Yet
While the Fed proactively cutting rates is a positive sign in the short term, if we look at a historic chart of the Fed Funds Rate going back to 2000, you will see a pattern from past cycles that only AFTER the Fed begins cutting rates does the economy enter a recession. So, while we applaud the Fed for being proactive with these bigger rate cuts, it still echoes the warning, “Will this rate cut and the future rate cuts be enough to avoid a recession?”. Only time will tell.
Do We Expect Additional Fed Rate Cuts
We do expect the Fed to implement additional rate cuts before the end of 2024, which if the economy hits a rough patch within the next few months, will hopefully provide some optimism that help is already on the way as these rates cuts that have already been made work their way through the economy.
The good news is they have room to cut rates by more. We were concerned at the beginning of the rate hike cycle that if they were not able to raise rates by enough, they would not have enough room to cut rates if the economy ran into a soft patch; but given the magnitude of the rate hikes between March 2022 and now, there is plenty of room to cut and restore confidence if it is needed in coming months.
COVID Stimulus Money Still In The Economy
In general, I think individuals underestimate the power of the amount of cash that was pumped into the system during COVID that was never taken out. In the 2008/2009 recession, the Federal Reserve expanded its balance sheet by about $1 trillion. During COVID they expanded the Fed balance sheet by about $4.5 Trillion, and to date they have only taken back about $1T of the initial $4.5T, so the U.S. economy has an additional $3.5T in liquidity that was not in the economy before 2020. That’s a lot of money to build a bridge to a possible soft-landing scenario.
Multiple Forces Acting On The Markets
We do expect escalated levels of volatility in the stock market in the fourth quarter. Not only do we have the market volatility surrounding the change in Fed policy, but we also have the elections in November that will inevitably inject additional volatility into the markets. As we get past the elections and enter 2025, we may return to more normal levels of volatility, because at that point the economy will know the political agenda for the next 4 years and some of the Fed rate cuts will have worked their way into the economy, potentially leading to stronger economic data in Q1 and Q2 of 2025.
All eyes will be on the race between the Fed rate cuts and the health of the economy.
About Michael……...
Hi, I’m Michael Ruger. I’m the managing partner of Greenbush Financial Group and the creator of the nationally recognized Money Smart Board blog . I created the blog because there are a lot of events in life that require important financial decisions. The goal is to help our readers avoid big financial missteps, discover financial solutions that they were not aware of, and to optimize their financial future.
Frequently Asked Questions (FAQs):
Why did the Federal Reserve cut rates by 0.50% in September 2024?
The Fed cut the Federal Funds Rate by 0.50% to support a slowing economy as inflation returned to its target range and the job market began to cool. The larger-than-expected cut was intended to provide earlier stimulus rather than waiting until the economy weakens further.
How do Fed rate cuts typically affect the economy?
Lowering interest rates makes borrowing cheaper for consumers and businesses, which can boost spending on homes, cars, and investments. However, it typically takes six to nine months for the effects of a rate cut to fully work through the economy.

A Market Selloff Triggered By A Fed Policy Error
The Fed made a significant policy error last week by deciding not to cut the Fed Funds rate and the stock market is now responding to that error via the selloff we have seen over the past week. Unfortunately, this policy error is nothing new. Throughout history, the Fed typically waits too long to begin reducing interest rates after inflation has already abated and they seem to be on that path again.

The Fed made a significant policy error last week by deciding not to cut the Fed Funds rate and the stock market is now responding to that error via the selloff we have seen over the past week. Unfortunately, this policy error is nothing new. Throughout history, the Fed typically waits too long to begin reducing interest rates after inflation has already abated and they seem to be on that path again.
The Fed’s primary objective is to create an economic environment with full employment and inflation in a range of 2% to 3%. The Fed's primary tool to achieve these objectives is the use of the Fed Funds rate, which has a dramatic impact on interest rates within the economy. When the economy runs too hot, the Fed raises interest rates to slow it down. When the economy begins to contract, the Fed lowers interest rates and makes lending more attractive to get the economy going again.
Think of the economy like a campfire; the Fed is the campfire attendant, and they have three tools at their disposal:
Logs
Gasoline
Garden hose
When the economy is growing rapidly, the fire can get too big and risks getting out of control. When that happens, the Fed can use the garden hose (raising interest rates) to dampen the blaze. Over the past 18 months, the Fed has raised rates to reduce inflation from the peak rate of 9% to the current rate of 3%.
Their use of the hose has also caused the labor market to soften which can be seen in the reduction in the rate of non-farm payroll gains:

It can also be seen in the recent rise in the unemployment rate (grey line) and the steady decline in wage growth (blue line):

While the Fed has successfully tamed the inflation blaze, it now runs a new risk: the fire going out completely, which results in the economy slipping into a recession.
As the fire dies down, the Fed's job is to add logs to the fire via interest rate cuts to keep the fire from going out completely.
Last Wednesday (July 31, 2024), the fire was at a level that it needed a log, but the Fed decided not to add one, and the stock market responded accordingly. The Fed does not meet again until September 17th, which is almost seven weeks away. They now run the risk that the fire gets too low before reaching that September meeting.
But there is also another risk that the market is digesting: if the fire does get too low or goes out before the September 17th meeting; for anyone that has ever used too much water on a fire, it can take a while to rebuild the fire. Meaning, if the Fed does wait until the September meeting to reduce interest rates by 0.25% - 0.50%, it historically takes 4 to 6 months before that decrease in interest rates has a positive impact on the economy, and that 4 to 6 month wait is usually ugly for the equity markets knowing that help is on the way but it’s not here yet.
If the recent market selloff escalates, I think there is a good chance that the Fed may need to step in before the September 17th meeting and announce a rate cut to calm the markets. While it may be viewed as an act of desperation to keep the economy from slipping into a recession, in my opinion, it’s something that should have already happened. It’s only logical that if inflation is in a safe range and trending downward, and labor markets are showing the same trend line of softening which they are, a 0.25% rate cut, at a minimum, is warranted given the fact that the rate cut will not have its positive impact for another 4 – 6 months.
Unfortunately, throughout history, the Fed has been late to both sides of the game. They typically wait too long to raise rates, which gave us the 9% inflation in 2022, and they historically wait too long to cut rates, which is why there has historically been turbulence from the equity market on the backside of Fed rate hike cycles.
If the Fed either steps in before the September 17th meeting to lower rates or if the economy can stabilize between now and the September meeting for a potentially larger rate cut from the Fed, markets may stabilize in the coming week, however, investors also have to be ready for an escalation of the current selloff and increased levels of volatility as the markets try to maneuver through the late-innings of the Fed’s tightening cycle. Otherwise, the economy could slip into a mild recession that so many economists were predicting in 2023 that never happened, and then the Fed will be forced to use gasoline on the fire via a series of rapid large rate cuts and/or direct injection of liquidity (bond buying).
About Michael……...
Hi, I’m Michael Ruger. I’m the managing partner of Greenbush Financial Group and the creator of the nationally recognized Money Smart Board blog . I created the blog because there are a lot of events in life that require important financial decisions. The goal is to help our readers avoid big financial missteps, discover financial solutions that they were not aware of, and to optimize their financial future.

The Coronavirus Battle Will Be Won Or Lost By April 30th
These are unprecedented times. Over the past few weeks we have spent countless hours researching past epidemics, listening to medical experts, economists, market analysts, hedge fund managers, and local business owners. Of all the
These are unprecedented times. Over the past few weeks we have spent countless hours researching past epidemics, listening to medical experts, economists, market analysts, hedge fund managers, and local business owners. Of all the things we’ve learned up to this point, one thing seems very clear to us, we should know by April 30th whether the U.S. economy is setting itself up for a quick recovery or a prolonged recession.
Why April 30th? Confirmed cases of the Coronavirus are going to spike in the upcoming weeks as test results come back. As we charge toward the peak of the infection rate, we will begin to see whether the inflection rate is accelerating or leveling out. All of this is driven by the effectiveness of the containment efforts that are being put in place now. But will it be enough and when will investors know which path the economy is on?
In addition, we are beginning to see some abnormal behavior from certain asset classes within the financial markets as stimulus packages and rate cuts are put to work by countries around the globe. In this article, we will present those trends and help investors prepare for what could be next for the financial markets.
A Race Against Time
The US economy is in a race against time. While every day the headlines are filled with breaking news about bailout packages, interest rate cuts, infection rates, and the stock market dropping by over 1000 points a day, at the risk of over oversimplifying it, there are really only 3 things that matter:
Containing the virus as soon as possible
Keeping businesses solvent during the shutdown
Providing individuals with financial assistance to pay their bills
These items are listed in the order of priority and I'm going to explain why.
#1: Containment
If the US government is not able to slow the infection rate by the end of April, it’s going to be difficult for many businesses to sustain operations without layoffs. While layoffs have already begun in industries directly impacted by the Coronavirus containment efforts such as restaurants, airlines, and hotels, this trend would most likely spread into the broader economy and make a quick recovery less likely.
The ideal scenario is the containment efforts prove effective and by the end of April the rate of infection decreases or levels out, fear subsides in the market knowing that progress is being made, and people resume travelling, restaurants reopen, and global spending and trade return to “pre-Corona” levels. In this scenario, the losses that we have seen in the U.S. stock market could rebound quickly in the second half of the year.
In addition, if there is swift recovery, the U.S. consumer and businesses now have access to lower interest rates, oil prices not seen since 2002, and an economy that would most likely resume it’s steady growth trend.
Error On The Side Of More
As we have seen in prior economic crises, problems become much larger when the government does not act fast enough or with enough firepower to manage the threat; that is especially true of the current situation. Understanding that time is everything in this situation, the government should be erroring on the side of more swift and restrictive measures to contain the virus. Rolling out containment efforts in pieces as we have seen over the past two weeks, in my opinion, creates more risk to achieving a positive outcome and from speaking with business owners over the past few days, it creates more disruption. If you are a business that is still allowed to operate in this environment but every day new restrictions are passed down in pieces, valuable time has to be taken to digest those rules, determine how it impacts the business, and then communicate the new restrictions to the employees. I have heard some business owners say “it would actually be better for us if they just shut everything down for two weeks”.
Erroring on the side of “more” will hurt the stock market and the economy in the short term but I think it will give us a better chance of avoiding a prolonged recession. But we will just have to wait to see how effective the current containment efforts are over the course of the next few weeks.
#2: Keeping Businesses Solvent
The second priority is keeping businesses solvent during the economic slowdown. Most businesses can survive disruptions that last 30 to 60 days if they are given access to cheap capital. It's for this reason that the Fed has rapidly dropped interest rates to almost zero and has pumped billions of dollars of liquidity into the system to encourage banks to lend. The U.S. government is also working on stimulus packages that would provide direct capital injection for industries most adversely effected by the containment efforts. What we are experiencing now is the first “all stop” global economic shutdown that we have ever seen. The government is trying to minimize the number of companies that go insolvent between now in the containment of the virus. At this point, it seems like the U.S. is doing an adequate job of opening up the cash floodgates for the companies here in the U.S.
#3: Financial Assistance For Individuals
The third priority is providing financial assistance for individuals that have been laid off so they can continue meet their basic needs while this containment process runs its course. There are discussions happening right now about the U.S. government sending everyone a check for $1,000, programs for deferring student loan payments, and encouraging financial institutions to create special programs for individuals that have been negatively impacted by the economic slowdown. But I placed this lower on the priority list than business solvency because most people can survive being laid off for a month or two with some financial assistance from the government, but if the current environment turns into a prolonged recession, they lose their job, and are unable to find work over the next 6 to 12 months, that it a much dire situation. It’s vitally important for the U.S. to preserve jobs during this containment period.
Abnormal Activity
When there are unprecedented events that occur in the markets, they bring with them abnormal behaviors within financial markets that tend to surprise investors. During the recent market selloff there are two unexpected events that have occurred:
The pace of the market selloff
Recent losses in the bond market
During the recent selloff, the U.S. stock market set a record when it lost over 20% if its value in just 16 days. By comparison, below is a chart of the other 20% declines in the stock market and the number of days it took for the 20% drop to happen.
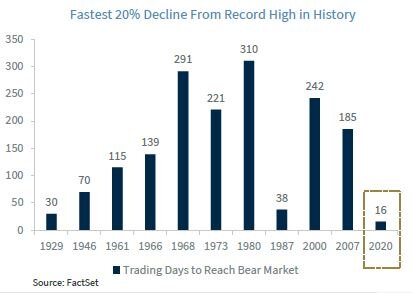
To us, this speaks to the fear and uncertainty surrounding the events that are currently unfolding in the markets. In addition, the average daily price movement of the S&P 500 Index over the past 2 weeks has been 5% per day. That’s a crazy amount of volatility.
Turning to the bond market, a surprising trend has unfolded over the past week. Typically, when the stock market is selling off, interest rates go down, and bond prices go up. This allows bonds to appreciate in value and offset some of the losses from the stock side of the portfolio. While this was the trend for the first two weeks of the sell off, that trend recently reversed. The stock market was selling off and interest rates where rising. This created an environment where both stocks and bonds were losing value at the same time. Not an ideal market environment for a diversified portfolio. On March 17th, the yield on the 10 year treasury bond went from 0.72% to 1.08% which is a big move for a bond yield in a single day, especially considering that the stock market was down that day.
Why did that happen? We can point to a few reasons. First, the bond market is anticipating a $1 trillion dollar stimulus package to be released by Congress. When the government wants to spend $1 trillion dollars, it does so by issuing bonds which is debt. The demand for bonds, especially of this magnitude, are not in high demand because governments around the world are also spending money to stimulate their own economy. To entice people to buy our bonds, they have to offer them at a higher interest rate.
Along those same lines, countries that hold our bonds have been selling them to raise cash to fund their own stimulus packages. As demand for U.S. bonds decreases, the interest rate goes up and the price of the bonds goes down. Will this trend continue? Interest rates could move slightly higher in the short-term but the Fed has the ability to step in and start buying U.S. bonds if it wants to lower interest rates. In addition, the flight to safety trade will most likely continue in upcoming weeks as the uncertainty surrounding the containment efforts persists which will also create additional demand for U.S. Treasuries.
What To Expect
As we sit here on March 19th, it’s tough to handicap which outcome is more likely: a quick bounce back or a prolonged recession. However, the upcoming few weeks are going to be key at providing us with evidence on the success or failure of the containment efforts. Investors need to be ready to make changes to their investment portfolios over the upcoming months as the likely outcome begins to surface. The current market environment has the makings to either be one of the greatest investment opportunities of all time or just the beginning of a prolonged slowdown in the U.S. economy. Emotions will temp investors to make irrational investment decisions but it’s important to keep the relevant economic and financial market data in focus. Stay safe, stay healthy, and we welcome any questions that you have regarding the current market environment.
Michael Ruger
About Michael……...
Hi, I’m Michael Ruger. I’m the managing partner of Greenbush Financial Group and the creator of the nationally recognized Money Smart Board blog . I created the blog because there are a lot of events in life that require important financial decisions. The goal is to help our readers avoid big financial missteps, discover financial solutions that they were not aware of, and to optimize their financial future.


Coronavirus vs. SARS: Buying Opportunity?
As fears of the Coronavirus continue to spread, this week was the largest drop in the stock market since the 2008 / 2009 financial crisis. On Thursday, February 27, 2020, the Dow Jones Index dropped by 1,191 points, making it the
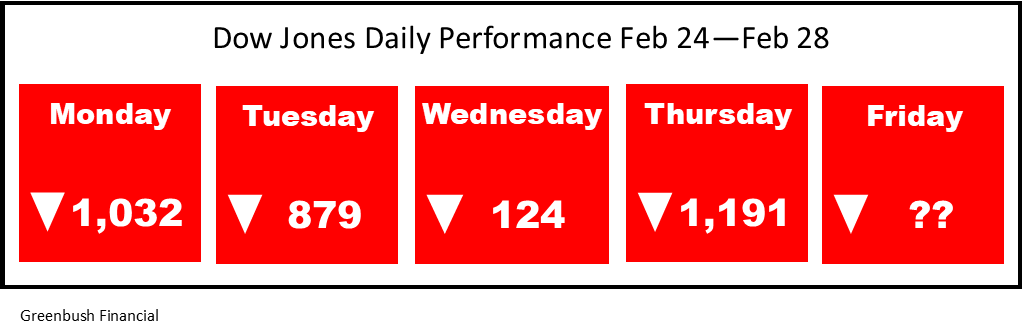
As fears of the Coronavirus continue to spread, this week was the largest drop in the stock market since the 2008 / 2009 financial crisis. On Thursday, February 27, 2020, the Dow Jones Index dropped by 1,191 points, making it the largest single day point drop in the history of the index. As the selling has intensified into the week, clients are asking us what we expect in the upcoming weeks. Should they be buying the dip? Do we expect a further selloff from here?
Like most major market events, we have to look back in history to find similar events that allow us to model how the markets might behave from here. This week, we have conducted extensive research into virus outbreaks that have happened in the past such as SARS, MERS, Zika, and Swine Flu, in an effort to better understand possible outcomes to the Coronavirus epidemic. In this article, I’m going to share with you:
Coronavirus vs SARS / Zika / other epidemics
What makes the Coronavirus different than other epidemics in the past
Why has this selloff been so fast & fierce
Disruptions to the global supply chain
Performance of the stock market following the end of epidemics in the past
Will the Fed lower rates to help the market
When does this become a buying opportunity for investors
Coronavirus vs SARS
We spent an extensive amount of time comparing Coronvavirus to SARS, and other epidemics in the past. Without a doubt, the Coronavirus is very different than many of the epidemics that we have seen in the past which is making financial modeling very difficult. When we compare the Coronavirus to SARS and other outbreaks, the rate at which the Coronavirus has spread in the first 30 days is unprecedented. Here are a few time lapse charts that compares the infection rate of the Coronavirus to SARS, Ebola, MERS, and Swine Flu.
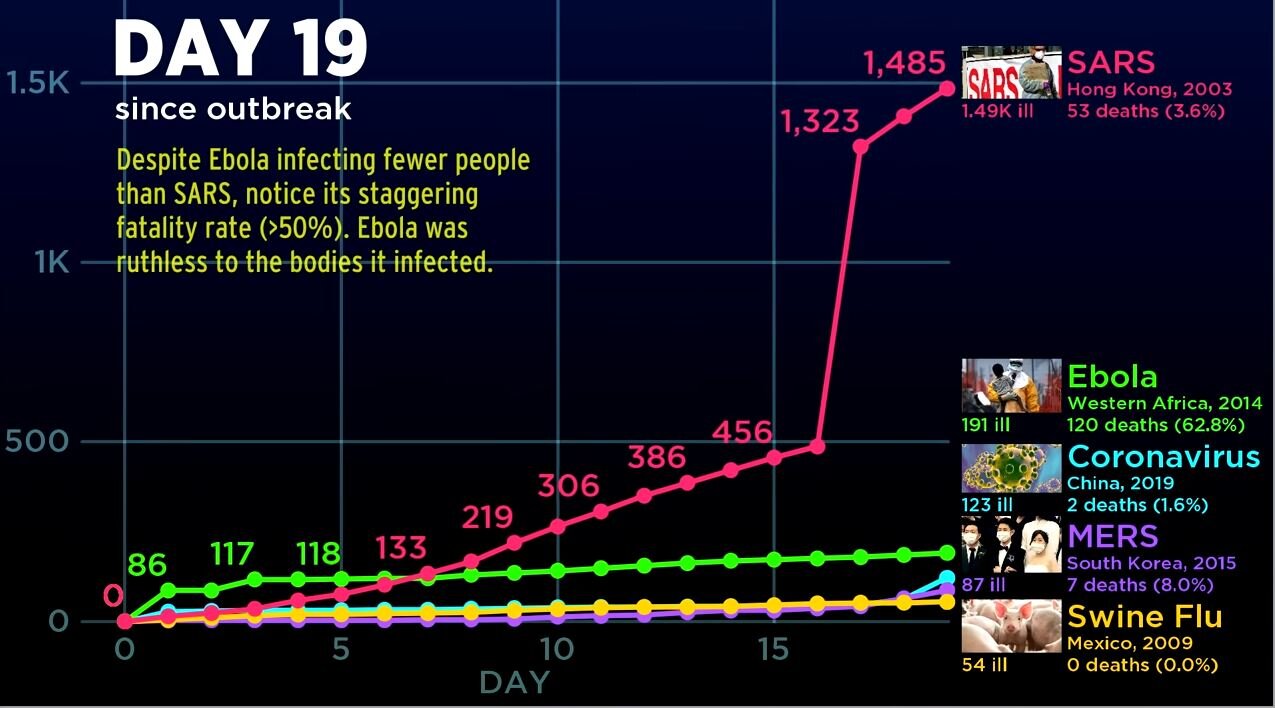
When you compare SARS to the Coronavirus at Day 19, SARS was much worse out of the gates. By Day 19, SARS had infected 1,490 people and 53 people had died, making the death rate 3.6%. By comparison, at Day 19, Coronavirus had only infected 123 people in China, and resulted in 2 deaths. Making the death rate 1.6%.
However, only 7 days later, at Day 26, the story completely changed:
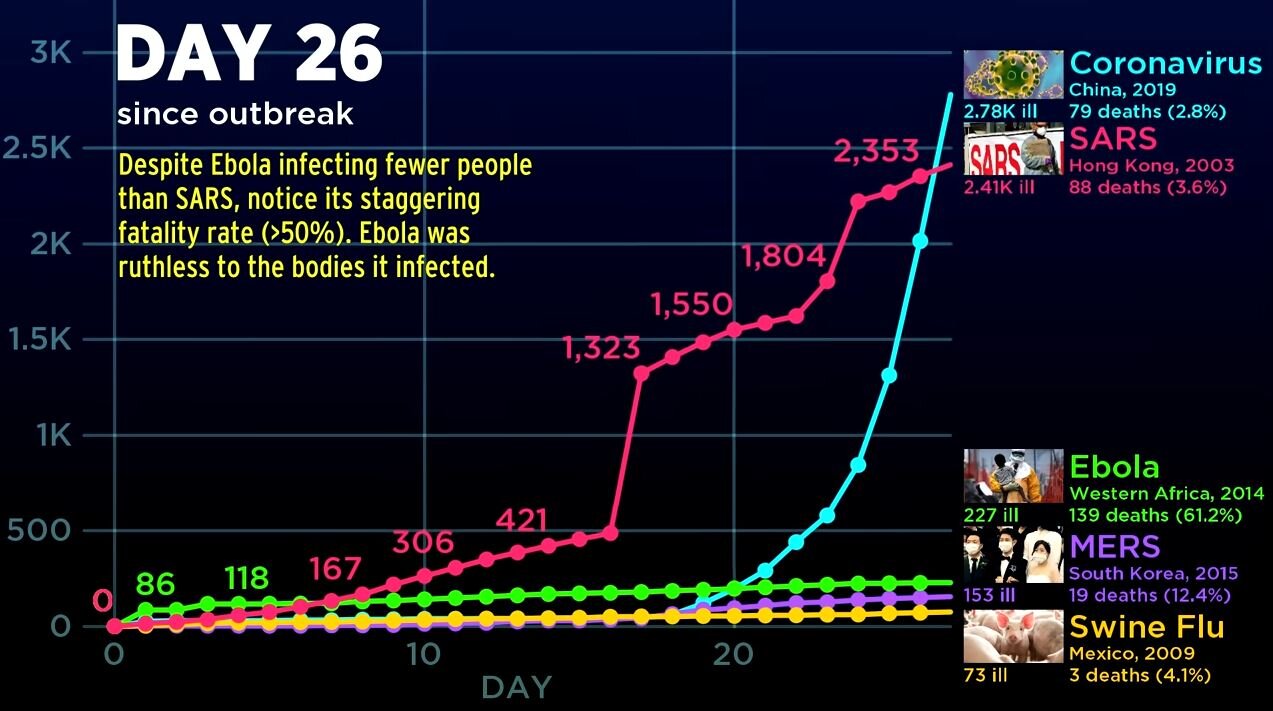
By Day 26, the number of confirmed cases of Coronavirus rocketed higher, outpacing that of SARS in the early 2000’s. In addition, the death toll for the Coronavirus jumped to 79 people.
But then it continued to get worse. By Day 43, the chart says it all:
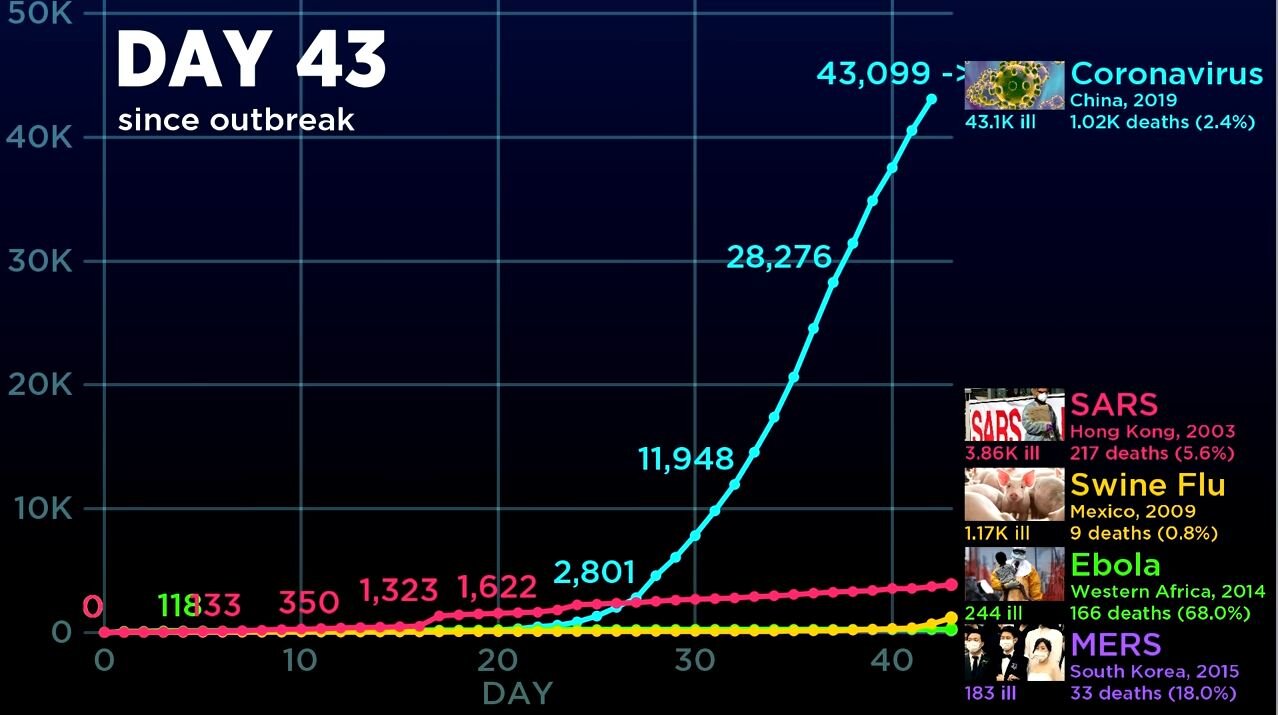
By day 43, the number of confirmed cases of the Coronavirus jumped to 43,099 compared to just 3,860 confirmed cases of the SARS virus during that same time period. The death toll for the Coronavirus had risen to over 1,000 people compared to 217 from SARS during that same time period. This chart highlights the main issue with the Coronavirus. It’s spreading faster than government’s are able to control compared to most epidemics in the past.
Now, I say “most” because when we started gathering the data, there is a chart that looks similar to the Coronravirus outbreak. If I move these charts forward to Day 122, this is what happened with the Swine Flu in Mexico in 2009.
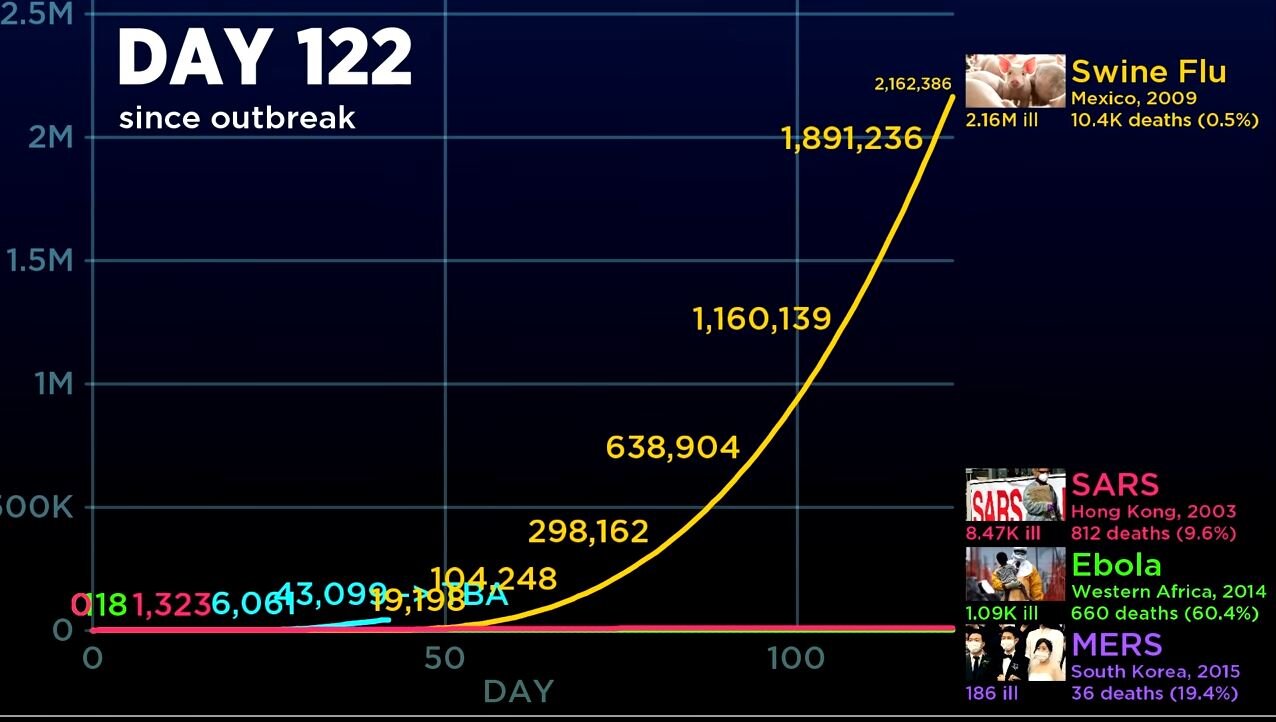
The Swine Flu was relatively mute for the first 50 days, but after day 50, the chart looks very similar to the fast spread of the Coronavirus. By Day 122, 2.1M people had been infected with the Swine Flu and over 10,000 people had died.
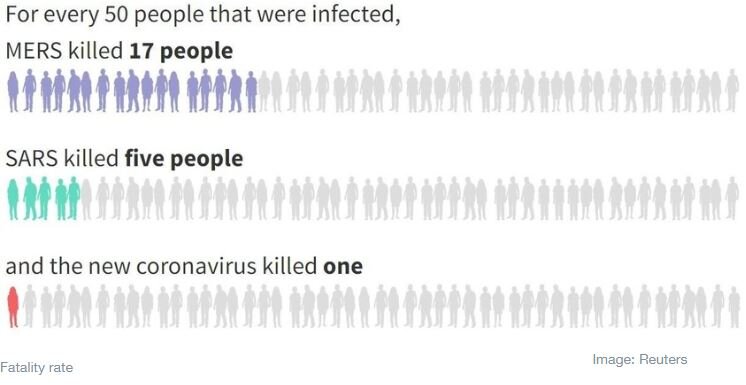
So why didn’t you hear more about the Swine flu when it was happening? The death rate of the Swing Flu was only 0.5%. Compare this to the current 2.1% estimated death rate of the Coronavirus, which is not as high as the SARS death rate of 4.9%, but it is significantly higher than the Swine Flu. Here is a chart comparing the death rate of SARS, Coronavirus, and MERS:
Another important note, the Swine Flu was fairly wide spread as well. See the chart below from the World Health Organization on the Swine Flu:

However, given how fast the Coronavirus is spreading in it’s early stage, it could end up having a larger global footprint than the Swine Flu if they are unable to contain it soon.
Key Takeaway From The Comparison
Our key takeaway from this comparison is that Coronavirus has spread more quickly in the early stages compared to past epidemics which represents a larger risk to the markets than in the past. Due to the pace of the spread, it’s difficult to put an estimated timeline together for containment. When we look at the comparison of Coronavirus to the Swine Flu, it shows that there could be further downside risks to the markets if the spread of the virus follows a similar glide path.
Coronavirus Disruption To The Market
We issued an article earlier this week explaining the business impact of the Coronavirus.
Article: Coronavirus & The Market Selloff
I just want to quickly summarize again what’s causing the market selloff from a business standpoint. As the Coronavirus continues to spread to other regions, it forces governments to restrict the movements of its people in an effort to contain the spread of the virus. This means transportation is shut down, events are canceled where there would have been large gatherings of people, and employees are not going to work. Also, when people are afraid, they don’t go out to eat, and they don’t go shopping. All of these things have a direct impact on the revenue of the companies that make up the stock market. When these companies entered 2020, there was no expectation that their manufacturing operations could be completely shut down due to a global health epidemic. The stock market right now is trying to determine how much it needs to discount the prices of these companies based on the revenue that’s being lost.
The longer the epidemic continues, the longer it takes people to get back to work, the longer it takes people to resume their normal spending habits, and the more damage it does to the markets.
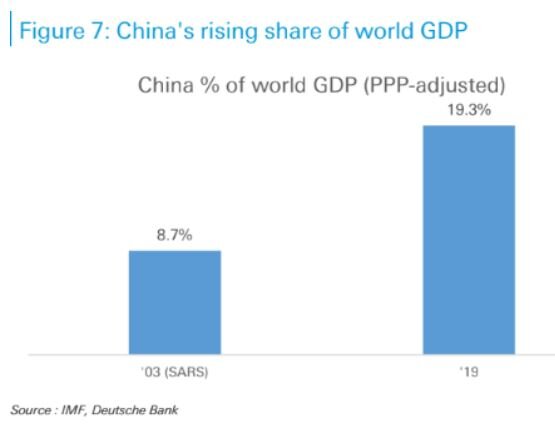
The China Impact
When comparing SARS to the Coronavirus it’s also important to acknowledge the growth in the size of China’s economy between 2003 and 2020. When the SARS outbreak happened in 2003, China’s economy only represented 8.7% of global GDP. As of 2019, China’s economy now equals 19% of total global GDP. Since the Coronavirus has been the most wide spread in China, It will have a much larger impact on the markets around the globe compared to the SARS outbreak when China was a much smaller player in the global economy.
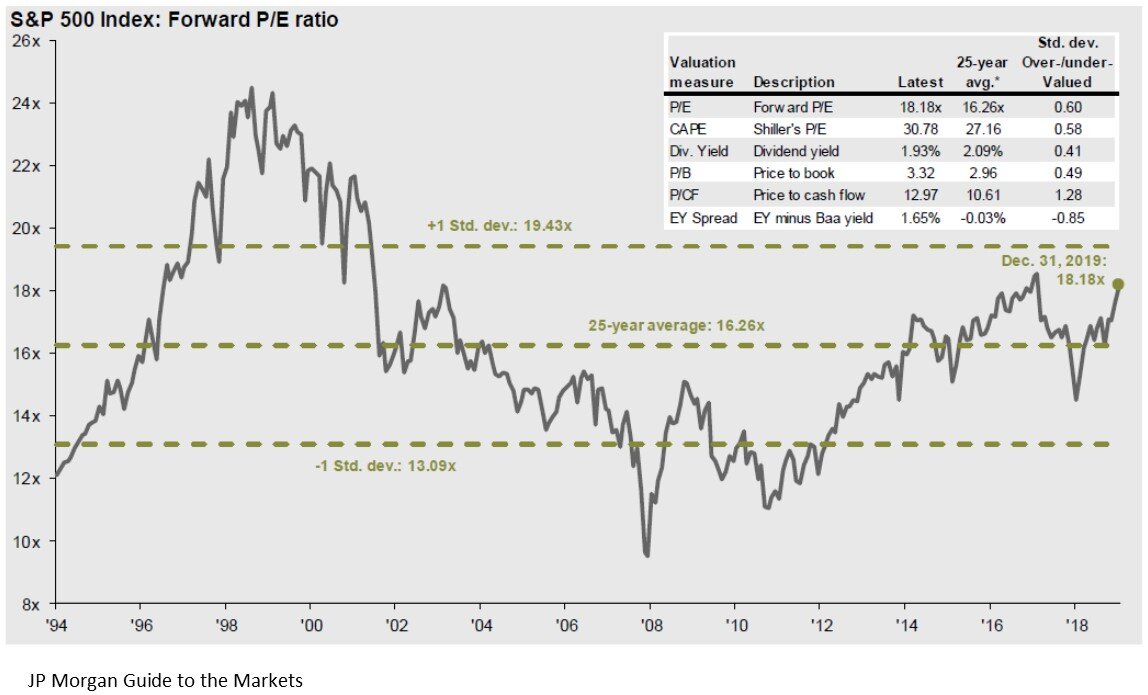
Valuations in the U.S. Stock Market
In our opinion, one of the other big factors that has fueled the magnitude of the selloff here in the U.S., is the simple fact that going into 2020, the stock market was overvalued already by historic terms. As of December 31, 2019, the P/E ratio of the S&P 500 was 18. The 25 year historical average P/E for the S&P 500 Index is 16. This essentially means that stocks were expensive going into the beginning of the year. When stocks are already arguably overvalued, and a negative event happens, the prices have to drop by more realizing that those companies are not going to produce the earnings growth for the upcoming year that was already baked into the stock price.
Fed Lowering Rates
There is talk now of the Fed coming to the markets aid and lowering interest rates throughout the year. Going into 2020, it was the market’s expectation that the Fed was going to remain on hold for 2020. In my opinion, the rate cuts are probably warranted at this point, given the unexpected slowdown to the global economy as a result of the Coronavirus. But I would also warn that the Fed lowering interest rates is not in itself going to heal the markets. Giving companies access to cheaper capital is not going to make people feel safer about traveling around the globe and it’s not going to help manufacturers resume operations if their employees can’t get to the factory due to travel restrictions.
However, giving companies access to cheaper capital will allow them to better weather the storm while the governments around the world work on a containment plan. Without that access to cheap capital, you could see companies going under because it took revenue too long to ramp back up.
Global Supply Chain
Investors should not underestimate the damage that has been done to the global supply change and how long it takes to get the supply chain back up and running again. A good example are car manufacturers. They do not typically keep large inventories of parts, and if those parts are not being made, they’re not being shipped, meaning they can’t build the cars, so they can’t sell the cars, and revenue drops.
Within the electronics industry, a lot of the products are made up of hundreds if not thousands of components, and the product does not work without all of those components. If there is one computer chip that is made in Korea, and the manufacturing of those chips has been halted, then the end product cannot be built and shipped. The examples go on and on but when you think of manufacturing around the globe being brought offline, it’s not like a light switch where you can go and simply turn it back on. It takes a while for it to get back up and running again. So while investors might think the Coronavirus could just impact Q1 revenue, it’s more likely that it will impact revenue beyond just the first quarter.
When Do You Buy The Dip?
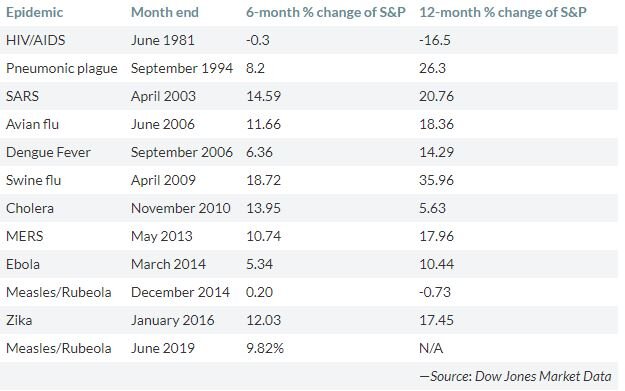
I have received a lot of calls from clients asking if they should begin buying stocks at these lower levels with the anticipation of a bounce back. When we look at other epidemics in the past, there has been a sizable rally in the stock market 6 to 12 months after the epidemic has ended. The chart below shows each epidemic and the subsequent 6 month and 12 month return of the S&P 500 after the epidemic ended. On average, the stock market rose 20% a year following the end of the epidemic which is why investors are eager to buy into the selloff.
In my personal opinion, at some point, the Coronavirus will be contained and it will create an opportunity for investors. There is pent up demand being accumulated now that will need to be filled after the virus is contained. Individuals will most likely reschedule vacations and travel plans once they feel it’s safe to travel around the globe, and the Fed, via lower rates, will have given companies access to even cheaper capital to grow. But as I write this article on February 28th, I caution investors. When you look at the data that we’ve collected, there could definitely be more downside to the selloff if they are unable to contain the spread of the Coronavirus within the next few weeks. The market right now is just trying to guess how much damage has been done with no real solid guidance as to whether it’s guessing right or wrong.
It may be prudent to wait for evidence that progress is being made on the containment efforts of the virus before buying back into the market. For long term investors, it’s important to understand that while the Coronavirus will undoubtedly have an impact on the revenue of companies in 2020, in the past, epidemics have rarely changed the fate of solid companies over the long term.
Michael Ruger
About Michael……...
Hi, I’m Michael Ruger. I’m the managing partner of Greenbush Financial Group and the creator of the nationally recognized Money Smart Board blog . I created the blog because there are a lot of events in life that require important financial decisions. The goal is to help our readers avoid big financial missteps, discover financial solutions that they were not aware of, and to optimize their financial future.


Coronavirus & The Market Selloff
Today was a wild ride for the stock market. The Dow Jones posted a loss of 1,031 points on February 24, 2020 as fears of the continued spread of the Coronavirus sparked a selloff in the stock market. Over the past 24 hours, we've
Today was a wild ride for the stock market. The Dow Jones posted a loss of 1,031 points on February 24, 2020 as fears of the continued spread of the Coronavirus sparked a selloff in the stock market. Over the past 24 hours, we've received the following questions from clients that I want to address in this article:
Why is the market selling off on this news?
Do you think the selloff will continue?
Should you be moving money out of stocks into bonds?
Why Is Market Selling Off On This News?
You have to remember that the stock market is made up of individual companies. Each company’s stock price is just an educated guess by investors as to how much those companies are going to make in profits over the next 3 months, 1 year, 5 years, and beyond. Unexpected events like the Coronavirus create large deviations between those educated guesses and actual results.
In the case of the Coronavirus, it’s disrupting the revenue stream of many companies that produce and sell goods across the globe. For example, Nike receives 17% of its revenue from China, and the company has temporarily closed more than half of its stores in China. The stores that remain open are operating on abbreviated hours. If the stores are not open, then they can’t sell Nike shoes and apparel, which will most likely cause Nike’s Q1 revenue to be lower than expected. That in turn could cause the stock price to drop once the Q1 earnings report is released later this year.
But it’s not just Nike. The S&P 500 Index is made up of a lot of companies that sell goods in China and other locations around the world: Apple, Yum Brands, McDonalds, Proctor & Gamble, and the list goes on. Beyond just retail, you have airlines, hotels, and casinos that are being negatively impacted as people cancel travel plans and vacations. The point I’m trying to make is there are real business reasons why the stock market is reacting the way it is, it’s not just displaced fear.
All of these companies are trying to figure out right now what the impact will be to their revenue. The next question then becomes, how much are these companies going to miss by?
Do You Think the Selloff Will Continue?
That leads us into the next questions which is “do you think the selloff will continue?” Historically, contagious disease outbreaks have been quickly contained, such as the SARS outbreak in the early 2000’s. The amount of damage to the markets seems to be highly correlated to the amount of time it takes to contain the outbreak. The longer it takes to contain the outbreak, the longer it takes people to return to work and to return to their normal spending habits. The news broke this morning that there are new confirmed cases of the Coronavirus in Italy and South Korea which makes investors question whether or not the threat has been contained.
Unfortunately, there is no solid answer as to how long the current selloff might last. It could end tomorrow or it could continue off and on over the next few weeks. But it’s important to remember that even though market events like the Coronavirus do impact the short-term profitability of companies, it’s less common that these types of events impact the long-term performance. When you have a selloff sparked by a single market event versus a full blown recession, it’s not uncommon for long term investors to start stepping into the market and buying stocks at these lower levels.
Should You Be Moving Money Out Of Stocks Into Bonds?
This bring us to the final question, should you be making changes to your investment portfolio based on today’s market events? In my opinion, the answer to that is “no” but I think there is a lesson to be learned for investors that are still overweight stocks in their portfolio. Over the past year, the stock market has appreciated rapidly in value but the growth rate of corporate earnings has lagged behind. When this happens, stocks start to become overvalued, and the market becomes more vulnerable to selloffs.
This week the selloff was sparked by the Coronavirus, a few months from now it could be fears surrounding the elections in the U.S., trade, or some other geopolitical event. When you enter the later stages of an economic expansion, volatility, which has been largely absent from the U.S. stock market over the past few years, becomes a common place. Investors that have elected to stay overweight riskier asset classes in the later stages of this economic cycle, need to make sure they have the risk tolerance and discipline to weather these market selloffs.
Michael Ruger
About Michael……...
Hi, I’m Michael Ruger. I’m the managing partner of Greenbush Financial Group and the creator of the nationally recognized Money Smart Board blog . I created the blog because there are a lot of events in life that require important financial decisions. The goal is to help our readers avoid big financial missteps, discover financial solutions that they were not aware of, and to optimize their financial future.


Manufacturing Is Contracting: Another Economic Indicator Flashes Red
Yet another important economic indicator rolled over this week which has triggered a sell-off in the U.S. equity markets. Each month the Institute of Supply Management (“ISM”) issues two reports: Manufacturing ISM ReportNon-
Yet another important economic indicator rolled over this week which has triggered a sell-off in the U.S. equity markets. Each month the Institute of Supply Management (“ISM”) issues two reports:
Manufacturing ISM Report
Non-Manufacturing ISM Report
A reading above 50 indicates an expansion and a reading below 50 indicates a contraction. The Manufacturing ISM Report was released on Tuesday and it showed a reading of 47.8 for September indicating that manufacturing in the U.S. is beginning to contract. Not only was it the first contraction of the index within the last few years but the index reached a level not seen since 2009. In this article we will cover:
Why the ISM Index is important
Historically what happens to the stock market after the reading goes below 50?
What caused the unexpected drop in the ISM index?
Manufacturing trends around the globe and how they could impact the U.S. stock market
Why The ISM Index Is Important
The ISM Manufacturing Index tells us how healthy the manufacturing sector of the U.S. economy is. This index is also referred to as the Purchasing Managers Index (PMI) and I will explain why. The ISM issues a monthly survey to more than 300 manufacturing companies. The purchasing managers at these big manufactures are on the front line when it comes to getting a read on the pulse of business conditions. The survey includes questions on the trends in new orders, production, inventories, employment, supply chain, and backlog orders. The ISM assigns weightings to each metric, aggregates all of the responses together, and it results in the data point that signals either an expansion or a contraction.
If most of the manufactures in the U.S. have a ton of new orders, inventories are low, and they are looking to hire more people, that would most likely produce a reading above 50, implying that the outlook is positive for the U.S. economy as these big manufactures ramp up production to meet the increase in demand for their products.
On the other hand, if these surveys show a drop off in new orders, inventories are rising, or hiring has dropped off, that would most likely produce a reading below 50, implying that manufacturing and in turn the U.S. economy is slowing down. Analysts will use the ISM index to get a read on what corporate earnings might look like at the end of the quarter. If the index is dropping during the quarter, this could be foreshadowing a shortfall in corporate earnings for the quarter which the stock market will not find out about until after the quarter end.
Here is a historic snapshot of the ISM’s Manufactures Index:
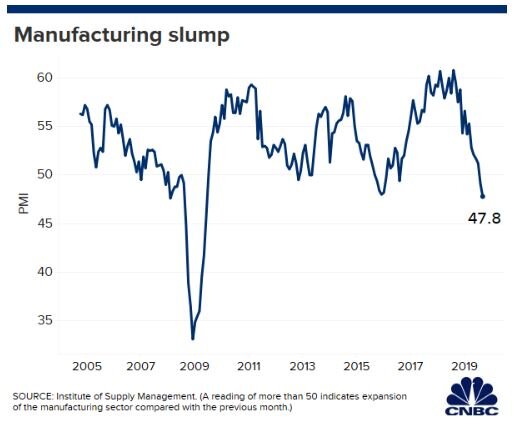
As you will see in the chart, manufacturing has been slowing over the course of the past year but up until September, it was still expanding at a moderate pace. For September, economists had broadly expected a reading of 50.4 but the ISM report produced a result of 47.8 signaling a contraction for the first time since 2016.
What Does This Mean For The Stock Market?
So in the past, when the ISM Index has gone below 50, what happened to the stock market? To answer that question, let’s start by looking at a chart that shows the correlation between the ISM Index and the S&P 500 Index:
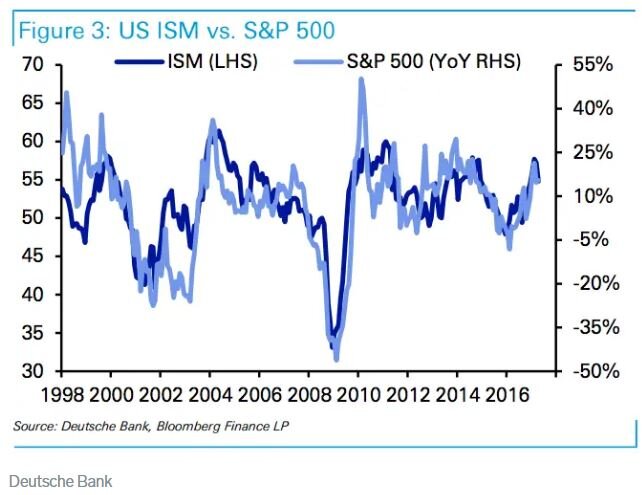
The dark blue line is the ISM index and the light blue line is the S&P 500 Index. Looking at this data, I would highlight the following points:
The ISM Index and the S&P 500 Index seem to move in lockstep. While the ISM might give you a preview of what quarterly earnings might look like, it does not give you a big forward looking preview of bad things to come. By the time the ISM index starts dropping, the stock market is already dropping with it.
We need more data. There have been a few times that the index has gone below 50 within the last 20 years and it has not been followed by a recession. Look at 2016 for example. The ISM index dropped below 50, but if you trimmed your equity positions at that point, you missed the big rally from January 2017 through September 2019. We need more data because historically multiple back to back months of readings below have signaled a recession.
If the index hits 45 or lower within the next few months, watch out below!!
What Caused The Most Recent Drop In The ISM Manufactures Index?
When it comes to unexpected market events, there is usually a wide mote of differing opinions. But it seems like the most recent drop could be attributed to a continued weakening of spending by U.S. businesses. While the U.S. consumer seems to still be strong and spending money, spending by businesses on big ticket items has tapered off over the past few months.
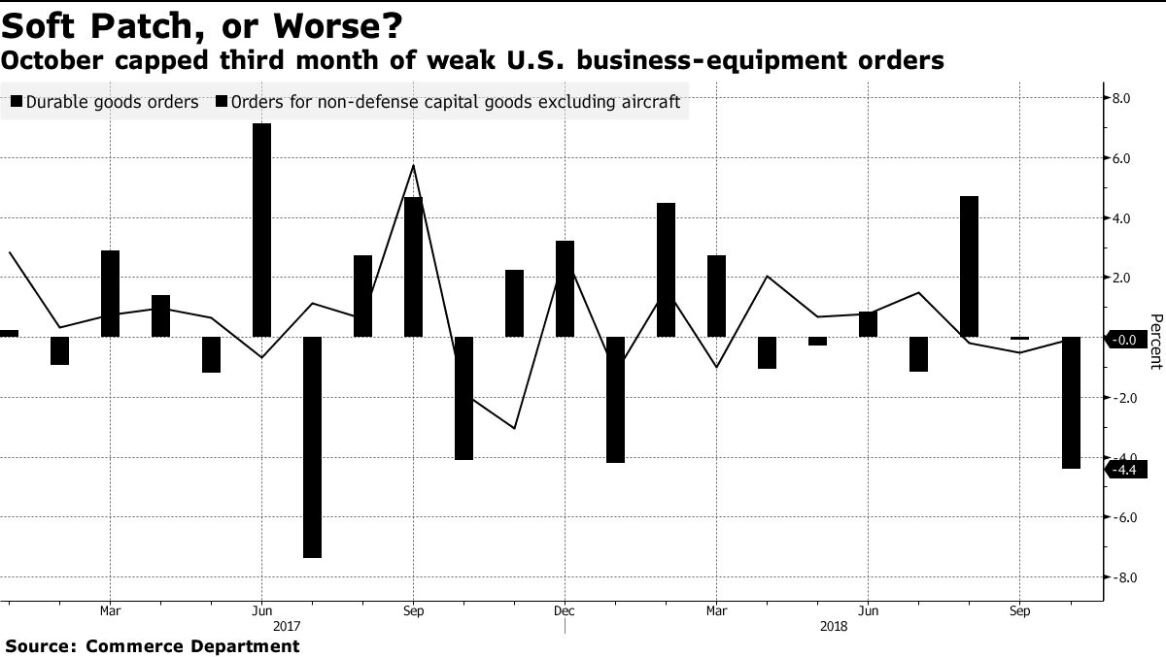
As you will see in the chart above, durable goods orders have dropped over the past two months which is the main barometer for business spending. When businesses are uncertain about the future, they tend to not spend money and business owners have no lack of things to be worried about going into 2020. The growth rate of the U.S. economy has been slowing, uncertainty surrounding global trade continues, and 2020 is an election year. One or more of these uncertainties may need to resolve themselves before businesses are willing to resume spending.
Global Manufacturing Trends
While manufacturing in the U.S. just started contracting in September, the picture is a little darker when we look at the manufacturing trends in other parts of the world. Below is a heat map that shows the PMI Index for countries all around the world. Here is how you read it:
Green is good. Manufacturing is expanding
Yellow is neutral: Manufacturing is flat
Red is bad: Manufacturing is contracting
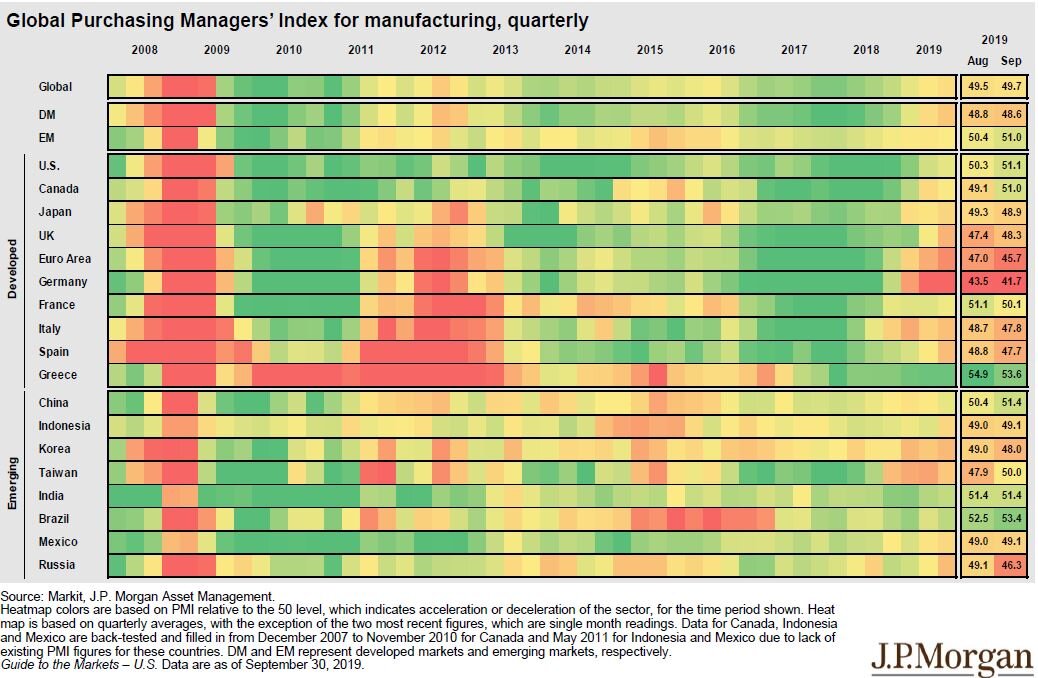
If you look at 2017 and 2018, there was a lot of green all around the world indicating that manufacturing was expanding around the globe. As we have progressed further into 2019, you are beginning to see more yellow and in some areas of the world there is red indicating contraction. Look at Germany in particular. There has been big change in the economic conditions in Europe and the global economy is very interconnected. The weakness that started in Europe seems to be spreading to other places throughout the globe.
ISM Non-Manufacturing Index
Now, you could make the argument that the U.S. is a services economy and it does not rely heavily on manufacturing, so how much does this contraction in manufacturing really matter? Well, if we switch gears to the ISM Non-Manufacturing Index which surveys the services sector of the US economy, the September report just came out with a reading of 52.6 compared to the 55.3 that the market was expecting. This is also down sharply from the 56.4 reported for August.
While the services sector of the U.S. economy is not contracting yet, it seems like the numbers may be headed in that direction.
What Investors Should Expect
There are pluses and minuses to this new ISM data. The contraction of the ISM Manufactures Index and the deceleration of the growth rate of the ISM Non-Manufactures Index in September is just another set of key economic indicators that are now flashing red. Implying that we may be yet another step closer to the arrival of the next recession in the U.S. economy.
The only small positive that can be taken away from this data is that the Fed now has the weak economic data that it needs to begin aggressively reducing interest rates in the U.S. which could boost stock prices in the short term. But investors have to be ready for the rollercoaster ride that the stock market may be headed towards as these two forces collide in the upcoming months.

About Michael……...
Hi, I’m Michael Ruger. I’m the managing partner of Greenbush Financial Group and the creator of the nationally recognized Money Smart Board blog . I created the blog because there are a lot of events in life that require important financial decisions. The goal is to help our readers avoid big financial missteps, discover financial solutions that they were not aware of, and to optimize their financial future.