
What Causes Bonds To Lose Value In Certain Market Environments?
Bonds are often revered as a safe investment compared to stocks but make no mistake, bonds like other investments are not risk-free, and there are certain market environments where they can lose value. As I write this article in May 2022, the Aggregate Bond Index is currently down 8% year to date.

Bonds are often revered as a safe investment compared to stocks but make no mistake, bonds like other investments are not risk-free, and there are certain market environments where they can lose value. As I write this article in May 2022, the Aggregate Bond Index is currently down 8% year to date. While this is definitely a more extreme year for the bond market, there are other years in the past where bonds have lost value.
How do bonds work?
Bonds in their most basic form are essentially loans paid with interest. Companies, government entities, and countries issue bonds to raise money to fund their operations. When you buy a bond you are essentially lending money to these organizations in return for interest payments and potentially appreciation on the value of the bond. Similar to traditional loans, bonds can default, interest can be fixed or variable, and bonds are issued for varying durations. But unlike loans, the value of your original investment can fluctuate over the life of the bond.
Bond example
Before we get into all of the variables associated with bonds, let’s first look at a basic example. The US government is issuing a 10-year treasury bond with a 3% interest rate. You buy $10,000 worth of bonds so essentially you are lending the US government $10,000 for a duration of 10 years and during that 10 years, the US government will pay you 3% interest every single year, then after 10 years, the bond matures, the US government hands you back your $10,000.
Credit worthiness
Similar to someone asking to borrow money from you, all bond issuers are not created equal. You have to assess the credit worthiness of the company or organization that is issuing the bonds to make sure that they are going to be able to make their interest payments and return your principal at the maturity date. “Maturity date” is just bond lingo for when the bond issuer has to repay you the amount that you lent to them. When the US government issues bonds, they are considered by the market to be some of the safest bonds in the world because they are backed by the credit worthiness of the United States government. It would be a historic event if the US government were to default on its debt because the government can always print more money or raise taxes to make the debt payments. Compare this to a risky company, that is trying to emerge from bankruptcy, and is issuing bonds to raise capital to turn the company around. This could be viewed as a much riskier investment because if you lend that company $10,000, you may never see it again if the company is unable to emerge from bankruptcy successfully. For this reason, you have to be selective as to who is issuing you the bond.
Bond rating agencies
Thankfully there are bond rating agencies that help investors assess the credit worthiness of the bond issuer. The two main credit rating agencies are Standard & Poors and Moody’s. Both have grades that they assign to each bond issuer that can range from AAA for the highest quality issuers all the way down to D. It’s important to look at both rating agencies because they may assign different credit scores or in the bond world called “quality ratings” to a bond issuer. But as we learned during the 2008 and 2009 recession, even the bond rating agencies sometimes make the wrong call, so you should complete your own due diligence in assessing the credit worthiness of a particular bond issuer.
Bond defaults
When a company or government agency defaults on its debt it’s ugly. All of the creditors of the company including the bondholders line up to split up whatever’s left, if there is anything left. There could be a number of creditors that have priority over bondholders of a company even though bondholders have priority over stockholders in a company. If you bought a $10,000 bond from a company that goes bankrupt, you have to wait for the bankruptcy process to play out to find out how much, if any, of your original $10,000 investment will be returned to you.
Bond coupon rate
A bond coupon is the interest rate that is paid to the bondholder each year. If a bond has a 5% coupon that means it pays the bondholder 5% in interest each year over the life of that bond. While there are many factors that determine the interest rate of a bond, two of the primary factors are the credit worthiness of the organization issuing the bonds and the bond’s duration.
The credit worthiness of the bond issuer probably has the greatest weight. If a high-risk company is issuing bonds, investors will most likely demand a high coupon rate compared to a more financial stable company to compensate them for the increased level of risk. If a 10 year US government bond is being issued for a 3% coupon rate, a high-risk corporate bond may be issued at a coupon rate of 7% or more. Higher risk bonds are sometimes referred to as high yield bonds or junk bonds. On the flipside, organizations with higher credit ratings, normally have the luxury of issuing their bonds at lower interest rates because the market views them as safer.
The coupon payments, or interest payments, can be made to the bondholder in different durations during the year depending on the terms of the bond. Some bonds issue interest payments quarterly, semi-annually, once a year, and some bonds don’t issue any interest payments until the bonds matures.
It’s because of this fixed interest-rate structure that high quality bonds are often viewed as a safer investment than stocks because the value of a stock varies every day based on what the value of the company is perceived to be. Whereas bonds just make fixed interest payments and then re-pay you the face value of the bond at a future date. “Face value” is bond lingo for the dollar amount the bond was issued for and the amount that is returned to the bondholder at maturity.
Fixed interest versus variable interest
While most bonds are issued with a fixed interest rate, some bonds have a variable interest rate. If it’s a fixed interest rate, the bond pays the holder a set interest payment over the life of the bond. If it’s a variable interest rate, the interest rate paid to the bond holder can vary throughout the life of the bond. Some of the more common types of bonds that have variable interest rates are floating rate bonds. The interest rate that these bonds pay is typically tied to the variable rate associated with a short term bond benchmark like the LIBOR or the fed funds rate. As the interest of those benchmarks moves up and down, so do the corresponding interest rate paid by the bond.
Duration of a bond
The next big factor that influences the interest rate on a bond is the duration of the bond. “Duration” is bond lingo for the length from time between when the bond is first issued and when the bond matures. Typically, the longer the duration of the bond, the higher the interest rate which makes sense. If a company wants to borrow $10,000 from you for 1 year versus 10 years, as the person lending them the money, you will most likely want a higher interest rate for a 10 year loan versus a 1 year loan because they are holding onto your money for a longer period of time which represents a greater risk to you as the bondholder.
Interest rate risk
Bonds also have something called interest rate risk. Typically, when interest rates rise, the value of a bond falls, and vice versa if interest rates fall, the value of a bond rises. Up until this point, we have really just talked about coupon payments or interest payments made to a bondholder but the bond itself can change in value over the life of the bond. Let’s say a company is issuing bonds at $1,000 face value each, you buy a bond for $1,000 and at maturity you would expect to receive $1,000 back, but from the time that bond is issued and when it matures, you can normally trade that bond in the open market, and the value of that bond could sell for more or less than your original $1,000 investment.
If you buy a bond from a company that is a 10 year bond with a 5% interest rate but then interest rates across the economy begin to fall, and a year from now investors have difficulty finding bonds that are being issued with a 5% interest rate, another investor may pay you more than $1,000 to buy your bond and collect the 5% interest payment for the rest of that bonds life. So instead of just receiving $1,000 for the bond you may receive $1,500. The value paid over and above the bonds face value is considered appreciation which adds to your total return so the total return on a bond investment includes both dividends received and any appreciation if you sell it prior to maturity.
But that is a two way street, using that same example above, let’s say a company issues you a bond for $1,000 paying a 5% coupon, but now interest rates have moved higher over the next year, and that same company is now issuing bonds at a 7% interest rate, no one wants your 5% bond because they can get a higher interest-rate by buying the new bonds today. If you were to try and sell your bond in the open market you may only receive $900 from another investor because again, they can just pay $1,000 by purchasing the new bonds with the higher interest rate.
Holding to maturity
If you hold bonds to their maturity, which means you don’t trade them while you’re waiting for the bond to mature, it eliminates a lot of this interest-rate risk because then it’s just a pure loan. You lent a company $1,000, they pay you interest over the life of the loan, and then they hand you back your $1,000 at maturity. Interest rates do not impact the face value of a bond in most cases.
However, when we talk about bond mutual funds, those bond funds can hold hundreds or thousands of bonds, and those mutual funds are priced by “marking to market” each day, meaning they total up all of the value of the bonds in that portfolio as if they were all being sold at 4pm each day. It’s similar with bond ETFs but they trade intraday. Thus, if you own bonds via mutual funds or ETFs, interest-rate fluctuations will have a greater influence on the total return of your bond investment because there’s no option to just hold it to maturity. Depending on the interest rate environment this could either work for you or against you. The reason why many high-quality bond funds have lost value in 2022 is because interest rates have risen rapidly this year which has caused the value of those bonds to fall.
Duration Matters
There is a correlation between the time to maturity and the impact of interest rates on the price of a bond. The longer the duration of the bond, the more that can happen to interest rates between the time a bond is issued and the time the bond matures. For this reason, when interest rates move, it typically has a greater price impact on longer term bonds versus short-term bond.
Simple example, your own a bond paying 4% that is maturing in 1 year and another bond paying 4% that matures in 20 years, interest rates are moving higher, and the equivalent bonds are now being issued at a 5% coupon rate. Both of your bonds would most likely drop in value but the bond that is maturing in one year will most likely drop by less because they will return your investment sooner, and you can reinvest that money at the new higher rate compared to the 20 year bond that is locked in at the lower interest rate for the next 20 years.
Why would you own a bond mutual fund?
After reading this, I’ll have investors ask, “why would you own a bond mutual fund versus individual bonds if you have this interest rate risk?” For most investors, the answer is diversification. If you have $100,000 to allocate to bonds, purchasing a few different bond funds may be a more efficient and cost-effective way to obtain a diversified bond portfolio compared to purchasing individual bonds. As mentioned earlier, these bond mutual funds may have thousands of bonds within this single investment which have been selected by a professional bond manager that understands all of the intricacies of the fixed income markets. Compare this to an individual investor that now has to go out and select each bond, do their own analysis on a variety of different bond issuer‘s to create diversification of credit, duration, and coupon payments to create their own diversified portfolio. Also, since we’ve been in historically low interest rate environments, many fixing income investors have been reluctant to lock into a bond ladder which is a popular strategy for individual bond investors.
Creating a diversified bond portfolio
Similar to stocks, when investing in bonds, it’s important to create a diversified portfolio to help safeguard bondholders against risk. Within a diversified bond portfolio, you may have bonds with varying credit ratings to help achieve a higher level of interest overall with the safer bond issuer‘s offsetting some of the more risky ones that are paying a higher interest rate. You may have bonds that are varying in duration from short-term, intermediate term, all the way to long-term bonds which may also allow a bond investor to achieve higher rates of return over the long term but maintain the necessary amount of liquidity because the short-term bonds are always maturing and are less sensitive to interest rate risks.

About Michael……...
Hi, I’m Michael Ruger. I’m the managing partner of Greenbush Financial Group and the creator of the nationally recognized Money Smart Board blog . I created the blog because there are a lot of events in life that require important financial decisions. The goal is to help our readers avoid big financial missteps, discover financial solutions that they were not aware of, and to optimize their financial future.
Frequently Asked Questions (FAQs):
How do bonds work?
Bonds are loans made by investors to governments, corporations, or other entities in exchange for regular interest payments and the return of principal at maturity. The bond’s interest rate, called a “coupon,” is determined by factors such as the issuer’s creditworthiness and the bond’s duration.
Why do bonds lose value when interest rates rise?
When market interest rates increase, newly issued bonds offer higher yields, making older bonds with lower rates less attractive. As a result, the market value of existing bonds typically falls, even though the issuer continues to make the same interest payments.
What is interest rate risk?
Interest rate risk is the potential for bond prices to decrease when interest rates rise. The longer the bond’s duration, the more sensitive it is to interest rate changes, which is why long-term bonds generally experience greater price swings than short-term bonds.
Are government bonds safer than corporate bonds?
Generally, yes. U.S. government bonds are backed by the full faith and credit of the federal government, making them among the safest investments. Corporate bonds, on the other hand, carry varying degrees of risk depending on the company’s financial health and credit rating.
What role do bond rating agencies play?
Agencies like Standard & Poor’s and Moody’s assign credit ratings to bond issuers, helping investors assess default risk. Ratings range from AAA (highest quality) to D (in default). While helpful, investors should still perform their own due diligence.
Why would an investor choose a bond fund instead of individual bonds?
Bond mutual funds and ETFs provide diversification by holding many bonds across different sectors, maturities, and credit qualities. This approach spreads risk and simplifies management, though it also exposes investors to daily price fluctuations and interest rate risk.
What is the difference between fixed and variable rate bonds?
Fixed-rate bonds pay a set interest rate for their entire term, while variable-rate bonds adjust their interest payments periodically based on a benchmark rate, such as the federal funds rate or LIBOR. Variable-rate bonds can help reduce interest rate risk in rising-rate environments.

Additional Disclosure: All bonds are subject to interest rate risk and you may lose money. Before investing in, you should carefully consider and understand the risks associated with investing. U.S. Treasury bonds and municipal bonds maybe susceptible to some of the following risks: Lower yields, interest rate risk, call risk, inflation risk and credit or default risk. Investors need to be aware that bonds may have the risk of default.


Is Inflation Peaking? That’s The Wrong Question…….
While a lot of investors are asking if inflation has peaked, there is a more importnat question they should be asking which will have a bigger impact on our path forward…….

As I write this article on May 11, 2022, the inflation number was just released for April indicating an 8.3% increase in the Consumer Price Index (CPI) which is the primary measure of the inflation rate. The news and market analysts seem to be consumed with the question “has inflation peaked?” Since the April CPI reading was below the March CPI of 8.5%, the answer may very well be “yes”, but I think there is a more important question that analysts and investors should be paying attention to and I would argue that the answer to this question will be more meaningful to the markets. Here it is, looking at all of the drivers of inflation right now, how does the inflation rate get back down to a level that will help the U.S. economy to avoid a recession?
Claiming victory that inflation has peaked could be a very short celebration if the level of inflation REMAINS at an elevated level for longer than the market and the Fed expects.
The Inflation Problem Has Become More Complex
At the end of 2021, it seemed to be the consensus that the primary driver of higher inflation was due to supply chain constraints in a post COVID world. The solution to that problem seemed fairly simple, as the global supply chain heals, there will be more goods to buy, and prices will gradually come down throughout 2022; but that has changed now. It’s not just supply chain issues that are driving inflation any longer, we now have:
Global supply chain issues
Russian / Ukraine conflict
Oil still over $100 per barrel
Tight labor markets
Wage growth
Strong corporate earnings but weaker forecasts
Fed policy
I would also argue that some of the inflation catalysts listed above will have a more significant impact on the rate of inflation than just the COVID supply constraints. In this article I’m going to walk you through the trends that we are seeing in each of these inflation catalysts and how they could impact inflation going forward. We do not believe that the market is doomed to enter a recession at this point but with so many more forces driving inflation higher, monitoring what really matters to the longer term inflation trend should be foremost in the mind of investors as the war against inflation enters the second half of the 2022.
Russia / Ukraine Conflict
Russia’s continued assault on Ukraine has caused a number of supply chain disruptions in itself but none more impactful to the U.S. than the price of oil. The price of oil has been over $100 per barrel for months which is huge driver of inflation since goods need to be transported on planes, ships, trucks, and trains. Oil companies are not in a rush to produce more because they are enjoying lofty profits and they realize that the price of oil could come down quickly if the violence ends in Ukraine. This is why they are hesitant to spend a lot of money to bring more production online because the price of oil could drop down to $80 or below within the next few months. Could oil go higher from here? It could. The Chinese economy has recently been hampered by COVID outbreaks so demand for oil has eased within the last month, but if this changes you could see the price of oil hit new highs on increased demand from China and we are about to enter the summer travel season in the U.S. If oil prices stay above $100 per barrel throughout the summer, it may keep inflation at elevated levels for longer than anticipated.
The Price of Oil
We just went through what’s driving the price of oil higher but if the price of oil drops within the next few months it’s not an automatic victory. If the price of oil is dropping because there is more supply coming online or because there is peace in Ukraine that is excellent, that should reduce inflationary pressures. However, if the price of oil is decreasing because demand is beginning to soften because the consumer is beginning to buy less, that’s not a positive indicator.
More Jobs Than Workers
Currently there are 5.9 million unemployed people in the U.S., and as of March there are 11.5M job openings which puts us at 2 job openings for every 1 person looking for work. If you look at the chart below of the total job openings, it’s easy to see that we are in uncharted territory here:
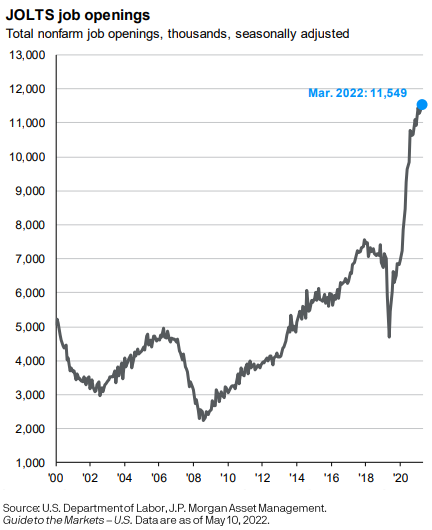
So, when you have more jobs than people looking for work, what do you think is going to happen to wages? They are going to go up. When you look back in history, one of the largest drivers of big inflationary periods is wage growth. Think about it this way, if the government hands you a stimulus check, you will be able to buy more stuff or pay higher prices for goods and services than you normally would, but this is temporary. Once you have spent that government stimulus money, you can no longer afford to pay higher prices.
If you change jobs, and you receive a $30,000 raise, now you can pay higher prices, not just this year but next year, and the year after that. Wage growth creates “sticky inflation”. It doesn’t just go away when the supply chain recovers or when oil prices retreat. As of April, wage growth has risen 6.4% over the past year, and the last time we saw wage growth over 6% was the 1970’s which not so coincidentally was a period of prolonged hyperinflation.
The only way I can foresee wage growth decreasing is a slow down in the economy which raises the risk of a recession. It’s simple supply and demand. If you have more jobs than people to fill them, companies will have to pay hire wages to attract and keep employees, the companies will most likely pass those higher costs onto the consumer in the form of higher prices, eventually the consumer can no longer afford those higher prices, the economy slows down, and then those excess jobs are eliminated. Not a fun storyline.
Subtle Warning Signs In Corporate Earnings
The tone from the Fed at the beginning of 2022 was that they will be raising rates to slow down inflation, but the economy is strong enough to withstand the rate hikes and we should be able to avoid a recession. The U.S. economy is driven primarily by consumer spending, and the consumer definitely showed up to spend in the first quarter of 2022. However, while many of the companies in the S&P 500 Index exceeded earning expectations, a number of them softened their outlook for the remainder of 2022 due to rising input costs and the impact of higher prices on consumer spending. Knowing that the stock market and bond market are forward looking animals, even though inflation has not taken a huge toll on corporate earnings yet, clouds are beginning to form which investors should pay close attention to.
Tech Stocks Getting Hit
As of May 9th, the S&P 500 Index is down 16% but the Nasdaq is down 26%. When inflation shows up, valuations begin to matter over a company’s growth story because cash becomes king. Here is how I explain it, if inflation is going up at 8% per year, if I ask you if you want me to give you $1 today or $1 a year from now, you would choose $1 today because a year from now, that dollar would have less purchasing power, because inflation is causing the price of everything to go up. It works the same way with stock prices.
The market uses P/E Ratios to determine how expensive stock is which is simply a company’s stock price divided by its earnings per share. If a company’s stock price is $100 and they are expected to earn $100 in profit for each share of stock, the P/E ratio would be 1. But it’s common for stocks to trade at 10, 15, or even 30 times one year of forward earnings. The higher the PE ratio, the more assumed future growth is built into the price of that stock. Some growth companies have very little in terms of net profit because they are spending a lot of money to make their big growth dreams come to life. These growth stocks can sometimes trade at a PE of 50, 100, or higher!!
When inflation hits and investors realize a dollar today is more valuable than a dollar tomorrow, they have to begin to discount those future returns that are built into stock prices. A stock that is trading at 50 times their one year earnings will typically have to drop in price a lot more than a stock that is only trading at 10 times it’s future one year earnings because you have to discount 50 years of earnings instead of 10.
Fed Policy
The last variable in the inflation equation is Fed policy. The Fed has a really tough job right now, reduce inflation without pushing the economy into a recession. When it was just supply chain issues, I think the market had it right by describing it as “the Fed is trying to engineer a soft landing”. With new inflationary forces now entering the equation, I would describe the Feds task as “threading a needle while the needle is moving”.
At the May meeting, the Fed announced, as expected, a 0.50% increase to the Fed funds rate, but during that meeting they also dismissed that a future 0.75% rate hike was on the table. The markets cheered and rose significantly that day hearing that a 0.75% hike was unlikely but then the next day the market lost all of those gains, and continues to add to the losses - worried that the Fed was not raising rates fast enough to keep higher inflation at bay.
It's All About Inflation
While a lot of attention is being given to the Fed and what the Fed might do next, the focus has to come back to not just stopping inflation from going higher but how do they get inflation to decrease fast enough before it derails the consumer. I highlight all of these inflation variables because you could get good news on supply chain improvements and corporate earnings but if oil remains above $100 per barrel and wage growth is still 6%+, it difficult to picture how the year over year change in the inflation rate gets below 4% or 5% before the end of the year.
The consumer is everything. If the consumer has higher wages and the cash reserves to withstand the higher prices while the Fed is working to bring inflation down, it is possible that we could see a rally in the second half of the year. But the long inflation persists, the less likely that relief rally scenario becomes.
This Time It’s Different
I urge all investors to be careful here. In the investment world you will sometimes hear the phase “this time it’s different” or “we have never been here before” which can add additional stress and anxiety to a market environment that is already scary. I urge caution here because in 2022 there has been a trend that is very different. In most market downturns, when stocks go down, bonds will typically be up, which is one of the benefits of a properly diversified portfolio. When you compare historical returns of the S&P 500 Index versus the Aggregate Bond Index, you will see this pattern:
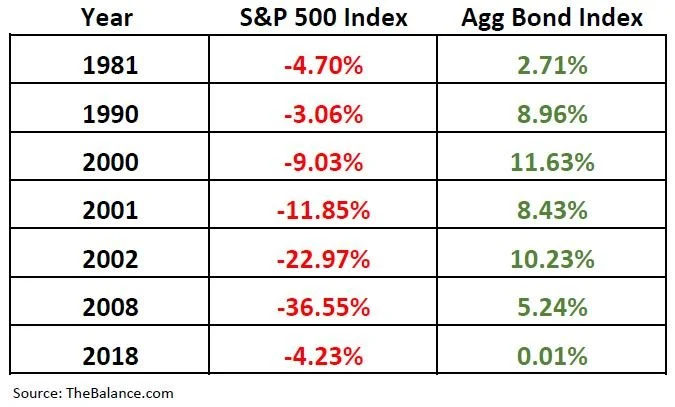
Unfortunately, as of May 9, 2022, stocks and bonds are both down a significant amount year-to -date:

It feels like we are getting close to a fork in the road. Either we will begin to see meaningful improvement in the inflation rate over the next few months setting both the stock and bond market on a path to recovery in the second half of 2022, or despite the Fed’s best efforts, regardless of whether or not we have seen a peak in inflation, if inflation does not come down a meaningful amount by the fall, the U.S. economy may slip into a mild recession in 2023. Until we know, investors will have to pay very close attention to these monthly indicators that are driving the inflation rate.
About Michael……...
Hi, I’m Michael Ruger. I’m the managing partner of Greenbush Financial Group and the creator of the nationally recognized Money Smart Board blog . I created the blog because there are a lot of events in life that require important financial decisions. The goal is to help our readers avoid big financial missteps, discover financial solutions that they were not aware of, and to optimize their financial future.
Frequently Asked Questions (FAQs):
What is driving inflation in the U.S. right now?
Inflation remains elevated due to several overlapping factors, including ongoing supply chain disruptions, the Russia–Ukraine conflict, high oil prices, labor shortages, and rising wages. These pressures have made inflation more complex than it was during the early stages of the post-COVID recovery.
Has inflation peaked?
While inflation readings may have eased slightly since their highs, a single month’s data does not confirm a lasting peak. The more important question is how quickly inflation can return to sustainable levels without triggering a recession.
Why does the Russia–Ukraine conflict matter for inflation?
The war has pushed global energy prices higher, particularly oil, which remains above $100 per barrel. Because fuel costs affect nearly all goods and transportation, elevated oil prices can keep inflation high even if other pressures, such as supply chains, improve.
How do wage increases affect inflation?
Strong wage growth creates what economists call “sticky inflation.” When workers earn significantly more, they can afford to pay higher prices for longer, which keeps overall inflation elevated. Wage growth above 6%—as seen recently—makes it harder for inflation to decline quickly.
What role does the Federal Reserve play in controlling inflation?
The Federal Reserve raises or lowers interest rates to influence borrowing, spending, and overall economic activity. In 2022, the Fed began aggressively hiking rates to cool inflation. The challenge is to slow demand enough to lower prices without pushing the economy into recession.
Why are both stocks and bonds down at the same time?
In most downturns, bonds rise when stocks fall, providing diversification. But in 2022, both declined because rising interest rates hurt bond prices while inflation pressures weighed on stock valuations—an unusual combination that made diversification less effective.
Could persistent inflation lead to a recession?
If inflation remains high for too long, it can erode consumer purchasing power and corporate profits, forcing the Fed to tighten policy further. Prolonged inflation without significant progress in lowering prices increases the risk of a mild recession in 2023.


Russia & Ukraine: Where Does The Stock Market Go From Here?
Russia’s invasion of Ukraine continues to add uncertainty to global markets. It’s left investors asking the following questions:
Russia’s invasion of Ukraine continues to add uncertainty to global markets. It’s left investors asking the following questions:
What is the most likely outcome of the invasion?
How will this impact the U.S. stock market and global economy?
How high will oil prices go?
Should the U.S. be worried about a Russia cyberattack?
What is China’s role in this conflict?
Will the stock and bond market crash in Russia create a global liquidity event?
Does this change the Fed’s timeline for interest rate hikes?
Do we expect a relief rally or the market selloff to continue?
We will provide you with our answers to these questions in this market update.
About Michael……...
Hi, I’m Michael Ruger. I’m the managing partner of Greenbush Financial Group and the creator of the nationally recognized Money Smart Board blog . I created the blog because there are a lot of events in life that require important financial decisions. The goal is to help our readers avoid big financial missteps, discover financial solutions that they were not aware of, and to optimize their financial future.

Will The January Market Selloff Continue?
The markets have experienced an intense selloff in the first three weeks of 2022. As of January 21st, the S&P 500 Index is down over 7% for the month. There are only a few times in the past 10 years that the index has dropped by more the 5% in a single month. That begs the questions, “After those big monthly declines, historically, what happens next?”

The markets have experienced an intense selloff in the first three weeks of 2022. As of January 21st, the S&P 500 Index is down over 7% for the month. There are only a few times in the past 10 years that the index has dropped by more the 5% in a single month. That begs the questions, “After those big monthly declines, historically, what happens next?” Continued decline? Market recovery? We are going to answer that question in this article
The recent selloff has also been widespread. The selloff in January has negatively impacted stocks, bonds, crypto, while inflation continues to erode the value of cash. It has essentially created a nowhere to hide market environment. As of January 21, 2022, the YTD returns of the major indices are:
S&P 500 Index: -7.7%
Nasdaq: -12.0%
Small Cap 600: -8.5%
Agg (Bonds): -1.7%
Bitcoin: -24.1%
In this article I’m going to cover:
What has caused the selloff?
Do we expect the selloff to continue?
This Has Happened Before
How many times has the S&P 500 index dropped by more than 5% in a month over the past 10 years?
Answer: 4 times
February 2020: -18.92%
November 2018: -5.56%
December 2015: -6.42%
July 2011: -10.40%
Next question: How many times did the S&P 500 Index post a positive return 3 months following the month with the 5%+ loss?
Answer: ALL OF THEM
Mar 2020 – May 2020: 16.7%
Dec 2018 – Feb 2019: 9.5%
Jan 2016 – Mar 2016: 8.6%
Aug 2011 – Oct 2011: 4.0%
Don’t Make The Jump In / Jump Out Mistake
There is no doubt that the big, swift downturns in the markets bring fear, uncertainty, and stress for investors but all too often investors let their emotions get the better of them and the lose sight of the biggest economic trends that are at work. The most common phrase that I hear from investors during these steep declines is:
“Maybe we should just go to cash to stop the losses and then we can buy back into the stock market once the risks have passed.”
The issue becomes: when do you get back in? Following these big temporary sells offs in the market, it is common that the lion share of the gains happened before things feel good again. Investors get back in after the market has already rallied back, meaning they solidified their losses and they are now allocating money back into stocks when they have returned to higher levels.
We accurately forecasted higher levels of volatility in the market in 2022 when we release our 2022 Market Outlook video. It is also our expectation that with inflation rising and the Fed moving interest rates higher, the selloff that we have experienced in January, will not be the only steep selloff that we are faced with this year. Before we get into the longer- term picture, let’s first look at what prompted the January selloff in the markets.
What Caused The Market Selloff in January?
There are a number of factors that we believe has caused this severe selloff in January:
COVID Omicron cases have surged
The Fed’s more hawkish tone
Rising interest rates
Tech sector selloff
COVID investment plays unwinding
Loss of enhanced child tax credit monthly payments
While that looks like a long list, at the risking sounding like a broken record, if you go back to the Market Outlook video that we released in December, all of these were expected. It’s only when unexpected events occur that we then have to shift our strategy for the entire year. Let’s look at each of these items one by one:
COVID Cases Have Peaked
One thing that caught the market by surprise over the past few months is how contagious the Omicron variant was and how many cases there would be. This caused the recovery story to stall as safety measures were put back into place to control the spread of the most recent variant. The good news is it looks like the cases have peaked and are now on the decline. See the chart below:

It's a little tough to see in the chart but the blue line represents the number of confirmed COVID cases. If you look all the way on the righthand side, as of January 20th, they have dropped dramatically. The 7-day moving average has dropped by about 100,000 cases. This trend supports our forecast that the economy will begin opening up again starting in February. We expect the reopening trade story to be part of the market rally coming off of this tough January for the markets.
The Fed’s Hawkish Tone
It's the Fed’s job to keep inflation under control so the economy does not overheat. Inflation has been running at rate of over 6% for the past several months and going into 2022, the Fed telegraphed making 3 rate hikes in 2022. After the Fed’s January meeting, an even more hawkish tone was found in those meeting minutes, suggesting that more than 3 rate hikes could be on the table this year. This caused interest rates to rise rapidly which hurt both stocks and bonds in January.
But let’s take a look at history. The last time the Fed started raising rates was in 2016. Between 2016 and 2018, they hiked the Fed Funds Rate 8 times. During that two-year period, the S&P 500 was up 15.8%. The lesson here is just because the Fed is beginning to raise rates does not necessarily mark the end of the bull market rally.
Rising Interest Rates
Interest rates rose sharply in January which put downward pressure on both stocks and bonds. Investor often have bonds in their portfolio to offer protection when the there are selloffs in the stock market but when interest rates are moving high and the stock market is selling off at the same time, both stocks and bonds tend to move lower together. The yield on the 10 Year Treasury jumped from 1.51% on December 31, 2021 to 1.86% on January 18, 2022. That does not sound like a big increase but in terms of interest rates that is a huge move in 18 days. (In percentage terms, over 23%)
We do expect interest to continue to rise in 2022 but not at the concentrated monthly pace that we saw in January.
Tech Stock Drop
Tech stock took a big hit in January. The Nasdaq is down 12% in the first three weeks of 2022. In the 2022 Market Outlook we talked about tech stock coming under pressure this year in the face of rising interest rate and a lesson from the 1970’s about the “Nifty Fifty”. These tech stocks tend to trade at higher valuations. Interest rates and valuation levels tend to have an inverse relationship meaning if a stock is trading at a higher valuation level (P/E), they tend to be more adversely affected compared to the rest of the market when interest rates move higher.
COVID Investment Plays Unwind
In January, stocks that were considered “stay at home” COVID plays, like streaming, home exercise equipment, and electronic document providers experience large corrections. Here are some of the names that fall into that space and their performance YTD as of January 21, 2022:
Netlfix: -33%
Peloton: -23%
DocuSign: -23%
Now that the United States has reached a level of vaccinations and positive COVID cases that would suggest that we are at or close to herd immunity, there seems to be a higher likelihood that future COVID variants may not cause extreme economic shutdowns that supported the higher valuation level of these “stay at home” investment strategies.
Loss of Child Tax Credit Payments
Since the Build Back Better bill did not pass in December 2021, the $300+ per month that many parents were receiving for the Enhanced Child Tax Credits stopped in January. While those monthly payments to families were only meant to be temporary, it was highly anticipated that they were going to be extended into 2022 with the passing of the Build Back Better bill. Not having that extra money every month could slow down consumer spending in the first quarter of 2022.
Do We Expect The Selloff To Continue?
No one has a crystal ball but I would be very surprised if we do not see a recovery rally in the markets over the next few months. I think people underestimate the amount of money that has been injected into the U.S. economy over the past 18 months. If you total up all of the COVID stimulus packages over the past 18 months, they total $6.9 Trillion dollars. Compare that to the TARP Stimulus package that saved the banks and housing market in the 2008/2009 recession which only totaled $700 Billion. A lot of that stimulus money has yet to be spent due to supply change and labor constraints over the past year.
It's our expectations that the supply chain, which is already showing improvement, will continue to heal as we move further into 2022, which will give rise to higher levels of consumer spending and in turn, higher corporate earnings.
Inflation will be the greatest risk to the economy in 2022, but if the recovery of the supply chain causes prices to stabilize and consumers have the cash and wages to pay these temporarily higher prices, the bull rally could continue in 2022. But again, it will be choppy. The market could experience numerous corrections similar to what we are experiencing in January that investors may have to hold through, especially as the Fed begins to announce interest rate hikes later this year. We expect patience to be rewarded in 2022.

About Michael……...
Hi, I’m Michael Ruger. I’m the managing partner of Greenbush Financial Group and the creator of the nationally recognized Money Smart Board blog . I created the blog because there are a lot of events in life that require important financial decisions. The goal is to help our readers avoid big financial missteps, discover financial solutions that they were not aware of, and to optimize their financial future.


What Caused The Market To Sell Off In September?

What Caused The Market To Sell Off In September?
The stock market experienced a fairly significant drop in the month of September. In September, the S&P 500 Index dropped 4.8% which represents the sharpest monthly decline since March 2020. I wanted to take some time today to evaluate:
· What caused the market drop?
· Do we think this sell off is going to continue?
· Have the recent market events caused us to change our investment strategy?
September Is Historically A Bad Month
Looking back at history, September is historically the worse performing month for the stock market. Since 1928, the S&P 500 Index has averaged a 1% loss in September (WTOP News). Most investors have probably forgotten that in September 2020, the market experienced a 10% correction, but rallied significantly in the 4th quarter.
The good news is the 4th quarter is historically the strongest quarter for the S&P 500. Since 1945, the stock market has averaged a 3.8% return in the final three months of the year (S&P Global).
The earned income penalty ONLY applies to taxpayers that turn on their Social Security prior to their normal retirement age. Once you have reached your normal retirement age, this penalty does not apply.
Delta Variant
The emergence of the Delta Variant slowed economic activity in September. People cancelled travel plans, some individuals avoided restaurants and public events, employees were out sick or quarantined, and it delayed some companies from returning 100% to an office setting. However, we view this as a temporary risk as vaccination rates continue to increase, booster shots are distributed, and the death rates associated with the virus continue to stay at well below 2020 levels.
China Real Estate Risk
Unexpected risks surfaced in the Chinese real estate market during September. China's second largest property developer Evergrande Group had accumulated $300 billion in debt and was beginning to miss payments on its outstanding bonds. This spread fears that a default could cause issues other places around the globe. Those risks subsided as the month progressed and the company began to liquidate assets to meet its debt payments.
Rising Inflation
In September we received the CPI index report for August that showed a 5.3% increase in year over year inflation which was consistent with the higher inflation trend that we had seen earlier in the year. In our opinion, inflation has persisted at these higher levels due to:
· Big increase in the money supply
· Shortage of supply of good and services
· Rising wages as companies try to bring employees back into the workforce
The risk here is if the rate of inflation continues to increase then the Fed may be forced to respond by raising interest rates which could slow down the economy. While we acknowledge this as a risk, the Fed does not seem to be in a hurry to raise rates and recently announced plans to pare back their bond purchases before they begin raising the Fed Funds Rate. Fed Chairman Powell has called the recent inflation trend “transitory” due to a bottleneck in the supply chain as company rush to produce more computer chips, construction materials, and fill labor shortages to meet consumer demand. Once people return to work and the supply chain gets back on line, the higher levels of inflation that we are seeing could subside.
Rising Rates Hit Tech Stocks
Interest rates rose throughout the month of September which caused mortgage rates to move higher, but more recently there has been an inverse relationship between interest rates and tech stocks. As interest rates rise, tech stocks tend to fall. We attribute this largely to the higher valuations that these tech stocks trade at. As interest rates rise, it becomes more difficult to justify the multiples that these tech stocks are trading at. It is also important to acknowledge that these tech companies have become so large that the tech sector now represents about 30% of the S&P 500 Index (JP Morgan Guide to the Markets).
Risk of a Government Shutdown
Toward the end of the month, the news headlines were filled with the risk of the government shutdown which has been a reoccurring issue for the U.S. government for the past 20 years. This was nothing new, but it just added more uncertainty to the pile of negative headlines that plagued the markets in September. It was announced on September 30th that Congress had approved a temporary funding bill to extend the deadline to December 3rd.
Expectation Going Forward
Even though the Stock Market faced a pile of bad news in September, our internal investment thesis at our firm has not changed. Our expectation is that:
· The economy will continue to gain strength in coming quarters
· There is a tremendous amount of liquidity still in the system from the stimulus packages that has yet to be spent
· People will begin to return to work to produce more goods and services
· Those additional goods and services will then ease the current supply chain bottleneck
· Interest rates will move higher but they still remain at historically low levels
· The risk of the delta variant will diminish increasing the demand for travel
We will continue to monitor the economy, financial markets, and will release more articles in the future as the economic conditions continue to evolve in the coming months.
About Michael……...
Hi, I’m Michael Ruger. I’m the managing partner of Greenbush Financial Group and the creator of the nationally recognized Money Smart Board blog . I created the blog because there are a lot of events in life that require important financial decisions. The goal is to help our readers avoid big financial missteps, discover financial solutions that they were not aware of, and to optimize their financial future.


Paying Tax On Inheritance?

Not all assets are treated the same tax wise when you inherit them. It’s important to know what the tax rules are and the distribution options that are available to you as a beneficiary of an estate. In this video we will cover the tax treatment on inheriting a:
· House
· Retirements Accounts
· Stock & Mutual Funds
· Life Insurance
· Annuities
· Trust Assets
We will also cover the:
· Distribution options available to spouse and non-spouse beneficiaries of retirement accounts
· Federal Estate Tax Limits
· Biden’s Proposed Changes To The Estate Tax Rules
About Michael……...
Hi, I’m Michael Ruger. I’m the managing partner of Greenbush Financial Group and the creator of the nationally recognized Money Smart Board blog . I created the blog because there are a lot of events in life that require important financial decisions. The goal is to help our readers avoid big financial missteps, discover financial solutions that they were not aware of, and to optimize their financial future.


The Impact of Inflation on Stocks, Bonds, and Cash
The inflation fears are rising in the market and we are releasing this video to help you to better understand how inflation works and the impact that is has on stock, bonds, and cash.

The inflation fears are rising in the market and we are releasing this video to help you to better understand how inflation works and the impact that is has on stock, bonds, and cash. In this video we will go over:
· How inflation works
· Recent inflation trends that are spooking the markets
· Do we have to worry about hyperinflation like in the 80’s
· How stocks perform in inflationary environments
· The risk to bonds in inflationary environments
· How cash melts due to inflation
· The Feds reaction to inflation
· Inflation conspiracy theories that are building momentum
About Michael……...
Hi, I’m Michael Ruger. I’m the managing partner of Greenbush Financial Group and the creator of the nationally recognized Money Smart Board blog . I created the blog because there are a lot of events in life that require important financial decisions. The goal is to help our readers avoid big financial missteps, discover financial solutions that they were not aware of, and to optimize their financial future.


The Top 4 Things That You Need To Know About The Trade War With China
The trade negotiations between the U.S. and China have been the center of the stock market’s attention for the past 6 months. One day it seems like they are close to a deal and then the next day both countries are launching new tariffs against each other. While many investors in the U.S. understand the trade wars from the vantage point of the United
The trade negotiations between the U.S. and China have been the center of the stock market’s attention for the past 6 months. One day it seems like they are close to a deal and then the next day both countries are launching new tariffs against each other. While many investors in the U.S. understand the trade wars from the vantage point of the United States, very few people understand China’s side of the equation. The more we learn about China’s motivation and viewpoint, the more we realize that this could be a very long, ugly, and drawn out battle. The main risk is if this battle is not resolved soon it could lead to a recession in the U.S. sooner than expected.
1: China Is Tired Of Being On The Losing End Of Trade Deals
When you look back through history, going as far back as the mid 1800’s, China has been on the losing end of many of it’s trade deals. To summarize that history, when you are a very poor country, and your economy is based primarily on exporting goods to other countries, those countries that are buying your goods have a lot of power over you. If you don’t agree to their terms, they stop buying from you, and your economy collapses. China’s history is filled with trade deals where terms were dictated to them so they feel like they have been taken advantage of.
Now that China has the fastest growing middle class in the world, they are less reliant on trade to fuel their economy. Also, the size of China’s economy is growing extremely fast. The size of a country’s economy is measured by their GDP (Gross Domestic Product). A country’s annual GDP is the dollar value of all the goods and services that are produced in that country in a single year. It’s fascinating to see how quickly China has grown over the past 20 years compared to the U.S.
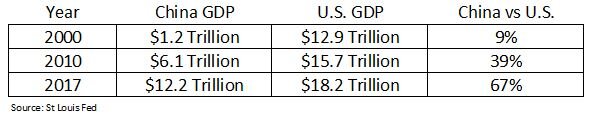
The numbers speak for themselves. In 2000, the size of China’s economy was only 9% of the U.S. economy. In only a 17-year period, China’s economy is now 67% the size of the U.S. economy and based on current GDP data from both countries, they are still growing at a pace that is about three times faster than the U.S. economy.
China seems to be making a statement to the world in these negotiations that terms will no longer be dictated to them. China now has the economic firepower to negotiate terms as an equal which could drag out the trade negotiations longer than investors expect.
2: Tariff Impact On China vs U.S.
In May, the U.S. raised the tariffs on select goods imported from China from 10% to 25%. China then retaliated by raising their tariffs on US imports from 10% to 25%. We have heard in the news that these tariffs hurt China more than they hurt the U.S. In the short term this would seem to be true. The U.S. imports about $500 Billion in goods from China compared to the $100 Billion in goods that China imports from the U.S.
But the next question is, “if it hurts China more, does it hurt them a lot or a little from the standpoint of their overall economy?” The answer; not as much as you would think. The chart below shows China’s total exports as a percentage of their GDP.
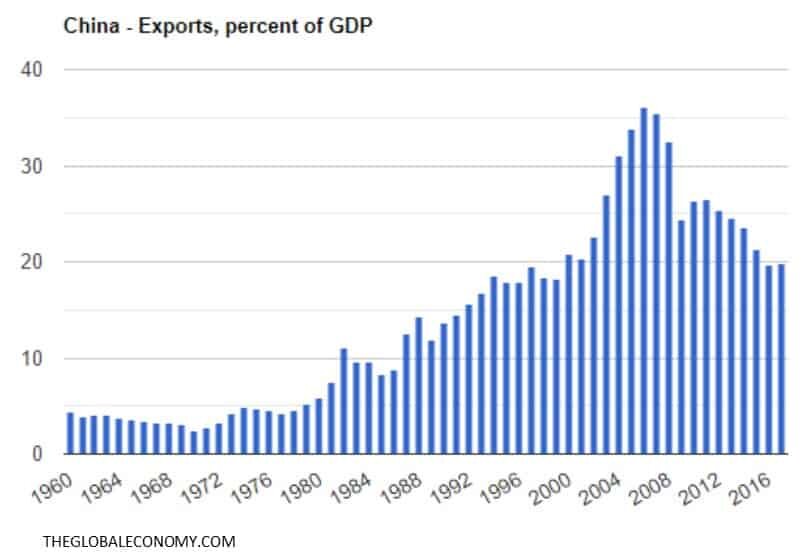
Back in 2007, exports contributed to over 35% of China’s total GDP. As of 2018, exports represent less than 20% of China’s annual GDP. Of their total exports about 18% go to the U.S. So if you do the math, exports to the U.S. equal about 3.6% of China’s total annual GDP. Personally, I was surprised how low that number was. Based on what we have been hearing about the negotiations and how the U.S. is in such a strong position to negotiate, I would have expected the export number to be much larger, but it’s less than 4% of their total GDP. This again may lead investors to conclude that the volatility we are seeing in the markets surrounding the trade negotiations may be an unwelcomed guest that is here to stay for longer than expected.
3: The Impact of Tariffs On The US Economy
While the U.S. is using tariffs as a negotiating tool, it may be the U.S. consumer that ends up paying the price. That washing machine that was $500 in April may end up costing $625 in June. Companies that are importing goods from China and selling them to the U.S. consumer will have to decide whether to absorb the cost of the tariffs which would decrease their net profits or pass those costs onto the consumer in the form of higher prices.
The other problem that you can see in this example is tariffs are inflationary. Meaning they push prices higher. The Fed announced at their last meeting that they were content with keeping interest rates where they are for the remainder of 2019 given the slowing economic growth rate and tame inflation. But if tariffs spark inflation, they may have to reverse course and raise rates unexpectedly to keep the inflation rate under control which would be bad news for the stock market.
4: Global uncertainty
Companies typically do not invest or make plans for growth if the global economy is filled with uncertainty, they pause and wait for the smoke to clear. The longer the trade uncertainty between the U.S. and China persists, the more downward pressure there will be on global economic growth around the world.
Summary
It’s unclear how this situation between the U.S. and China will play out and how long it will be before there is a resolution. In times of uncertainty, investors need to be very aware of how these trends could potentially impact their investment portfolio and it may be the appropriate time to begin building some defensive positions if you have not done so already.
About Michael……...
Hi, I’m Michael Ruger. I’m the managing partner of Greenbush Financial Group and the creator of the nationally recognized Money Smart Board blog . I created the blog because there are a lot of events in life that require important financial decisions. The goal is to help our readers avoid big financial missteps, discover financial solutions that they were not aware of, and to optimize their financial future.

