
The Impact of Inflation on Stocks, Bonds, and Cash
The inflation fears are rising in the market and we are releasing this video to help you to better understand how inflation works and the impact that is has on stock, bonds, and cash.

The inflation fears are rising in the market and we are releasing this video to help you to better understand how inflation works and the impact that is has on stock, bonds, and cash. In this video we will go over:
· How inflation works
· Recent inflation trends that are spooking the markets
· Do we have to worry about hyperinflation like in the 80’s
· How stocks perform in inflationary environments
· The risk to bonds in inflationary environments
· How cash melts due to inflation
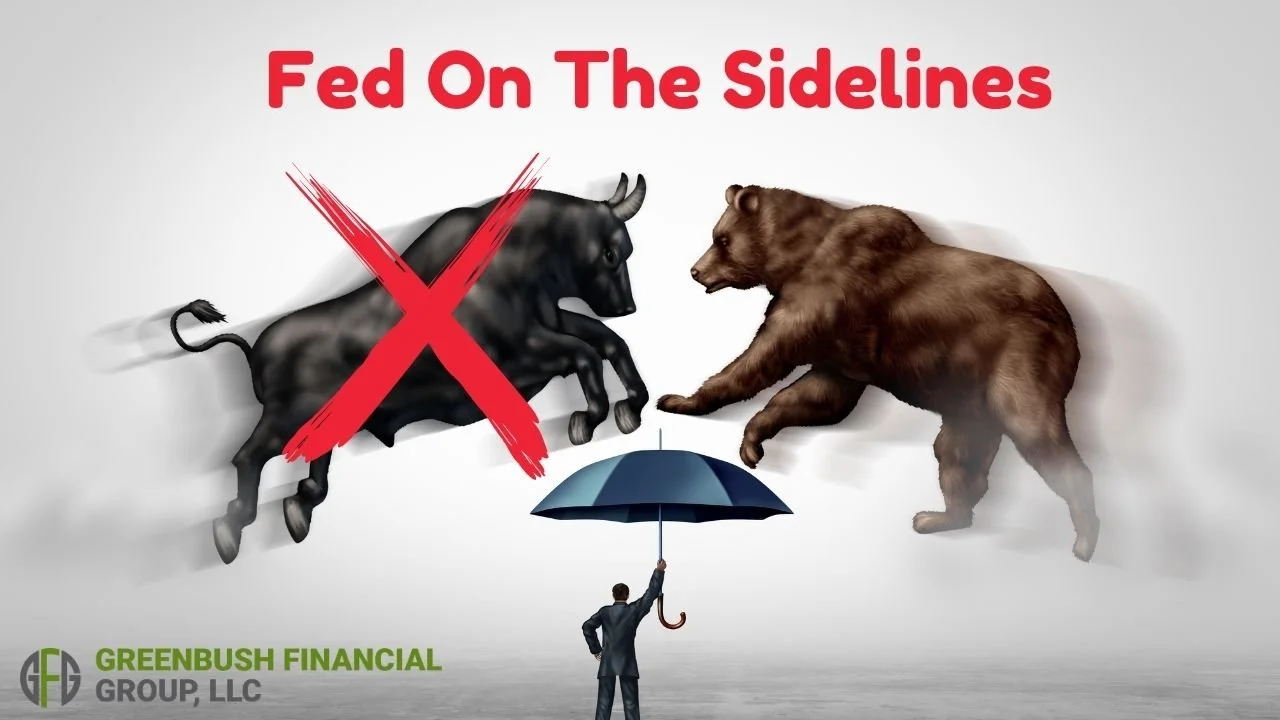
· The Feds reaction to inflation
· Inflation conspiracy theories that are building momentum

About Michael……...
Hi, I’m Michael Ruger. I’m the managing partner of Greenbush Financial Group and the creator of the nationally recognized Money Smart Board blog . I created the blog because there are a lot of events in life that require important financial decisions. The goal is to help our readers avoid big financial missteps, discover financial solutions that they were not aware of, and to optimize their financial future.


The GameStop Surge: 5 Investment Lessons
In this video, we will be explaining what is driving the price surge in GameStop, AMC, and other companies in the markets. More importantly there are 5 very important investment lessons that investors can learn from the recent GameStop anomaly that we will present in the video.
In this video, we will be explaining what is driving the price surge in GameStop, AMC, and other companies in the markets. More importantly there are 5 very important investment lessons that investors can learn from the recent GameStop anomaly that we will present in the video.

About Michael……...
Hi, I’m Michael Ruger. I’m the managing partner of Greenbush Financial Group and the creator of the nationally recognized Money Smart Board blog . I created the blog because there are a lot of events in life that require important financial decisions. The goal is to help our readers avoid big financial missteps, discover financial solutions that they were not aware of, and to optimize their financial future.


The U.S. Government Debt Crisis Is Almost Here
With the massive amount of money that has been printed by the U.S. Government this year, a U.S. government debt crisis is looming. In this video we will walk you through:
With the massive amount of money that has been printed by the U.S. Government this year, a U.S. government debt crisis is looming. In this video we will walk you through:
• Probability that a debt crisis will occur
• When the U.S. Government Debt Crisis could begin
• Should you be making changes to your investment allocation?
• Possible solutions to stave off the debt crisis
• Data that we use to track the government debt trends

About Michael……...
Hi, I’m Michael Ruger. I’m the managing partner of Greenbush Financial Group and the creator of the nationally recognized Money Smart Board blog . I created the blog because there are a lot of events in life that require important financial decisions. The goal is to help our readers avoid big financial missteps, discover financial solutions that they were not aware of, and to optimize their financial future.


How The COVID Second Wave Will Impact The Stock Market
As COVID-19 cases continue to rise in the United States, it has left investors wondering what impact this could have for the stock market in coming months. In this article we are going to review
As COVID-19 cases continue to rise in the United States, it has left investors wondering what impact this could have for the stock market in coming months. In this article we are going to review:
Key Indicators To Track
Impact of A Second Full Shutdown
Chances of A Double Dip Recession
Status of Vaccines And COVID-19 Treatments
Government Stimulus Programs In The Works
Key Indicators To Track
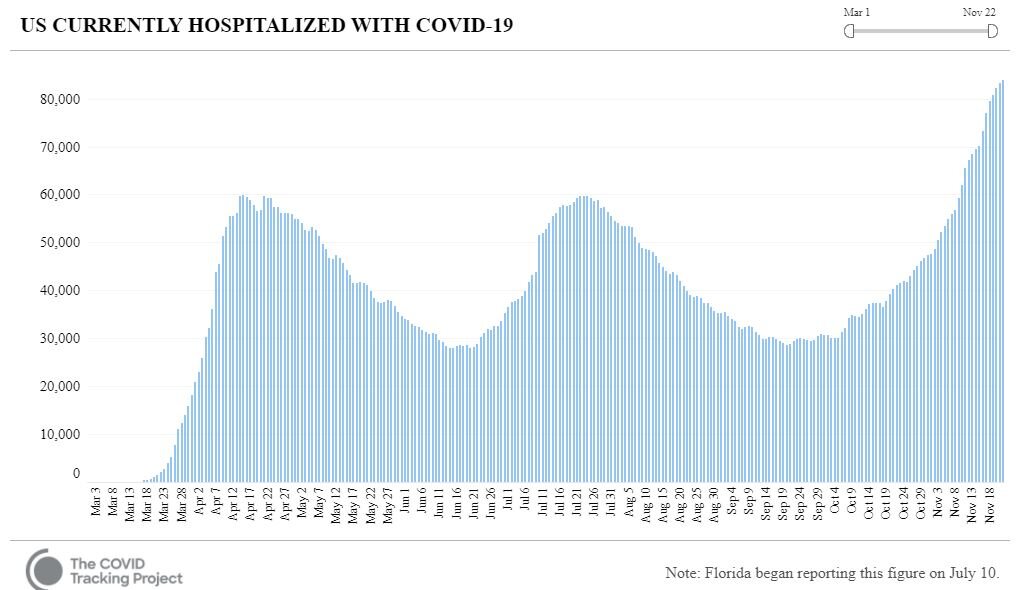
We are not completely dismissing the traditional economic indicators such as unemployment rates, GDP, manufacturer’s index, and consumer spending habits. While we are in uncharted waters with this global pandemic, those indicators still allow us to piece together the US economy‘s timeline to recovery. However, it is hard to deny that COVID-19 tracking data such as daily infection rates will have a material impact on the decisions that investors will make in the coming months. From the experts we have spoken to, while daily infection rates would seem to be the most important, the more important data is the hospitalization rate and the number of people in the ICU.
You could potentially have a lot of people getting infected with COVID-19, but as long as they are able to recover before the virus becomes life-threatening, it would indicate that the COVID-19 treatments are working, and the health system is getting better at treating the virus in the early stages. However, if we see hospitalization rates spiking, and the number of people in the ICU increasing dramatically, that could increase the likelihood of another fall shut down in various states, extending the time to recovery.
The numbers are not great right now. The hospitalization rate is just over 80,000, which is much higher than the previous two peaks from earlier in 2020.
COVID 19 infection rate
If this trend continues, it could put the capacity of the US health system to the test, and it could dramatically increase the number of daily deaths that we are currently seeing from the pandemic.
Government Stimulus Programs
If the current trends continue and the US elected officials determine the best way to reverse the trend is another full shut down of the economy, US citizens and businesses would most likely need support from the government to weather a second shut down. Prior to the presidential elections, Congress was working on a second stimulus package which included another round of checks to be sent to individuals below certain income thresholds, a second round of PPP loans to businesses, state aid, and additional unemployment benefits.
A few quick notes about the stimulus programs. In the preliminary legislation, we did not see any changes to the income threshold to receive the checks from the IRS, but the amounts could potentially be different. This means if you received a check the first time, you will most likely receive a check in the second round. There were several changes made to the criteria of small businesses to receive PPP loan money. Businesses now would have to show a percentage of loss revenue during a specified period to be eligible for the second round of PPP loans. For the unemployment benefits, the primary legislation suggests that it will be a lower bonus amount than the previous $600 per week.
The largest clear and present danger to the market is if the economy goes into a second shut down and Congress is not able to agree upon terms of a second round of stimulus to aid US citizens and businesses. Time will be of the essence, and if Congress waits too long to act, irreversible damage could be done to the US economy, which may prolong the timeline to recovery.
With that said, if Congress is able to provide the economy with the aid it needs to bridge the gap between where we are now to the beginning of the post COVID-19 era, the market could respond very favorably to that environment, even though the news headlines will be ugly in the coming weeks.
The Market Is Forward-Looking
Through all of this, we must remember that the stock market is a forward-looking animal. As we have seen in the past, while the news today may be bad, if the market sees light at the end of the tunnel, it will not necessarily prompt a huge sell off knowing that relief is on the way. As COVID-19 treatments and vaccines continue to gain approval for emergency use, it could provide the market with that reinsurance by mid-2021. The US economy could be on its way to a meaningful recovery, but as I mentioned above, that also assumes that the government will be willing to step in and provide financial support if an economic shutdown takes place in the coming weeks or months.
What does this mean for investors? If you have a long time horizon, it is important to keep your long-term perspective, even though the markets may gyrate in the short term. For conservative investors, it is acknowledging that there are still a lot of variables that have yet to play out over the course of the next few months, and maintaining the appropriate balance between risk and return within their portfolio is key.
Chances of A Double Dip Recession
What are the chances that the market takes another big dive like we saw in March and April of 2020? Based on the information that we have gathered, in my personal opinion, the market could experience a sell off or two before we are on the other side of this pandemic, but I would be surprised if it is of the magnitude that we saw earlier in 2020. The reason for this being, we are most likely towards the end of this pandemic versus the beginning or the middle. During the big sell off at the beginning of 2020, the S&P 500 index dropped by 34%. The market at that point had no way to know what was on the horizon because the virus had just arrived, we were learning about it as it was spreading, and there were no treatments in the works, so the market had no way of forecasting what the timeline could be to recovery. It seems like we are in a much different environment now even though the US Economy faces the threat of a second wave.
A recession is defined as two consecutive quarters of negative GDP growth. If we get a full shutdown of the US economy in the coming weeks or months, it is not off the table that we could have a negative GDP reading for the fourth quarter of 2020 and the first quarter of 2021, technically classifying it as a double dip recession. Only time will tell.
Status of COVID-19 Vaccines And Treatments
It is encouraging that new treatments and vaccines are being approved by the FDA on almost a weekly basis. The challenge becomes the level of production needed, and the distribution of these treatments to the US population. we have to acknowledge that some of these treatments have their own challenges. One of the vaccines that was recently announced has to be stored at a negative 70 degrees Celsius, which is a lot colder then your typical commercial freezer. Special trucks would need to be built to transport it, and special freezers would have to be built and installed to house the vaccine. It also becomes a question of how long the vaccination will last, of if COVID-19 mutates, thus rendering the current vaccines less effective. There are still a lot of question marks even though there seems to be hope around the treatments that are being released now. The positive note is there is both treatments being created for those that have been infected by the virus while at the same time vaccines are being developed to help people from getting the virus in the first place. The stock market will undoubtedly be watching closely to how effective these treatments are at treating the virus, and in turn painting a picture as to the timeline did the economic recovery post COVID-19.

About Michael……...
Hi, I’m Michael Ruger. I’m the managing partner of Greenbush Financial Group and the creator of the nationally recognized Money Smart Board blog . I created the blog because there are a lot of events in life that require important financial decisions. The goal is to help our readers avoid big financial missteps, discover financial solutions that they were not aware of, and to optimize their financial future.

Which Stock Market Index Is Better To Track? The Dow or S&P 500 Index
Today, I’m going explain the difference between the Dow Jones Industrial Average (“The Dow”) and the S&P 500 Index. While both indexes are meant to be an accurate representation of the performance of the US
Today, I’m going explain the difference between the Dow Jones Industrial Average (“The Dow”) and the S&P 500 Index. While both indexes are meant to be an accurate representation of the performance of the US stock market, it’s important to understand the difference between the two.
2024, is a perfect example why. In 2024, the Dow Jones industrial average was up 12% for the year. Meanwhile, the S&P 500 index was up 25% for the year. If both indexes are supposed to be accurate representations of the performance of the stock market, why is one up 12% and the other up 25%?
Special disclosure: I will be mentioning individual companies in this article to help educate you on this topic. These are not recommendations to buy, sell, or hold any of the companies mentioned.
30 companies versus 500 companies
Neither of these indexes are comprised of all of the publicly traded companies in the U.S. stock market. The sponsors of these indexes have hand selected the companies that they have chosen to represent the index. The Dow Index is only made up of 30 companies. The S&P 500 index, as the name suggests, is comprised of 500 companies.
It’s easy for the S&P 500 to win the argument that 500 companies is probably a better representation of the overall stock market versus just the 30 companies that have been hand picked to represent the Dow.
Market sectors
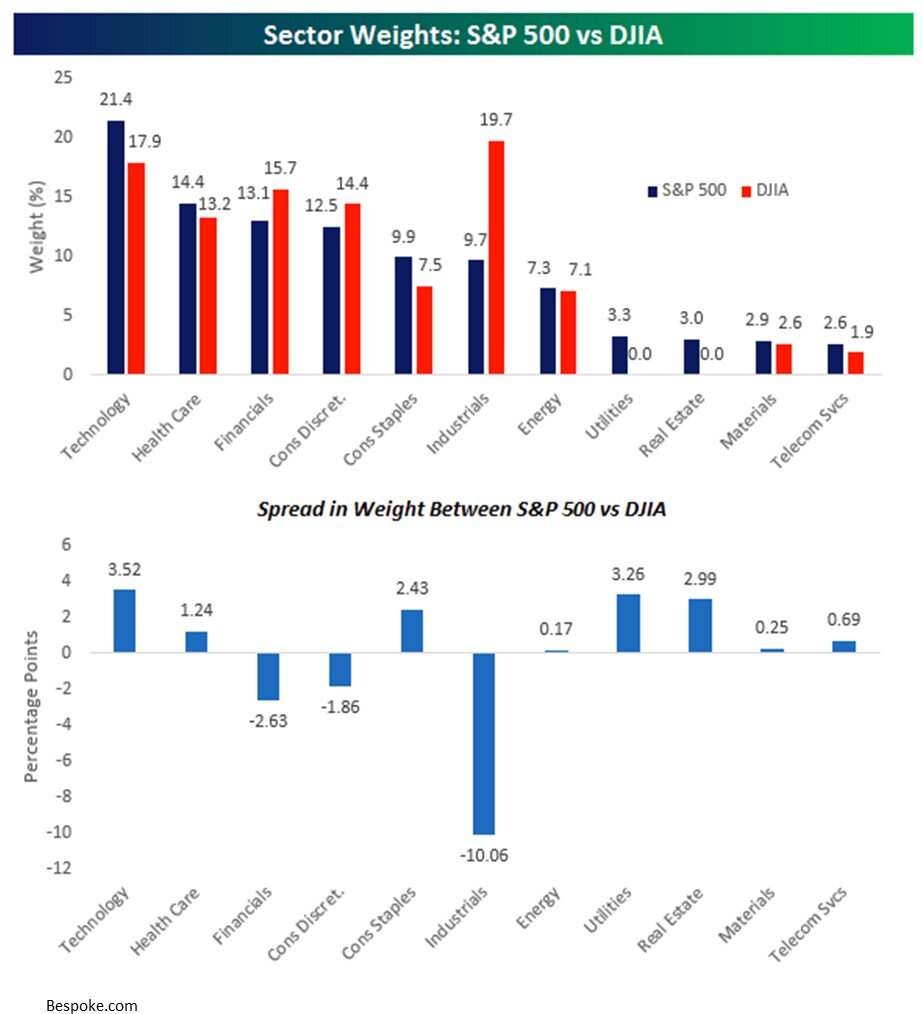
Sector concentration also has a big impact on the performance of these indexes. Stocks are categorized into “sectors” which groups publicly traded companies together by industry. Banks are in the “financial sector”, oil companies are in the “energy sector”, and so on. Since the Dow and the S&P 500 Index have different companies in them, they also have different sector weightings. Below are charts that compare the sector weights in the S&P 500 Index and the DJIA (Dow Jones Industrial Average). The second chart provides a summary of the difference in the sector weightings. 30 companies
difference between S&p and dow
The largest two differences in the sector weightings between the S&P 500 Index and the Dow are Industrials and Technology. The S&P 500 Index has a higher concentration of technology stocks (Examples: Apple, Google, Amazon) and a lower concentration of Industrial Stocks (Examples: Boeing, Caterpillar, 3M). So when tech stocks have a good year, all other things being equal, the return of the S&P 500 Index will most likely be higher than the Dow. This explains some of the deviation in the 2024 return between the S&P 500 Index and the Dow Index because the technology sector was up 36% in 2024 while the industrial sector was up 17%.
Price Weighted vs Market Cap Weighted
This is probably the most important difference between the two indexes.
• The Dow Index is “Price Weighted”
• The S&P 500 Index is “Market Cap Weighted”
Before I jump into the comparison, you first have to understand the pieces that make up these terms.
Stock Price
A company’s stock price is meaningless as a standalone data point. If all you told me was that Company A has a stock price of $25 and Company B has a stock price of $400, I have no idea which company is bigger, which company has performed better, or which company is cheaper to buy. The only thing that stock price tells you is the estimated value of the company divided by the number of shares outstanding.
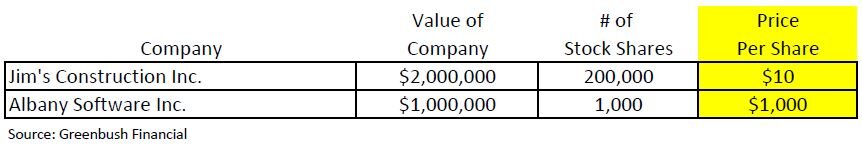
Let me explain this in an example. I have two separate companies: Jim’s Construction Inc. worth $2M and Albany Software Inc worth $1M. Both companies decide to go public. When a company “goes public”, the ownership of the company moves from the handful of individual private owners to whoever owns the shares of the stock being issued. The company that is going public decides how many shares of stock that it wants to issue. In this example let’s say Albany Software only wants to offer 1,000 shares of stock but Jim’s Construction wants to issue 200,000 shares of stock.
dow vs S&p
Dow vs S&P
When these two companies go public, Jim’s Construction will have a stock price of $10 per share and Albany Software will have stock price of $1,000 per share. If I showed a group of amateur investors just the stock price of each company and asked them:
• Which company is bigger?
• Which company is more expensive to buy today?
• Which company would you have liked to own 5 years ago?
Most people would answer Albany Software with a stock price of $1,000 per share. When the truth is Jim’s Construction is actually twice the size of Albany Software, both stocks are priced at their fair market value so one is not necessarily more expensive than the other, and assuming these companies went public 5 years ago, there is no way to know which stock has performed better. Maybe 5 years ago Jim’s Construction was trading at $2 per share resulting in a 400% gain versus Albany Software that was trading at $800 per share 5 years ago, only representing a 25% gain.
Market Cap
A company’s “market cap” is just another way of determining the total value of the company. Market cap is calculated by multiplying the number of shares outstanding by the current stock price. If you wanted to compare the size of Apple vs Meta:
Apple Stock Price $300 × 14.9 Billion Shares = $4.40 Trillion market cap
Meta Stock Price $615 × 2.5 Billion Shares = $1.56 Trillion market cap
Again, even through Apple has a much lower stock price than Meta, the total value of Apple is nearly twice that of Meta.
The Most Important Difference Between S&P & Dow
With that investment lesson under our belts, we are now ready to go full circle back so I can explain why the Dow Index being “Price Weighted” and the S&P 500 Index being “Market Cap Weighted” is so important.
The Dow Jones Index is Price Weighted
Remember the Dow Index is only made up of 30 stocks. When you hear on the news that the Dow Index went up 300 points today or was down 700 points yesterday, the sponsors of the Dow are running a price weighted calculation of the 30 companies within the index. The calculation is simple, it’s just the price per share of each stock divided by a common divisor (historically the number of stocks in the index).
The problem with this calculation, as we discussed above, is that it completely ignores the size or “market cap” of the company. If Apple and Joe’s Construction Inc. both have a share price of $400 per share, should they really be weighted equally in the index? I would argue no, but in the Dow Jones Index they would be weighted equally in index.
The S&P 500 Index is Market Cap Weighted
The S&P 500 Index on the other hand is market cap weighted. The index is made up of the 500 largest U.S. publicly traded companies. Within the index, the larger companies have a bigger impact on performance of the index because each company’s weight in the S&P Index is calculated by taking the market cap of the company divided by the total market cap of all 500 companies in the index.
Since the S&P 500 Index has a larger number of companies and ranks the companies by size within the index, I would argue that the S&P 500 Index is the more appropriate index to track for purposes of determining the true performance of the U.S. stock market.
Tips for Tracking The Indexes
The media likes to report on the Dow because the price movement numbers are bigger and it grabs attention. If both the Dow and the S&P 500 drop by 2% in a single day, that equates to an 846 point drop in the Dow and a 120 point drop in the S&P 500 Index. What grabs more attention?
“Market drops by 846 points!!” or “Market drops by 120 points”
But it’s not uncommon, for all of the reasons that we discussed, for the day-to-day performance of the Dow and S&P 500 Index to be different. One or two companies can have a large impact on the Dow Index and push it up or down for the day which is less likely within the S&P 500 Index because there are 500 companies within the index all moving in their various directions.
I also encourage you to track “percentages” and not “point” movements. The Dow falling by 500 points sounds horrible but you have to remember that the Dow index is currently at 49,600, so a 500 point move only represents a 1% change. Back in 2010, when the Dow Index was at 10,000, a 500 point drop was more meaningful because it represented a 5% drop in the index. Just something to keep in mind with both the Dow and the S&P 500 Index at these higher levels.
Remember: Track the S&P 500 Index not the Dow and measure the daily movements in percentages not points. 30 stocks

Michael Ruger
About Michael……...
Hi, I’m Michael Ruger. I’m the managing partner of Greenbush Financial Group and the creator of the nationally recognized Money Smart Board blog . I created the blog because there are a lot of events in life that require important financial decisions. The goal is to help our readers avoid big financial missteps, discover financial solutions that they were not aware of, and to optimize their financial future.

Last updated June, 2026

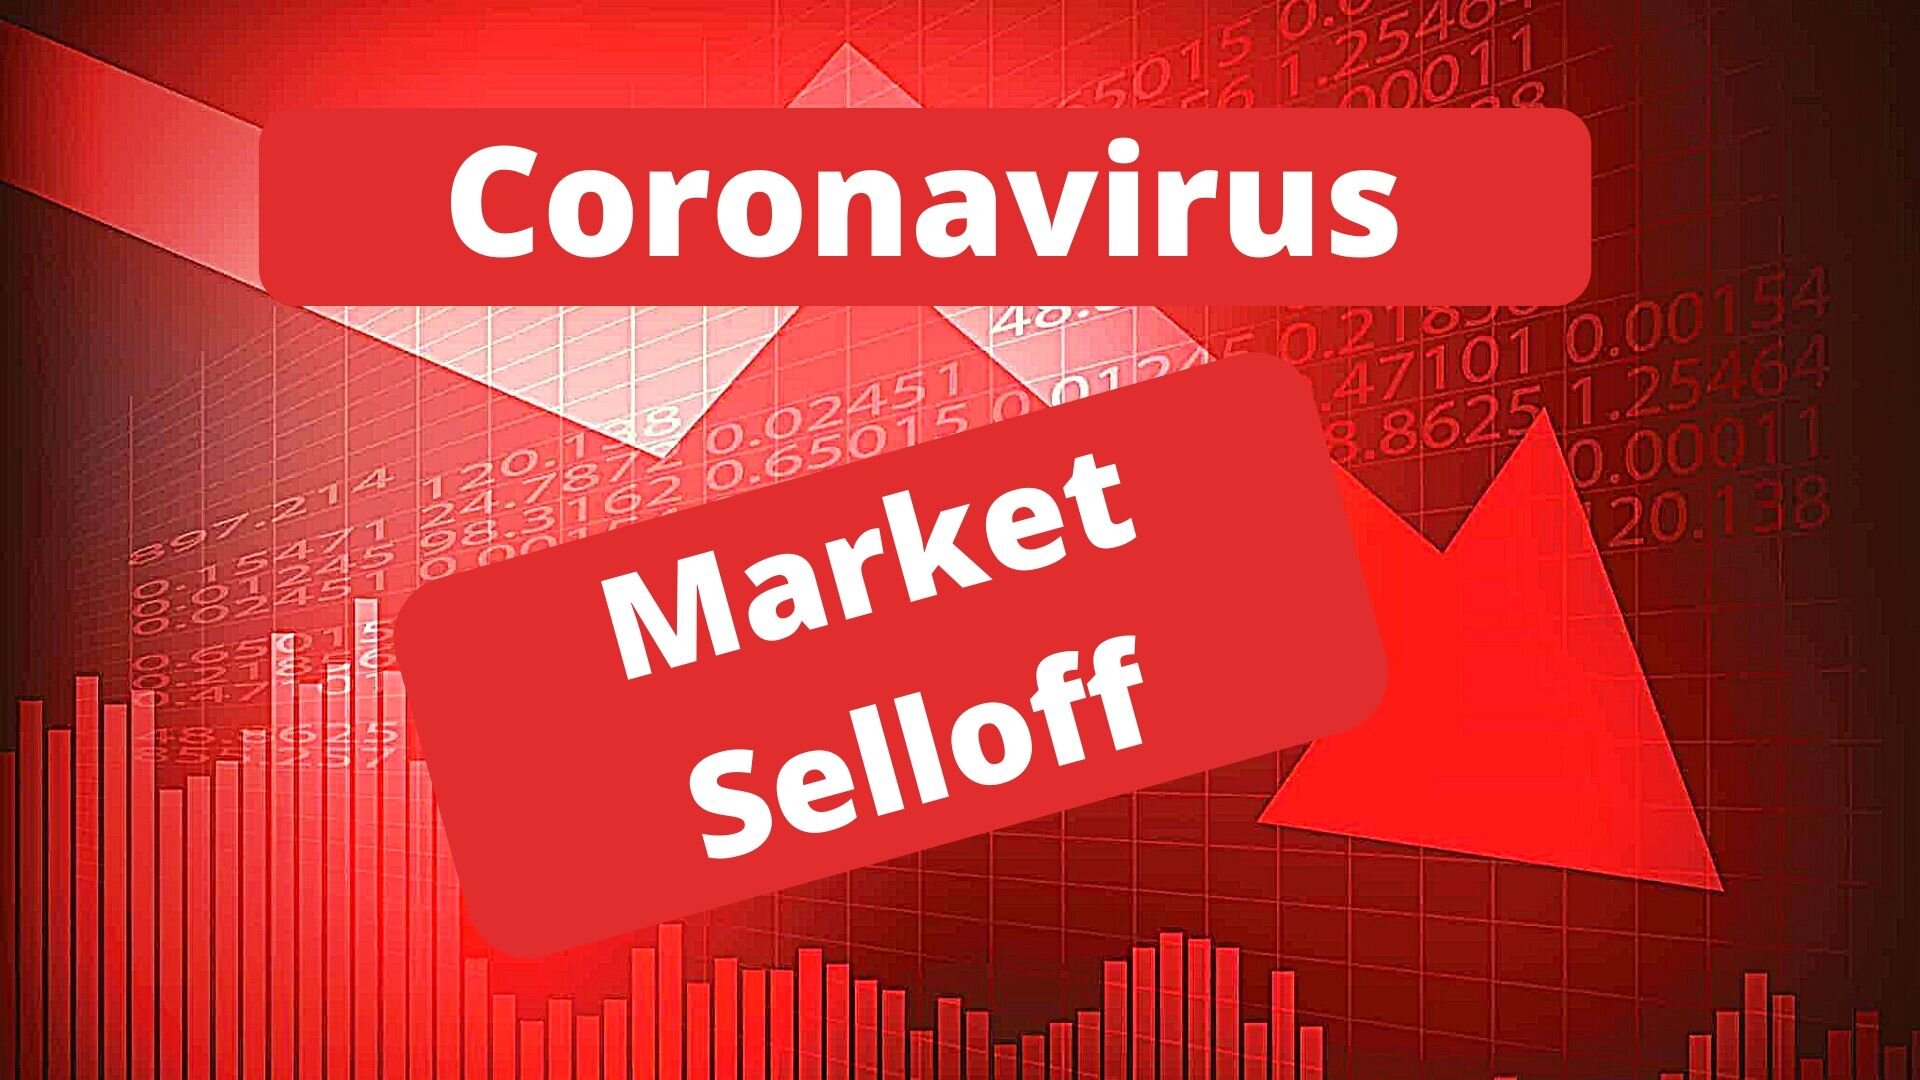
Market Selloff: Time To Buy, Sell, or Hold?
Over the past month, the stock market has dropped by 20%. Largely due to the economic impact of the Coronavirus. As the feeling of panic continues to increase here in the U.S., our clients are asking:

Coronavirus Selloff
Over the past month, the stock market has dropped by 20%. Largely due to the economic impact of the Coronavirus. As the feeling of panic continues to increase here in the U.S., our clients are asking:
Should we be buying stocks at these lower levels?
Is it going to get worse before it gets better?
How quickly do you think the market will bounce back after the virus is contained?
Having managed money for clients through the Tech Bubble, The Great Recession of 2008/2009, and countless market selloffs, while the circumstances are always different from crisis to crisis, there are patterns that seem to be consistent within each market selloff. Being able to identify those patterns is key in determining what the next move should be within your investment portfolio and I’m going to share those with you today.
DISCLOSURE: Throughout this article I will be using examples of industries and companies. These are not recommendations to buy or sell a particular stock. Please consult your investment professional for advice.
Is The Market Oversold?
When there is a market selloff, one of the key questions we’re trying to answer is: “Has the stock market overreacted to the risks that are being presented?” In answering this question, I think the key thing that investors forget is that a company’s stock price represents more than just one year of its earnings. When investors buy a stock it’s typically because they expect that company to grow over the course of multiple years and yield a generous return. Unexpected events like the Coronavirus without question impact those projections but it’s not uncommon for the market to overreact because it’s focused on what’s going to happen to that company’s revenue in the short term.
A good example of this are the airlines in the United States. Due to the Coronavirus companies have canceled conferences, people have canceled vacations, and sporting events have been postponed or are now being played without spectators. That is a direct hit to the airlines in the U.S. because prior to the Coronavirus they had projected a specific amount of revenue to be generated during 2020 based on all that activity. But here comes the key question. Many of the airline stocks in the U.S. have dropped by more than 50% in the past 60 days. If investors believe that the Coronavirus will eventually be contained in the coming months, are those airlines really only worth half of what they were 60 days ago?
Buffett’s Words of Wisdom
I hesitate to use Warren Buffett’s famous quote because it’s used with such frequency but it’s proven to be a valuable investment practice during times of uncertainty: “Be fearful when others are greedy and greedy when others are fearful.” While it’s easy to say, it’s very difficult to execute effectively. Buying low and selling high goes against every human emotion. It often means stepping into the most unloved names, at what would seem to be the worst time, and owning that decision. Right now those investments seem to be the airlines, hotels, cruiselines, oil companies, and other industries directly tied to travel and tourism.
This same concept also applies to the decision to “hold” or not sell your equity holdings when the market is in a panic. Even though no one likes to see their investment accounts lose value, if you were positioned appropriately prior to the start the Coronavirus pandemic, in my professional opinion, you should not be making any adjustments to your portfolio given the recent market events. If however, you were allocated too aggressively based on your own personal risk tolerance or time horizon, you have a much more difficult decision to make.
Short Term vs Long Term Risks
Market selloffs are typically triggered by two types of risks: short term risks and long term risks. Being able to identify which risk the market is facing should greatly influence the decisions that you are making within your investment portfolio.
I’m going to use the airlines again as an example. In my personal option, the Coronavirus represents a short-term risk to the airline industry. In an effort to contain the virus, conferences have been cancelled, companies have told their employees not to travel, people have canceled vacations, etc. But you have to ask yourself this question: “what’s likely to happen once the virus is contained?” Conferences may be rescheduled, business travel resumes, and people map out a new plan for their vacation. There is arguably pent up demand being created right now that the airlines will benefit from once the virus is contained.
Back when 9/11 happened, I viewed that risk as a longer term risk for the airlines because people could choose to permanently change their behavior and choose not to fly for a very long time based on that event. In the 2008 financial crisis, the banks had a long road ahead of them as they executed plans to dig out of their leveraged positions. Problems of this nature usually require more time to fix which is why these longer term risks can justify a move from stocks into bonds.
Winners and Losers
Even with short term risk diversification is key. Just because a risk is a short term risk does not necessarily mean all companies are going to survive it. There is a risk to all companies that are impacted by market events that they run out of cash before the tide turns back to the upside. If you are an investor looking to buy into airlines at these lower levels, it's typically prudent to buy multiple companies in smaller increments, as opposed to establishing a large position in a single airline. Again, just an example, if you decide to buy stock in American Airlines, Delta, Southwest, and United Airlines, the risk of buying low is one of the four may run out of money before the virus is contained and they are forced with filing bankruptcy without a bailout from the government. If you put all of your money into one airline, you are taking on a lot more risk.
Buyer’s Remorse
One of the lessons I’ve learned from buying during a market selloff is you need to keep your long-term perspective. Meaning when you purchase a stock that has dropped significantly, there are forces acting on that company that could cause it to drop by more. You have to be comfortable with that reality and you have to possess the time horizon to weather the storm in the likely case that it could get worse before it gets better.
It’s all too common that investors purchase a stock thinking that since it’s already dropped 30%+ that it can’t possibly go any lower, only to watch it drop by another 30% and then feel pressured to sell it thinking they made a mistake. I call this “buyer’s remorse”. When you play the role of an opportunistic investor, it may take months or years for the benefit to be realized. Investing for a “quick pop” is a fool’s game, especially with the Coronavirus situation. No one knows how long it’s going to take to contain the virus, how badly Q1 and Q2 revenue will be hurt for companies, or will it end up causing a recession. Making the decision to buy stock at lower levels is usually based on the investment thesis that the stock market is overreacting to a relatively short term event and those companies getting hit the hardest will recover over time.
How Much Time Will It Take For the Market To Recover?
No one knows the answer to this question because we have never really been in this situation before. We have been through other epidemics in the past such as SARS, MERS, Swine Flu, and Ebola, but nothing that spread as quickly or as broadly around the globe as the Coronavirus. Since China was ground zero for the virus, the good news is we are already seeing significant progress being made at containing the virus.
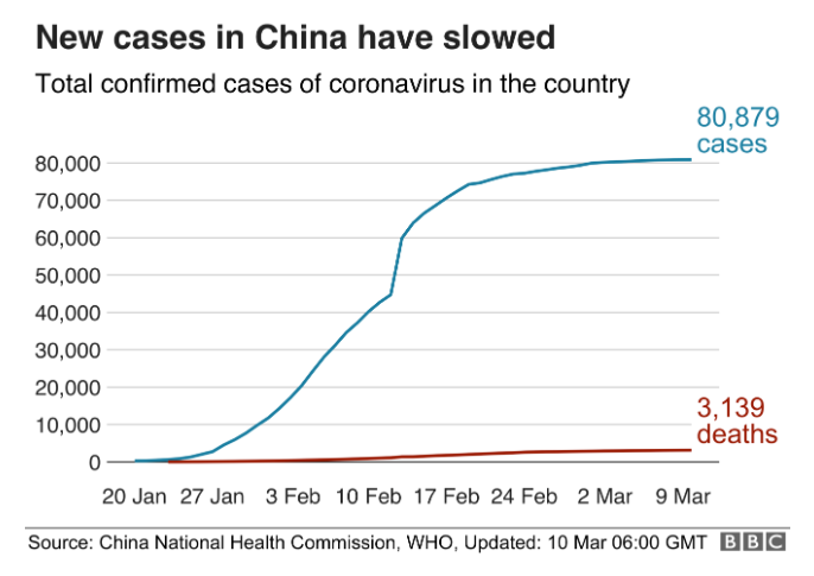
As you can see via the blue line in the chart, at the beginning of February China was reporting thousands of new cases every day, but since the beginning of March the line flattens out, meaning the number new people getting infected is tapering off. If the United States follows a similar trajectory, we may see the rate of infection rise significantly in the upcoming days only to see the numbers taper off a month or two from now.
I would argue that we have an added advantage over China and Europe in that we had more time to prepare, we know more about the spread of the virus, and how to contain it. I think the lesson that we learned from Europe was you have to be aggressive in your containment efforts which is why you are seeing the extreme measures that the U.S. is taking to contain the spread of the virus. Those extreme containment efforts hurt the market more in the short term but will hopefully result in less damage to the economy over the longer term.
It’s really a race against time. The longer it takes to contain the virus, the longer it takes for people to get back to work, the longer it takes for people to feel safe traveling again, which results in more companies being put at risk of running out of capital waiting for the recovery to arrive. This is the reason why the Fed is aggressively dropping interest rates right now. Dropping interest rates does absolutely nothing to contain the virus or make people feel safe about traveling but it provides companies that are struggling due to the loss of revenue with access to low interest rate debt to bridge the gap.
A Recession Is Very Possible
A recession is defined as two consecutive quarters of negative GDP growth. With the global slowdown that has taken place in 2020, the U.S. economy may post a negative GDP number for the first quarter. Since it takes a while to bring global supply chains back online and for consumers to return to their normal spending behaviors, it's possible that the U.S. economy could also post a negative GDP number for the second quarter as well. By definition, that puts the U.S. economy in a recession. But it may end up being a very brief recession as the Coronavirus reaches containment, global supply chains come back online, pent up demand for goods and services is fulfilled, and U.S. households and businesses have the dual benefit of having access to lower oil prices and lower interest rates.
Michael Ruger
About Michael……...
Hi, I’m Michael Ruger. I’m the managing partner of Greenbush Financial Group and the creator of the nationally recognized Money Smart Board blog . I created the blog because there are a lot of events in life that require important financial decisions. The goal is to help our readers avoid big financial missteps, discover financial solutions that they were not aware of, and to optimize their financial future.


Coronavirus vs. SARS: Buying Opportunity?
As fears of the Coronavirus continue to spread, this week was the largest drop in the stock market since the 2008 / 2009 financial crisis. On Thursday, February 27, 2020, the Dow Jones Index dropped by 1,191 points, making it the
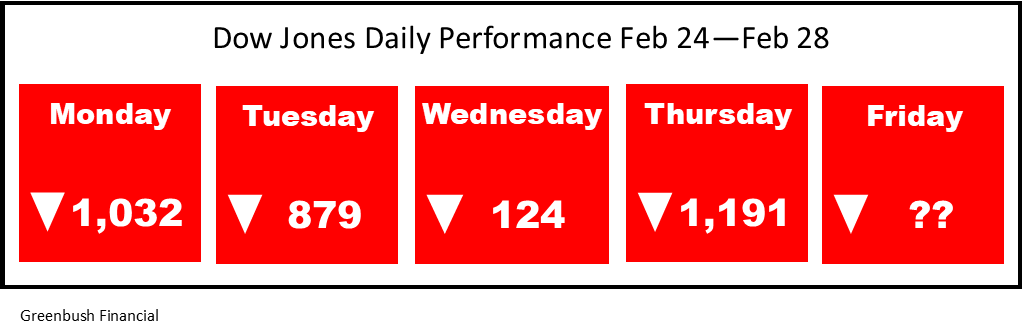
As fears of the Coronavirus continue to spread, this week was the largest drop in the stock market since the 2008 / 2009 financial crisis. On Thursday, February 27, 2020, the Dow Jones Index dropped by 1,191 points, making it the largest single day point drop in the history of the index. As the selling has intensified into the week, clients are asking us what we expect in the upcoming weeks. Should they be buying the dip? Do we expect a further selloff from here?
Like most major market events, we have to look back in history to find similar events that allow us to model how the markets might behave from here. This week, we have conducted extensive research into virus outbreaks that have happened in the past such as SARS, MERS, Zika, and Swine Flu, in an effort to better understand possible outcomes to the Coronavirus epidemic. In this article, I’m going to share with you:
Coronavirus vs SARS / Zika / other epidemics
What makes the Coronavirus different than other epidemics in the past
Why has this selloff been so fast & fierce
Disruptions to the global supply chain
Performance of the stock market following the end of epidemics in the past
Will the Fed lower rates to help the market
When does this become a buying opportunity for investors
Coronavirus vs SARS
We spent an extensive amount of time comparing Coronvavirus to SARS, and other epidemics in the past. Without a doubt, the Coronavirus is very different than many of the epidemics that we have seen in the past which is making financial modeling very difficult. When we compare the Coronavirus to SARS and other outbreaks, the rate at which the Coronavirus has spread in the first 30 days is unprecedented. Here are a few time lapse charts that compares the infection rate of the Coronavirus to SARS, Ebola, MERS, and Swine Flu.
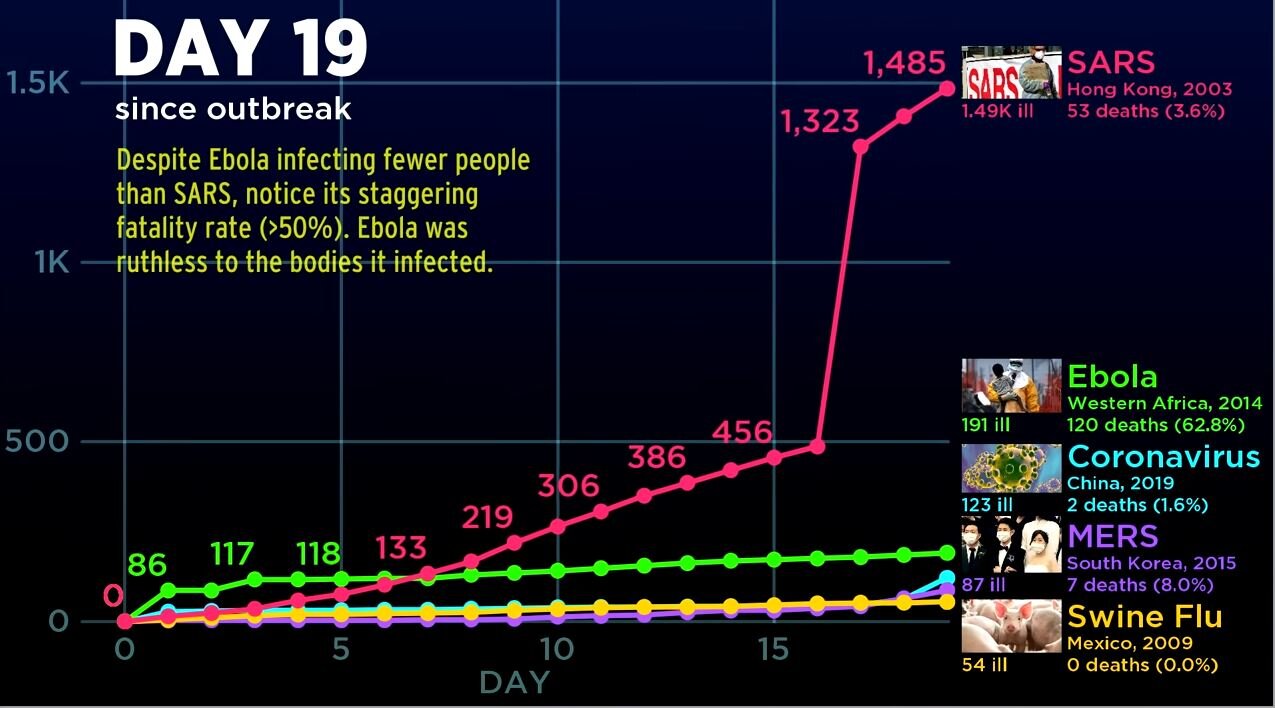
When you compare SARS to the Coronavirus at Day 19, SARS was much worse out of the gates. By Day 19, SARS had infected 1,490 people and 53 people had died, making the death rate 3.6%. By comparison, at Day 19, Coronavirus had only infected 123 people in China, and resulted in 2 deaths. Making the death rate 1.6%.
However, only 7 days later, at Day 26, the story completely changed:
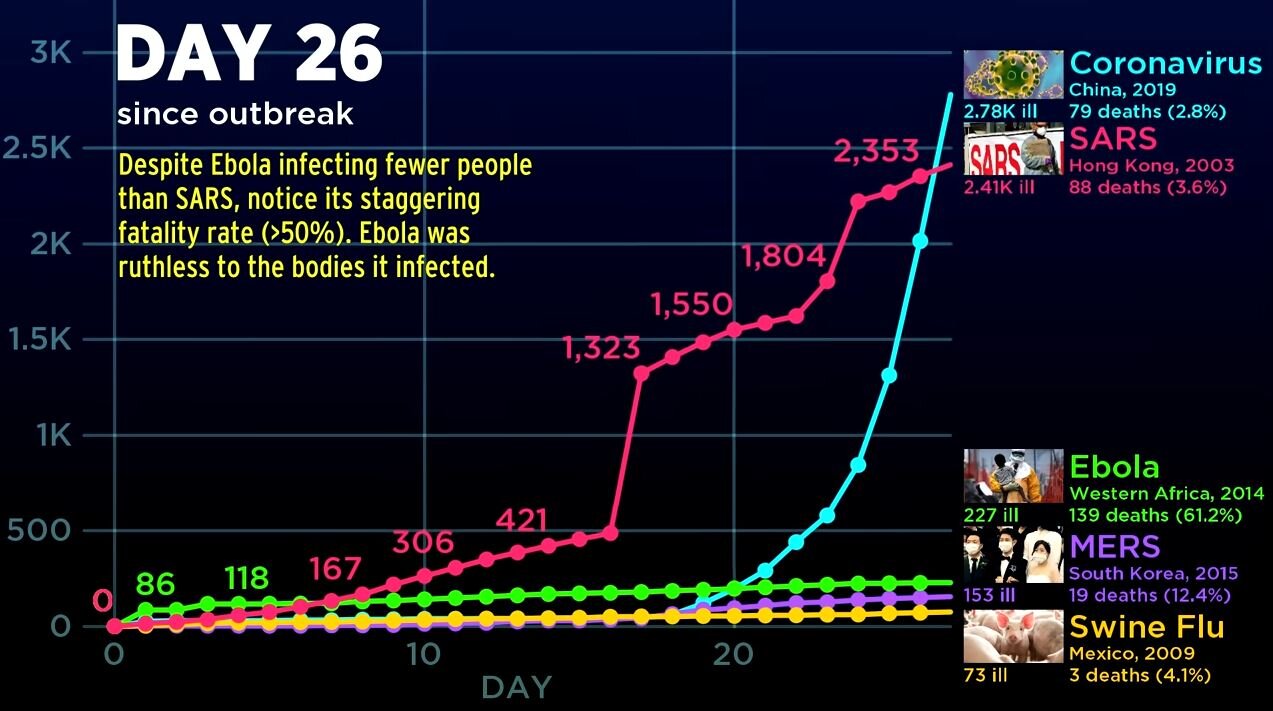
By Day 26, the number of confirmed cases of Coronavirus rocketed higher, outpacing that of SARS in the early 2000’s. In addition, the death toll for the Coronavirus jumped to 79 people.
But then it continued to get worse. By Day 43, the chart says it all:
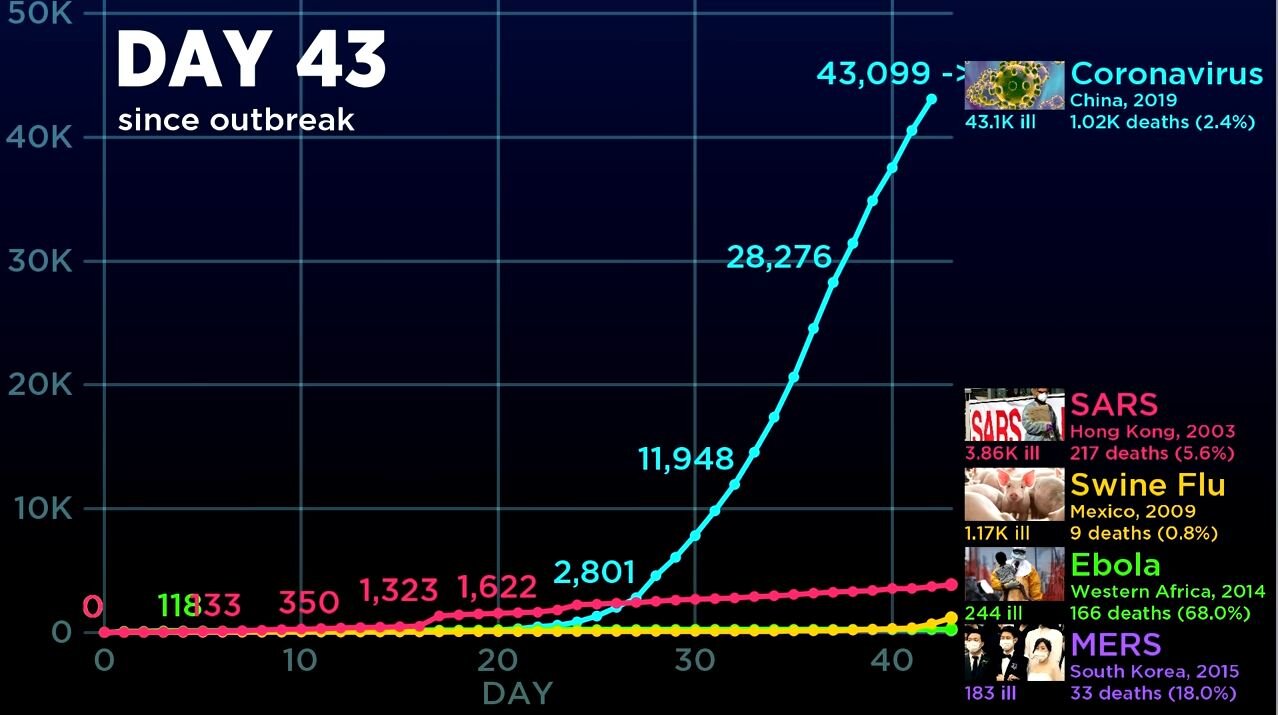
By day 43, the number of confirmed cases of the Coronavirus jumped to 43,099 compared to just 3,860 confirmed cases of the SARS virus during that same time period. The death toll for the Coronavirus had risen to over 1,000 people compared to 217 from SARS during that same time period. This chart highlights the main issue with the Coronavirus. It’s spreading faster than government’s are able to control compared to most epidemics in the past.
Now, I say “most” because when we started gathering the data, there is a chart that looks similar to the Coronravirus outbreak. If I move these charts forward to Day 122, this is what happened with the Swine Flu in Mexico in 2009.
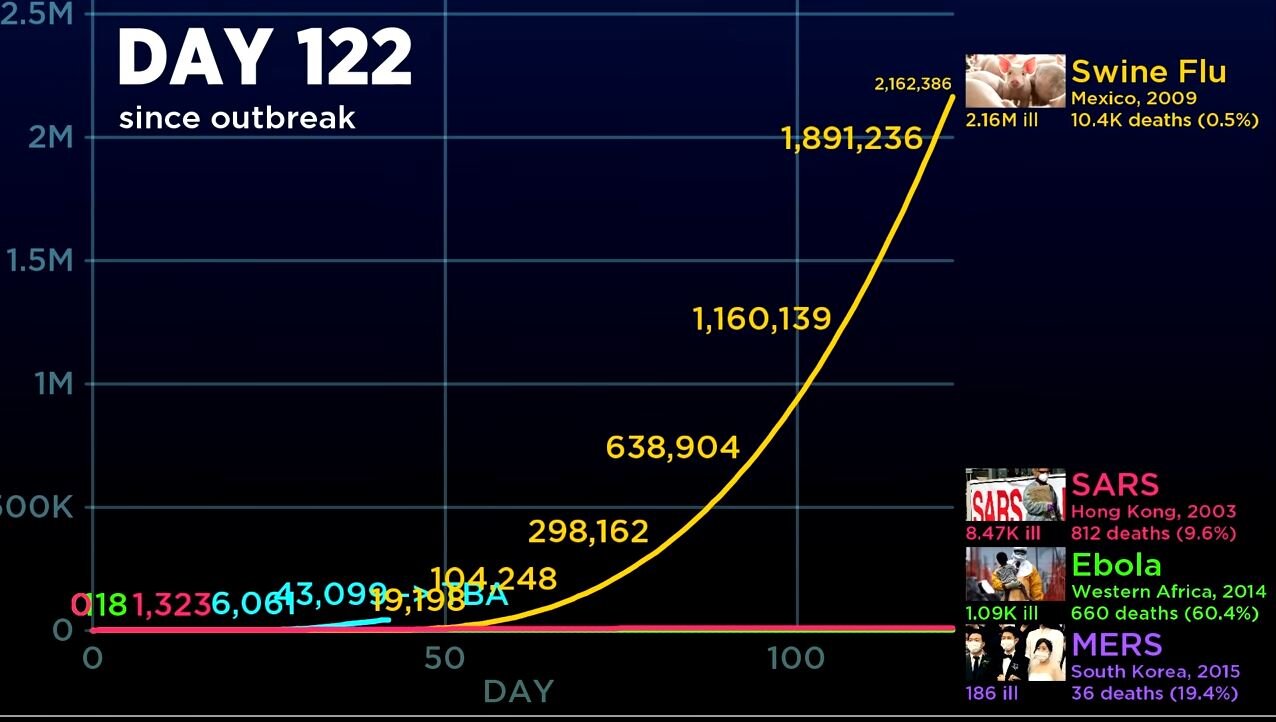
The Swine Flu was relatively mute for the first 50 days, but after day 50, the chart looks very similar to the fast spread of the Coronavirus. By Day 122, 2.1M people had been infected with the Swine Flu and over 10,000 people had died.
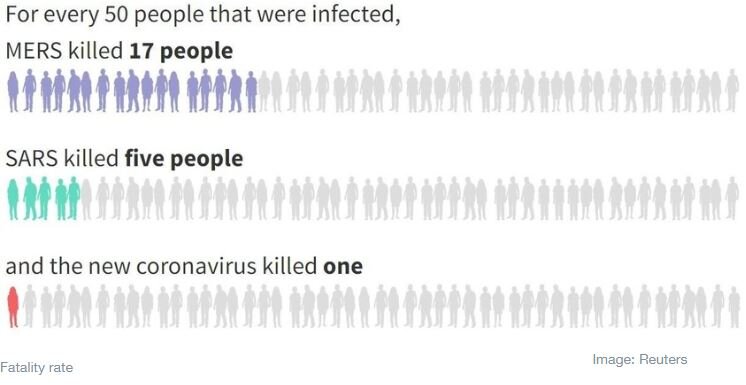
So why didn’t you hear more about the Swine flu when it was happening? The death rate of the Swing Flu was only 0.5%. Compare this to the current 2.1% estimated death rate of the Coronavirus, which is not as high as the SARS death rate of 4.9%, but it is significantly higher than the Swine Flu. Here is a chart comparing the death rate of SARS, Coronavirus, and MERS:
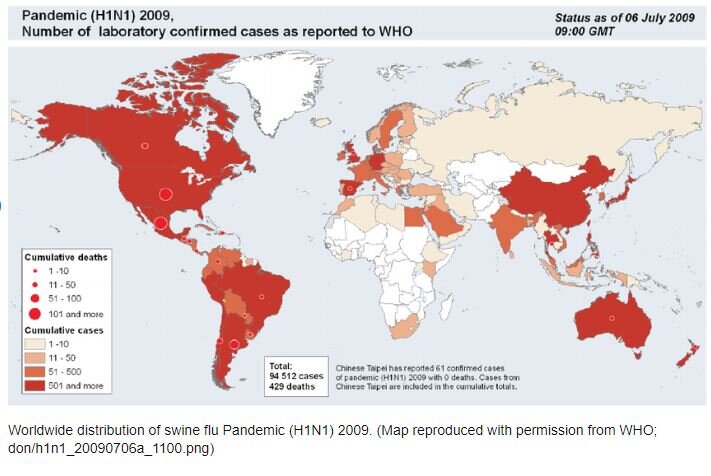
Another important note, the Swine Flu was fairly wide spread as well. See the chart below from the World Health Organization on the Swine Flu:
However, given how fast the Coronavirus is spreading in it’s early stage, it could end up having a larger global footprint than the Swine Flu if they are unable to contain it soon.
Key Takeaway From The Comparison
Our key takeaway from this comparison is that Coronavirus has spread more quickly in the early stages compared to past epidemics which represents a larger risk to the markets than in the past. Due to the pace of the spread, it’s difficult to put an estimated timeline together for containment. When we look at the comparison of Coronavirus to the Swine Flu, it shows that there could be further downside risks to the markets if the spread of the virus follows a similar glide path.
Coronavirus Disruption To The Market
We issued an article earlier this week explaining the business impact of the Coronavirus.
Article: Coronavirus & The Market Selloff
I just want to quickly summarize again what’s causing the market selloff from a business standpoint. As the Coronavirus continues to spread to other regions, it forces governments to restrict the movements of its people in an effort to contain the spread of the virus. This means transportation is shut down, events are canceled where there would have been large gatherings of people, and employees are not going to work. Also, when people are afraid, they don’t go out to eat, and they don’t go shopping. All of these things have a direct impact on the revenue of the companies that make up the stock market. When these companies entered 2020, there was no expectation that their manufacturing operations could be completely shut down due to a global health epidemic. The stock market right now is trying to determine how much it needs to discount the prices of these companies based on the revenue that’s being lost.
The longer the epidemic continues, the longer it takes people to get back to work, the longer it takes people to resume their normal spending habits, and the more damage it does to the markets.
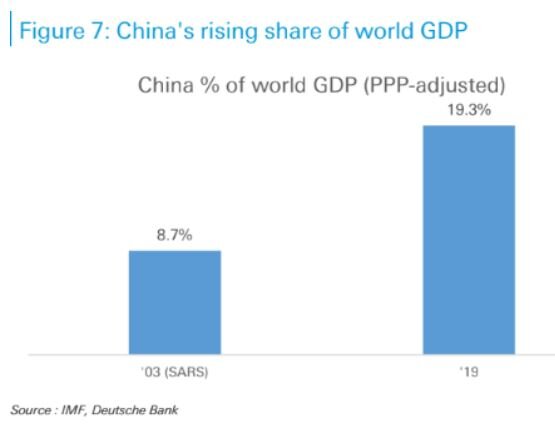
The China Impact
When comparing SARS to the Coronavirus it’s also important to acknowledge the growth in the size of China’s economy between 2003 and 2020. When the SARS outbreak happened in 2003, China’s economy only represented 8.7% of global GDP. As of 2019, China’s economy now equals 19% of total global GDP. Since the Coronavirus has been the most wide spread in China, It will have a much larger impact on the markets around the globe compared to the SARS outbreak when China was a much smaller player in the global economy.
Valuations in the U.S. Stock Market
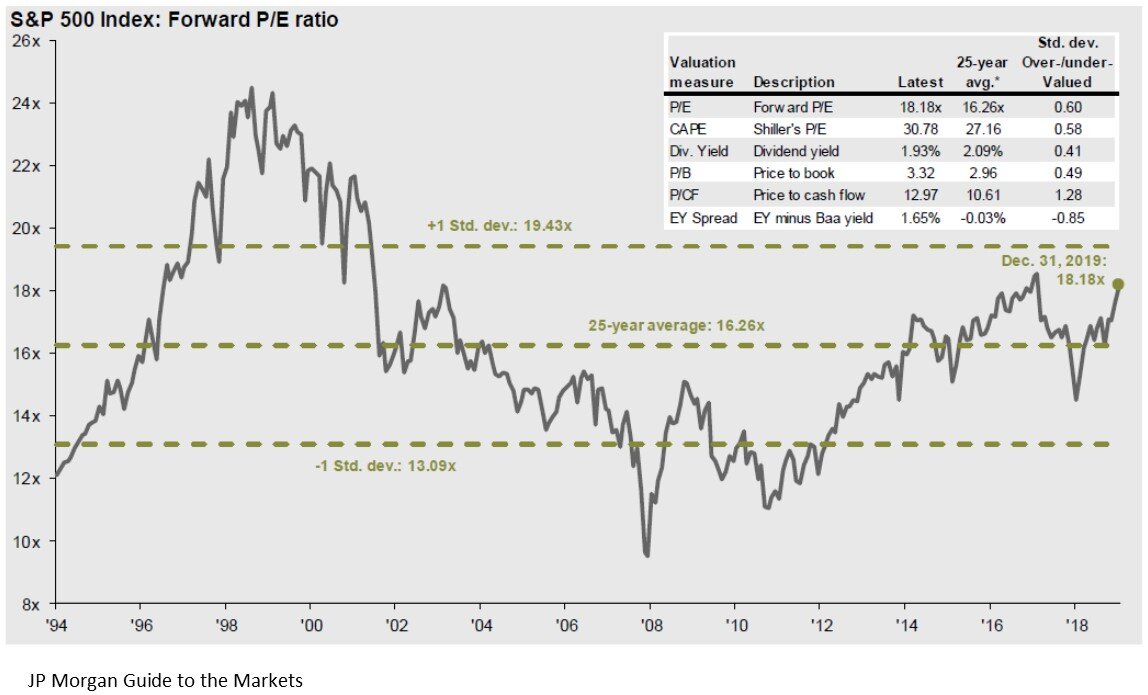
In our opinion, one of the other big factors that has fueled the magnitude of the selloff here in the U.S., is the simple fact that going into 2020, the stock market was overvalued already by historic terms. As of December 31, 2019, the P/E ratio of the S&P 500 was 18. The 25 year historical average P/E for the S&P 500 Index is 16. This essentially means that stocks were expensive going into the beginning of the year. When stocks are already arguably overvalued, and a negative event happens, the prices have to drop by more realizing that those companies are not going to produce the earnings growth for the upcoming year that was already baked into the stock price.
Fed Lowering Rates
There is talk now of the Fed coming to the markets aid and lowering interest rates throughout the year. Going into 2020, it was the market’s expectation that the Fed was going to remain on hold for 2020. In my opinion, the rate cuts are probably warranted at this point, given the unexpected slowdown to the global economy as a result of the Coronavirus. But I would also warn that the Fed lowering interest rates is not in itself going to heal the markets. Giving companies access to cheaper capital is not going to make people feel safer about traveling around the globe and it’s not going to help manufacturers resume operations if their employees can’t get to the factory due to travel restrictions.
However, giving companies access to cheaper capital will allow them to better weather the storm while the governments around the world work on a containment plan. Without that access to cheap capital, you could see companies going under because it took revenue too long to ramp back up.
Global Supply Chain
Investors should not underestimate the damage that has been done to the global supply change and how long it takes to get the supply chain back up and running again. A good example are car manufacturers. They do not typically keep large inventories of parts, and if those parts are not being made, they’re not being shipped, meaning they can’t build the cars, so they can’t sell the cars, and revenue drops.
Within the electronics industry, a lot of the products are made up of hundreds if not thousands of components, and the product does not work without all of those components. If there is one computer chip that is made in Korea, and the manufacturing of those chips has been halted, then the end product cannot be built and shipped. The examples go on and on but when you think of manufacturing around the globe being brought offline, it’s not like a light switch where you can go and simply turn it back on. It takes a while for it to get back up and running again. So while investors might think the Coronavirus could just impact Q1 revenue, it’s more likely that it will impact revenue beyond just the first quarter.
When Do You Buy The Dip?
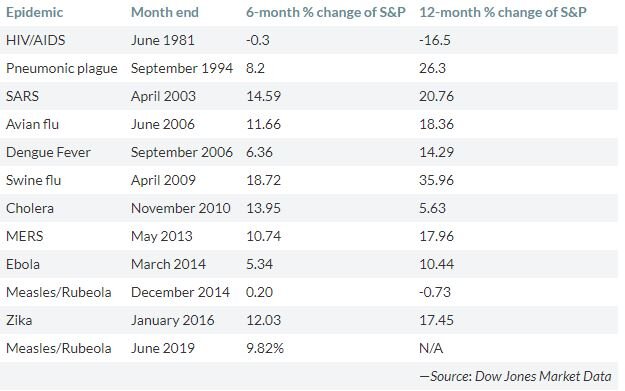
I have received a lot of calls from clients asking if they should begin buying stocks at these lower levels with the anticipation of a bounce back. When we look at other epidemics in the past, there has been a sizable rally in the stock market 6 to 12 months after the epidemic has ended. The chart below shows each epidemic and the subsequent 6 month and 12 month return of the S&P 500 after the epidemic ended. On average, the stock market rose 20% a year following the end of the epidemic which is why investors are eager to buy into the selloff.
In my personal opinion, at some point, the Coronavirus will be contained and it will create an opportunity for investors. There is pent up demand being accumulated now that will need to be filled after the virus is contained. Individuals will most likely reschedule vacations and travel plans once they feel it’s safe to travel around the globe, and the Fed, via lower rates, will have given companies access to even cheaper capital to grow. But as I write this article on February 28th, I caution investors. When you look at the data that we’ve collected, there could definitely be more downside to the selloff if they are unable to contain the spread of the Coronavirus within the next few weeks. The market right now is just trying to guess how much damage has been done with no real solid guidance as to whether it’s guessing right or wrong.
It may be prudent to wait for evidence that progress is being made on the containment efforts of the virus before buying back into the market. For long term investors, it’s important to understand that while the Coronavirus will undoubtedly have an impact on the revenue of companies in 2020, in the past, epidemics have rarely changed the fate of solid companies over the long term.
Michael Ruger
About Michael……...
Hi, I’m Michael Ruger. I’m the managing partner of Greenbush Financial Group and the creator of the nationally recognized Money Smart Board blog . I created the blog because there are a lot of events in life that require important financial decisions. The goal is to help our readers avoid big financial missteps, discover financial solutions that they were not aware of, and to optimize their financial future.


Coronavirus & The Market Selloff
Today was a wild ride for the stock market. The Dow Jones posted a loss of 1,031 points on February 24, 2020 as fears of the continued spread of the Coronavirus sparked a selloff in the stock market. Over the past 24 hours, we've
Today was a wild ride for the stock market. The Dow Jones posted a loss of 1,031 points on February 24, 2020 as fears of the continued spread of the Coronavirus sparked a selloff in the stock market. Over the past 24 hours, we've received the following questions from clients that I want to address in this article:
Why is the market selling off on this news?
Do you think the selloff will continue?
Should you be moving money out of stocks into bonds?
Why Is Market Selling Off On This News?
You have to remember that the stock market is made up of individual companies. Each company’s stock price is just an educated guess by investors as to how much those companies are going to make in profits over the next 3 months, 1 year, 5 years, and beyond. Unexpected events like the Coronavirus create large deviations between those educated guesses and actual results.
In the case of the Coronavirus, it’s disrupting the revenue stream of many companies that produce and sell goods across the globe. For example, Nike receives 17% of its revenue from China, and the company has temporarily closed more than half of its stores in China. The stores that remain open are operating on abbreviated hours. If the stores are not open, then they can’t sell Nike shoes and apparel, which will most likely cause Nike’s Q1 revenue to be lower than expected. That in turn could cause the stock price to drop once the Q1 earnings report is released later this year.
But it’s not just Nike. The S&P 500 Index is made up of a lot of companies that sell goods in China and other locations around the world: Apple, Yum Brands, McDonalds, Proctor & Gamble, and the list goes on. Beyond just retail, you have airlines, hotels, and casinos that are being negatively impacted as people cancel travel plans and vacations. The point I’m trying to make is there are real business reasons why the stock market is reacting the way it is, it’s not just displaced fear.
All of these companies are trying to figure out right now what the impact will be to their revenue. The next question then becomes, how much are these companies going to miss by?
Do You Think the Selloff Will Continue?
That leads us into the next questions which is “do you think the selloff will continue?” Historically, contagious disease outbreaks have been quickly contained, such as the SARS outbreak in the early 2000’s. The amount of damage to the markets seems to be highly correlated to the amount of time it takes to contain the outbreak. The longer it takes to contain the outbreak, the longer it takes people to return to work and to return to their normal spending habits. The news broke this morning that there are new confirmed cases of the Coronavirus in Italy and South Korea which makes investors question whether or not the threat has been contained.
Unfortunately, there is no solid answer as to how long the current selloff might last. It could end tomorrow or it could continue off and on over the next few weeks. But it’s important to remember that even though market events like the Coronavirus do impact the short-term profitability of companies, it’s less common that these types of events impact the long-term performance. When you have a selloff sparked by a single market event versus a full blown recession, it’s not uncommon for long term investors to start stepping into the market and buying stocks at these lower levels.
Should You Be Moving Money Out Of Stocks Into Bonds?
This bring us to the final question, should you be making changes to your investment portfolio based on today’s market events? In my opinion, the answer to that is “no” but I think there is a lesson to be learned for investors that are still overweight stocks in their portfolio. Over the past year, the stock market has appreciated rapidly in value but the growth rate of corporate earnings has lagged behind. When this happens, stocks start to become overvalued, and the market becomes more vulnerable to selloffs.
This week the selloff was sparked by the Coronavirus, a few months from now it could be fears surrounding the elections in the U.S., trade, or some other geopolitical event. When you enter the later stages of an economic expansion, volatility, which has been largely absent from the U.S. stock market over the past few years, becomes a common place. Investors that have elected to stay overweight riskier asset classes in the later stages of this economic cycle, need to make sure they have the risk tolerance and discipline to weather these market selloffs.
Michael Ruger
About Michael……...
Hi, I’m Michael Ruger. I’m the managing partner of Greenbush Financial Group and the creator of the nationally recognized Money Smart Board blog . I created the blog because there are a lot of events in life that require important financial decisions. The goal is to help our readers avoid big financial missteps, discover financial solutions that they were not aware of, and to optimize their financial future.

