How Much Will Your Paycheck Increase In 2018?
U.S taxpayers have a big reason to celebrate this week. By the end of February, you should see your paycheck increase. The government released the new payroll withholding tables this week which will lower the amount of taxes withheld from your paycheck and increase your take home pay. Naturally the next question is "How much will my paycheck go

U.S taxpayers have a big reason to celebrate this week. By the end of February, you should see your paycheck increase. The government released the new payroll withholding tables this week which will lower the amount of taxes withheld from your paycheck and increase your take home pay. Naturally the next question is "How much will my paycheck go up?" Out of curiously, I spent my Saturday morning comparing the 2017 tax tables to the new 2018 tax tables to answer that question. Yes, this is what nerds do on their weekends.
The Calculation
Like most financial calculations, it's long and boring. I will provide you with the cliff notes version. The government provides your company with tax withholding tables that they enter into the payroll system. It tells your employer how much to withhold in fed taxes from each pay check. The three main variables in the calculation are:
Payroll frequency (weekly, bi-weekly, etc)
The number of withholding allowances that you claim
The amount of your pay
Single Filers or Head of Household
If you are a single or head of household tax filer, I ran the following calculations based on a bi-weekly payroll schedule and an employee claiming one withholding allowance. The table below illustrates how much your annual take home pay may increase under the new tax withholding tables at various salary levels.
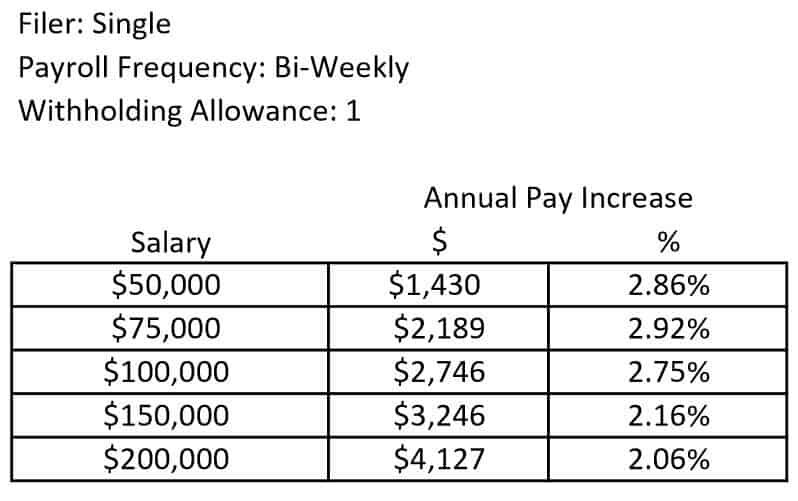
withholding tables - single filer
Based on this analysis, it looks like a single filer’s paycheck will increase between 2% – 3% as soon as the new withholding tables are entered into the payroll system. If you want to know how much your bi-weekly pay will increase, just take the annual numbers listed above and divide them by 26 pay periods. If the payroll frequency at your company is something other than bi-weekly or you claim more than one withholding allowance, your percentage increase in take home pay will deviate from the table listed above.
Married Couples Filing Joint
For employees that are married and file a joint tax return, below is the calculations based on a bi-weekly payroll schedule and two withholding allowances. The table below illustrates how much your annual take home pay may increase under the new tax withholding tables at various salary levels.
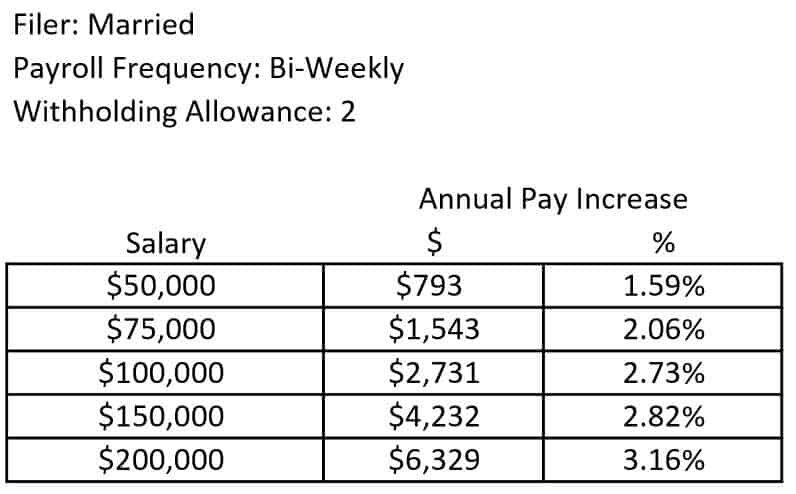
payroll tax withholding table - married
Even though I added an additional withholding allowance in the calculation for the married employee, I was surprised that the “range” of the percentage increase in the take home pay for a married employee was noticeably wider than a single tax filer. As you will see in the table above, the increase in take home pay for an employee in this category range from 1.5% – 3.1%.
Another interesting observation, in the single filer table, the percentage increase in take home pay actually diminished as the employee’s annual compensation increased. In contrast, for the married employee, the percentage increase in annual take home pay gradually increased as the employee’s annual salary increased. Conclusion…..get married in 2018? Nothing says love like new withholding tables.

About Michael.........
Hi, I’m Michael Ruger. I’m the managing partner of Greenbush Financial Group and the creator of the nationally recognized Money Smart Board blog . I created the blog because there are a lot of events in life that require important financial decisions. The goal is to help our readers avoid big financial missteps, discover financial solutions that they were not aware of, and to optimize their financial future.


How Much Will The Value Of Your House Drop Under The New Tax Law?
It's not a secret to anyone at this point that the new tax bill is going to inflict some pain on the U.S. housing market in 2018. The questions that most homeowners and real estate investors are asking is: "How much are home prices likely to decrease within the next year due to the tax changes?" The new $10,000 limitation on SALT deductions, the lower

It's not a secret to anyone at this point that the new tax bill is going to inflict some pain on the U.S. housing market in 2018. The questions that most homeowners and real estate investors are asking is: "How much are home prices likely to decrease within the next year due to the tax changes?" The new $10,000 limitation on SALT deductions, the lower deduction cap mortgages interest, and the higher standard deduction are all lining up to take a bite out of real estate prices. The size of the bite will largely depend on where you live and the value of your house.
3 Bites That Will Hurt
The Trump tax reform made three significant changes to the tax laws that will impact housing prices:
Capped state and local tax ("SALT") deductions at $10,000 (includes property taxes)
Lowered the deduction cap on the first $750,000 of a mortgage
Doubled the standard deduction
The New Standard Deduction
There is a reason why I'm starting this analysis with the doubling of the standard deduction in 2018. For many households in the U.S., the doubling of the standard deduction will make the cap on the SALT deductions irrelevant. Let me explain. Below is a comparison of the standard deduction limits in 2017 versus 2018:

new standard deduction
In 2018, a married couple filing a joint tax return would need over $24,000 in itemized deductions to justify not taking the standard deduction and calling it a day. For a married couple, both W-2 employees, $7,000 in property taxes, $9,000 in state income taxes, if those are their only itemized deductions, then it will most likely makes sense for them to take the $24,000 standard deduction. So the $10,000 cap on property taxes and state income taxes becomes irrelevant because it’s an itemized deduction. This will be a big change for many U.S. households. In 2017, that same family may have itemized because their property and state taxes exceeded the $12,700 standard deduction threshold.
For taxpayers age 65 and older, the new tax law kept the additional standard deduction amounts: $1,250 for single filers and $2,500 for married filing joint which are over and above the normal limits.
$10,000 Cap On State & Local Taxes
Starting in 2018, taxpayers are limited to a $10,000 deduction for a combination of their property taxes, school taxes, and state & local income tax. For states that have both high property taxes and high income taxes like New York, New Jersey, and California, homeowners will most likely be looking at a larger decrease in the value of their homes versus states like Florida that have lower property taxes and no state income taxes. The houses with the higher dollar value may experience a larger drop in price.
If you live in a $200,000 house, the property / school taxes are $5,000, and you decided to sell your house, the family looking to buy your house may already be planning on taking the $24,000 standard deduction at that income level, so the new tax cap would not really decrease the “value” of the house to the potential buyer.
On the flip side, if you own a $600,000 house, your property/school taxes are $18,000, and you are looking to sell your house, the new $10,000 cap will most likely have a negative impact on the value of your house. As you might assume, the individuals and families with the higher incomes that could afford to purchase a $600,000 house will naturally be the homeowners that will continue to itemize their deduction in 2018. So owning that $600K house in 2018 comes at an additional annual cost to the buyer because they lose $8,000 in property tax deductions. For individuals and families in the top federal tax bracket (37%), the cost to live in that house just went up by $3,120 per year. I have personally already had two clients call me that just purchased a house in 2017 with property taxes above the $10,000 cap and they said “I might not have purchased this big of a house if I knew I was not going to be able to deduct all of the property taxes”.
$750,000 Deduction Cap On Mortgages
Prior to 2018, taxpayers could only deduct interest on the first $1,000,000 of a mortgage. For all new mortgages, beginning in 2018, the cap was reduced from $1,000,000 to $750,000. The new tax law grandfathered the $1M cap for mortgages that were already in existence prior to December 31, 2017. Obviously this change will only impact very high income earning individuals and families living in houses valued at $1M+ but it still may have a negative impact on the prices of those big houses. I say "may" because if you can afford a $3M condo in Manhattan, you may not care that you lost a $7,500 tax deduction.
It Depends Where You Live
Given these changes to tax law, it seems likely that the states with higher property taxes and higher home values will be the most vulnerable to price adjustments. Below is a map, from Zillow and Credit Suisse, showing the median home price by state:
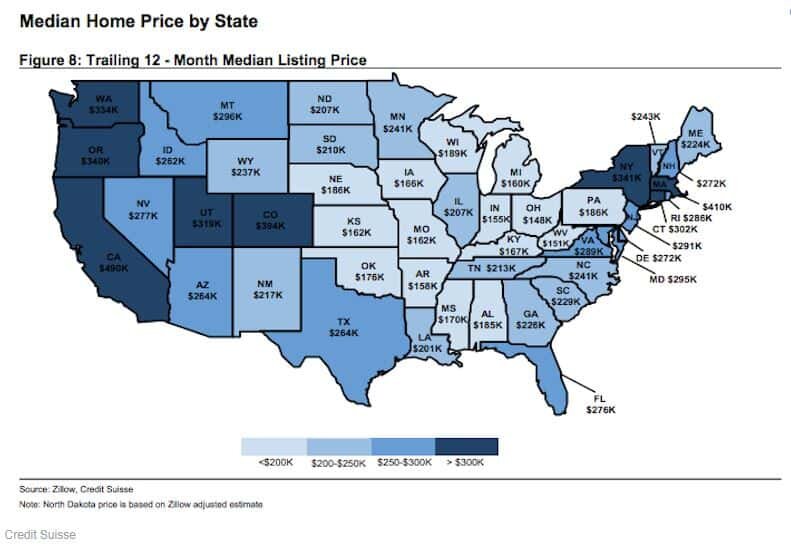
median home price
Let's also locate the states that have a high concentration of mortgages over $500,000. As mentioned above, this may put price pressure on homeowners trying to sell houses above the new $750,000 mortgage interest deduction threshold:
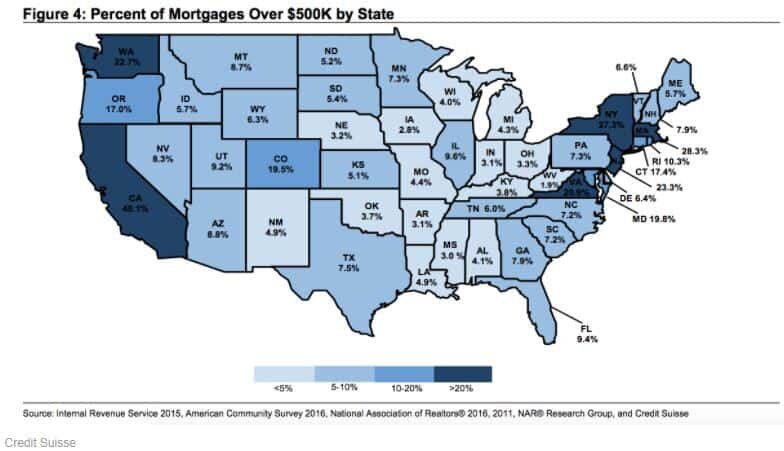
states with high mortgages
And the "Non-Winners" are New York, California, and New Jersey. Moody's published a list of the 25 counties that are expect to lose the largest percentage of value. Note, that only six of those counties are located outside of New York or New Jersey:

tax reform impact on housing prices
To bring it all together, Moody's and FHFA published the illustration below showing the percentage change in the Federal Housing Finance Agency – House Price Index as a result of the new tax bill:
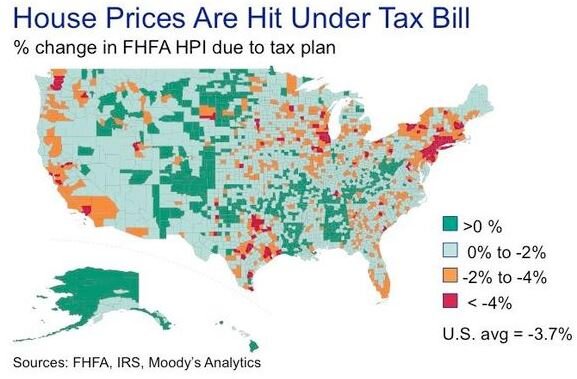
house price decline
It's safe to assume that geographically, the negative impact that the new tax rules will have on the U.S. house market will occur in concentrated pockets as opposed to a widespread reduction in housing prices across the country.
Do Not Move To Alaska Just Yet!!
Before you show the chart above to your family at dinner tonight with a “Go Alaska” hat on, I urge you to read on. (Disclosure, I have nothing against Alaska. I was born in Fairbanks, Alaska) If you live in one of the “red spots” on the heat map above or in one of the counties in the list of “where home prices could stall after tax reform”, the charts above do not necessarily mean that at the end of 2018 your house is going to be worth 5% less than it was at the beginning of 2018. Moody’s has done the comparison of the tax bill passing versus no tax bill. If prior to the tax bill being passed it was estimated in 2018 that homes in your area were going to increase in value by 5% and the heat map above shows a 4% drop as a result of tax reform, then that means instead the value of your home growing by 5% it may only grow by 1%.
As with any forecast, it’s anyone’s guess at this point how the math will actually work itself out but in general I think it will be more positive than the consensus expects.
House Values Under $250,000 – Status Quo
Given the changes to the tax law, if you live in a house that is valued under $250,000, regardless of where you live, the downward pressure on the price of your house as a result of tax reform should be minimal. Why? Most buyers in this range will most likely be electing the standard deduction anyways so the new $10,000 cap on SALT deductions should have little to no impact. This should even be true for states that have high property taxes because the homeowners would need over $24,000 in itemized deductions before the $10,000 cap would potentially hurt them tax wise.
The Sandwich: House Values $250,000 - $750,000
The homeowners at the highest risk of a reduction in the value of their house are located in what I call “The Sandwich”. They have a house that is valued somewhere between $250,000 – $750,000 and they live in a high property tax state. While Congress touts that the doubling of the standard deduction is a “fix all” for all of the tax deductions that have been taken away, it’s unfortunately not. There are a number of individuals and families that are in the income range customarily associated with buying a $250K – $750K house that may actually pay more in taxes under the new rules.
Taxpayers in this group are also moving from their “starter house” in their first “big house”. Unlike the super wealthy that may care less about paying an extra $5,000 in taxes per year, for an upper middle class family that has kids, that is saving for college, and contributing to 401(k) plans, the loss of that tax benefit may mean they can’t take a family vacation if they buy that bigger house. Less buyers in the market for houses in this “Sandwich” range translates to lower prices.
How much lower? Probably nothing dramatic in the short term because the U.S. economy is doing so well. When the economy is growing, people feel secure in their jobs, wages are going up, workers are getting bonuses, and that provides them with the additional income needed to make that larger mortgage payment and pay a little more in taxes.
My concern would be for someone that is planning to purchase a house and then sell within the next 5 years. If the economy goes into a recession, people start losing their jobs, and the U.S. consumer starts look for more ways to stretch their dollars, the homeowners that stretched themselves to buy the bigger house based on the big bonus that they received when the economy was humming are at a big risk of losing their house. In addition, there may be fewer buyers in the market because families may not want to waste money on property taxes that they can’t deduct.
The Millionaire Club: House Values $750,000+
It would seem that houses in the $750,000+ range have the most lose to for two reasons. First, homeowners in this category pay the highest property taxes and they are typically not electing the standard deduction at this income level. Second, home buyers at this price point would also be negatively impacted by the lower $750,000 cap on the mortgage interest deduction.
But I doubt this will be the case. Why? There is only so much lake front property. If you make over $5M per year and you fall in love with a lake house in upstate New York that has a $1.5M price tag, while you could try to find a similar lake house in a more tax friendly state, if you make $5M per year, what’s another $15,000 in expenses for buy your first choice.
About Michael.........
Hi, I’m Michael Ruger. I’m the managing partner of Greenbush Financial Group and the creator of the nationally recognized Money Smart Board blog . I created the blog because there are a lot of events in life that require important financial decisions. The goal is to help our readers avoid big financial missteps, discover financial solutions that they were not aware of, and to optimize their financial future.